Introduction and summary
The United States faces a widening chasm in outlook and opportunity. While the wealthiest Americans have captured the lion’s share of returns in the economy, college-educated Americans have largely continued to prosper under many of the economic forces and policies that have reshaped the 21st century economy. But for millions of American workers—and particularly those without a four-year college degree—these powerful forces have exerted downward pressure on employment and wage growth, job quality, and opportunity in their communities. To make matters even worse, this decline in opportunity has been further exacerbated by long-standing inequities in our country. The effects have been particularly pronounced in certain regions.
We can see our nation’s widening chasm when we compare the stark contrast between the overall condition of the American economy and our current political climate. By several traditional measures, the U.S. economy is doing well. Since the lowest depths of the Great Recession in 2009, the national unemployment rate has declined from double digits to below 4 percent; real GDP growth has been positive in nearly every quarter; and corporate profits have grown robustly. If measures such as these adequately reflected the economic situation of individuals and households, we would expect that people would feel economically secure and reasonably confident about their economic prospects.
But the undeniable reality is that too many Americans feel deeply insecure about their prospects and future. Moreover, upward mobility feels and is increasingly out of reach for workers who have not gone to college. Together, these forces are having economic, social, and political impacts. The plan we set out here is aimed at countering those forces by making good work with decent pay available for all Americans.
And if we look beyond the headline unemployment rate, the American economy is, in fact, still far from achieving full employment among adults in their prime working years. While the headline unemployment rate does capture meaningful progress since the depths of the Great Recession, targeting a low headline unemployment rate is not sufficiently ambitious if we want to address the true labor market challenges we face. To offer one indicator of why: If the labor force participation rate for 16- to 65-year-olds, which is now 72.9 percent, were to return to its 2000 peak level of 76.5 percent, there would be an additional 7.6 million workers in the labor force—which would raise the unemployment rate of those aged 16 to 65 from 4.2 percent to 8.7 percent.
The pain from this jobs shortfall is disproportionately concentrated among Americans without four-year college degrees. Many have left the labor market with no good prospects for decent employment, are underemployed, or are struggling to piece together work to barely make ends meet. And of those workers, it is even worse for women, people of color, and certain other demographic groups. Certain pockets of the country—including rural America, hard-hit manufacturing communities, and areas with long-standing and concentrated poverty—have been hit particularly hard. The impact can be felt in sluggish wage growth that leaves many who are employed still feeling like they are falling behind.
A range of forces lies behind the economic struggles of working Americans. The real wages of workers without a four-year degree, which have been essentially stagnant for decades, have yet to fully recover from declines the Great Recession produced. In addition, the increase in women’s labor force participation—which helped many families to overcome years of anemic income growth—has stalled, due in large part to the failure of public policy to ease caregiving responsibilities, which, today, disproportionately fall upon women. Moreover, in recent decades, good jobs have become increasingly scarce, especially in certain industries and geographic regions. These developments, in turn, have caused entire communities to fall further behind the rest of the country. Certain groups, including people of color and those with disabilities, have been hit even harder by these trends.
The pain being felt by the American people reflects deep, long-brewing market and policy failures. And neither the free market nor tax cuts for the wealthy and large corporations have—nor will—address their hardship.
But it does not have to be this way. America can seize this opportunity to chart a new path forward. We can confront and overcome the economic challenges facing America’s workers, but only through substantial, sweeping changes to the nation’s economic policies. It is time for a bold new set of initiatives to create good jobs—ones that will provide much-needed employment opportunities for American workers, address many of our society’s pressing needs, and provide a bedrock for thriving communities.
“Blueprint for the 21st Century: A Plan for Better Jobs and Stronger Communities” is designed to raise working-class wages and employment. It will create 4 million jobs through an approach that both addresses some of our most pressing national needs and focuses particular assistance on communities that have been left particularly far behind. It will deliver higher wages by tightening labor markets and taking steps that change the rules of the game to strengthen worker bargaining power.
These jobs will be created primarily by making a series of major investments to address some of America’s most pressing 21st century challenges. As part of the Jobs Blueprint, the Center for American Progress proposes five major initiatives that will provide high quality, affordable child care; rebuild America’s infrastructure; modernize K-12 schools; prepare America’s communities and housing stock for the effects of climate change; and provide critical supports to senior citizens and persons with disabilities. We propose investing in America’s physical capital and human capital for the 21st century—investments that the market will not make by itself. Together, these nationwide investments will create more than 3 million new jobs.
Furthermore, in the most economically distressed areas of the country, CAP proposes a job guarantee that, we estimate, about 1.2 million persons will take up. Approximately one-quarter of the jobs needed to meet that estimated adoption rate will already be created by the major investment initiatives of the Jobs Blueprint. Additionally, about three-quarters of these jobs, or 900,000, will be new jobs specifically created to facilitate the implementation of the guarantee. This proposal builds upon the ongoing policy conversation around a job guarantee as a measure to achieve full employment, spurred by scholars and advocates who have brought the idea to the forefront of the conversation.1
Under our 21st century Jobs Blueprint, the major national investment initiatives, together with a targeted job guarantee, will create enough jobs to move the economy substantially toward full employment. By tightening labor markets, these new jobs will raise wages, even as they help our country meet pressing national needs. Critically, their combined scope will have a major effect on both the highly distressed communities specifically targeted in the job guarantee but also on other communities that, although they are not selected under the particular distressed-community index utilized in this plan, nonetheless may be facing significant economic challenges.
The Jobs Blueprint stands up a new paid training initiative to help workers prepare to fill jobs that will be created under the plan. To address a decline in the bargaining power of workers over several decades, it proposes fundamental changes to the rules governing the labor market, including policies to encourage industry-wide bargaining; wage boards to set pay and benefit standards; and expanded bargaining rights for all workers. These changes can benefit not only workers in the jobs created by this plan but also all American workers. Finally, the plan proposes to raise the minimum wage to $15 per hour by 2024 as a means to ensure that lower-wage workers can earn a reasonable income. This new higher wage floor applies to every job created under this plan and beyond it.
The goal of the Blueprint for the 21st Century is basic yet powerful: Address the serious economic challenge facing working-class Americans of all races and backgrounds by providing them with higher wages and the opportunity to work in jobs that also address many of the country’s most pressing needs.
These challenges have been years in the making, and the solutions proposed will take time to implement. As described below, the proposals in this Jobs Blueprint are meant to be supplemented by protecting and strengthening automatic stabilizers that help respond to economic downturn and the use of other monetary, fiscal, and policy tools that are meant to address cyclical economic changes. Beyond this plan, in upcoming reports CAP will be offering additional proposals that are central to a progressive economic agenda. Yet, critically, the Blueprint signals a major new commitment on the part of America as a united and democratic society: guaranteeing a fair day’s pay and a good job for people in communities who are struggling and striving. Every person who can work and wants to work should have the chance to do so—and this Jobs Blueprint creates a template for meeting that promise.
The Jobs Blueprint
The Blueprint for the 21st Century, or Jobs Blueprint, proposes a series of initiatives aimed at addressing serious economic problems that the market has failed to: the insufficient demand for the labor of workers without four-year college degrees, the stagnation of wages and decline of bargaining power of those workers, and the insufficient physical and human capital investments that America needs as a 21st century economy. To address these challenges, the plan creates approximately 4 million jobs, primarily for workers without four-year college degrees, first, through five major investments in essential physical and human capital that will have a positive, lasting impact on U.S. economic competitiveness and working-class economic security. In addition, it provides a geographically targeted job guarantee for the most distressed communities and supports paid training opportunities. It enables workers to secure higher wages by reinventing the tools of bargaining, and it also raises the minimum wage to $15 by 2024 and indexes it to the median wage.
Specifically, the plan recommends:
Nationwide investments to modernize the U.S. economy and advance American workers
Five strategic and large-scale investments would bring the U.S. economy into the 21st century, boost working-class economic security, and create more than 3 million jobs. These investments include: ensuring that all families have access to quality, affordable child care; rebuilding America’s infrastructure; modernizing K-12 schools; preparing our communities and housing stock for natural disasters and extreme weather; and helping older Americans and people with disabilities thrive in their communities by investing in long-term services and supports. They represent a significant increase in jobs and wage-growth opportunities for working-class Americans and will be deployed nationally, including in communities facing economic distress but that are not covered by the plan’s targeted job guarantee. Moreover, the investments are designed to have a long-term effect. When implemented, they will expand and support working class employment for a decade or longer.
In addition, these nationwide investments will strengthen U.S. economic competitiveness by securing a healthier and more educated workforce, providing a modern infrastructure to support businesses and households, and enabling communities to respond to the challenge of climate change—all of which lays the groundwork for future economic growth. The investments will also increase overall labor force participation by supporting people with caregiving responsibilities, by improving workers’ transportation options and commutes, and by ensuring people with disabilities have the services and supports they need in order to live independently. Lastly, the investments will address many of the major strains on working families’ pocketbooks, including unaffordable child care; unattainable supports for aging, sick, or disabled loved ones; and high energy bills. All jobs will meet a minimum standard of pay and benefits.
A promise to communities left behind
While the nationwide investments outlined above will provide a significant boost to American communities nationwide, additional tools will be needed to assist the economies of America’s most highly distressed areas. The United States has experienced real growth as the forces of globalization and technology are rewarding parts of the U.S. economy well. But these forces are not helping all parts of the country equally. Some of these areas have fallen behind in recent years due to increasing automation, offshoring, or market concentration, while other areas have experienced persistent poverty or lack of opportunity for decades. CAP proposes a federal job guarantee designed to help them overcome these challenges by delivering an additional boost of investment and employment opportunity over and beyond the nationwide investments.
In these hardest-hit counties—which comprise 10 percent of the U.S. population—the Jobs Blueprint proposes that all long-term residents who want to work be guaranteed a job. These jobs may be either private jobs supported by the public sector or in the public sector itself. While many of the workers requesting a job in these communities would be matched to a nationwide investment job located within their commuting zone, eligible communities will receive federal support to create additional jobs to meet a variety of local community needs, such as support services in schools and libraries; outreach and peer support to people struggling with substance abuse; and cleanups to fight blight and support agriculture, the recreational economy, conservation, and the health of local communities.
These communities cover rural and urban pockets of considerable economic challenges, such as Philadelphia, the Bronx, and Baltimore on the East Coast; Wayne County, Michigan, and St. Louis in the Midwest; Fresno and Kern counties in California; and a variety of counties in the Southwest, Texas, and the Gulf Coast. Many communities left behind by growth are not household names: Pike County, Alabama; Coconino County, Arizona; Decatur County, Iowa; Douglas County, Oregon; and Lincoln County, West Virginia. And, indeed, many rural areas also face economic challenges, as just more than half of the highly distressed counties have populations of 20,000 or less. As policy leaders, we should be concerned by economic stagnation in both Appalachia and Detroit.
Job guarantee communities will be eligible for at least five years and will be empowered to administer the jobs program locally, subject to oversight and protections against discrimination. CAP estimates that 1.2 million eligible workers will participate in the program each year, of which, we estimate approximately 300,000 will be able to find work through one of the nationwide investment initiatives.
Provide a ladder up for workers
Jobs that the nationwide investments and job guarantee create should function as long-term commitments to workers that have long been trapped in a cycle of low-wage jobs with little opportunity for advancement. Indeed, workers with limited education or training beyond high school face significant challenges in obtaining good jobs with decent wages and have little ability to invest in needed training while employers have pulled back on offering such training. These challenges are particularly acute for people who already face steep barriers to employment, including people who are low-income or have less education. In addition, regardless of educational attainment or income status, women, people of color, LGBTQ people, people with disabilities, and individuals with criminal records face barriers in the labor market. As a result, the Jobs Blueprint will support paid training positions—allowing participants to participate in training relevant to their chosen field while earning full-time wages—to ensure that all eligible workers have access to the training needed to obtain jobs under the nationwide investments. Many of the jobs our proposal would create—such as home health aides and personal care providers; jobs requiring carpentry and electrical skills needed to make rooftops solar-ready; and early childhood educators—require some education or training beyond high school.
Finally, to raise standards for participating workers and exert upward pressure on private-sector standards, all jobs and training opportunities created under the Jobs Blueprint would be subject to standards that ensure workers receive decent pay, enjoy the freedom to join together in unions, and do not face discrimination. These jobs would pay wages, at a minimum, consistent with proposals to raise the minimum wage to $15 by 2024 and index it to the median wage while providing benefits such as health care, paid sick days, and comprehensive paid family and medical leave (as covered in other CAP proposals). However, federal prevailing wage and benefit protections will apply to these jobs to prevent displacement of existing higher wage workers. Finally, employing entities and the federal government would be required to take action to ensure that all participants have an equal opportunity for employment in public and publicly supported jobs and paid training slots.
Raise wages and rebuild economic power for all American workers
The job-creating nationwide investments, job guarantee, and paid training proposals outlined above will go a long way toward meeting the long-lasting challenge of declining demand for the labor of America’s workers and the stagnation of workers’ wages. But to restore American workers to middle-class economic stability, boost workers’ pay, and create economic opportunity for all, additional reforms will be needed to shift economic power back in the direction of workers. To help do so, the Jobs Blueprint would enact a set of reforms to help strengthen the power of workers to form a union and collectively bargain and would raise the minimum wage for all workers to $15 by 2024, indexing to the median wage thereafter. The Jobs Blueprint would implement toward industry-level bargaining that will bring together representatives of workers, businesses, and the public to set minimum pay and benefit standards for industries and occupations—policies that can help to alleviate existing gender and racial wage gaps.
In the coming months, CAP also intends to offer further reforms to address the growing concentration of economic power, boost small business, enhance affordable housing opportunities, invest in rural America, and further boost economic opportunity for American working families.
The economic challenge facing American workers
Trends in employment and wages
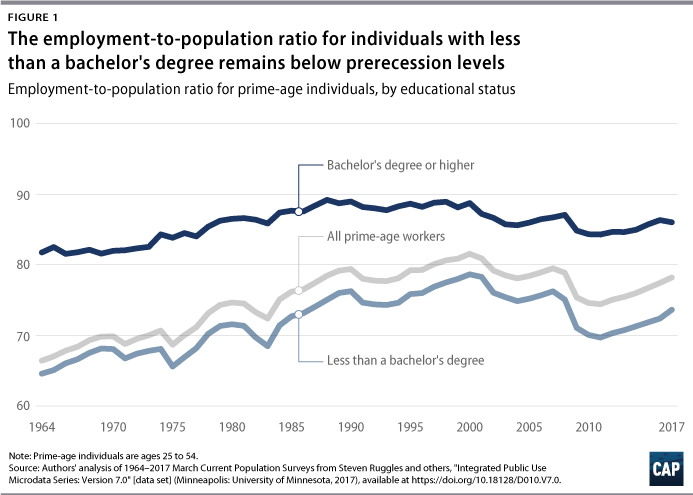
While there have been marked improvements since the economy began to recover from the financial crisis and Great Recession, the recovery has been insufficient to overcome declines in the employment rate and the wage rate of working-class Americans that began in the year 2000.2 (For analytic purposes, this report loosely defines working-class Americans as individuals in the labor force with less than a four-year college degree.) As shown in Figure 1 below, the employment rate for all prime-age workers (those ages 25 to 54) remains 3.4 percentage points below the level that it reached in the year 2000; the employment rate for the prime-age working class remains 5 percentage points below the peak it reached that same year.
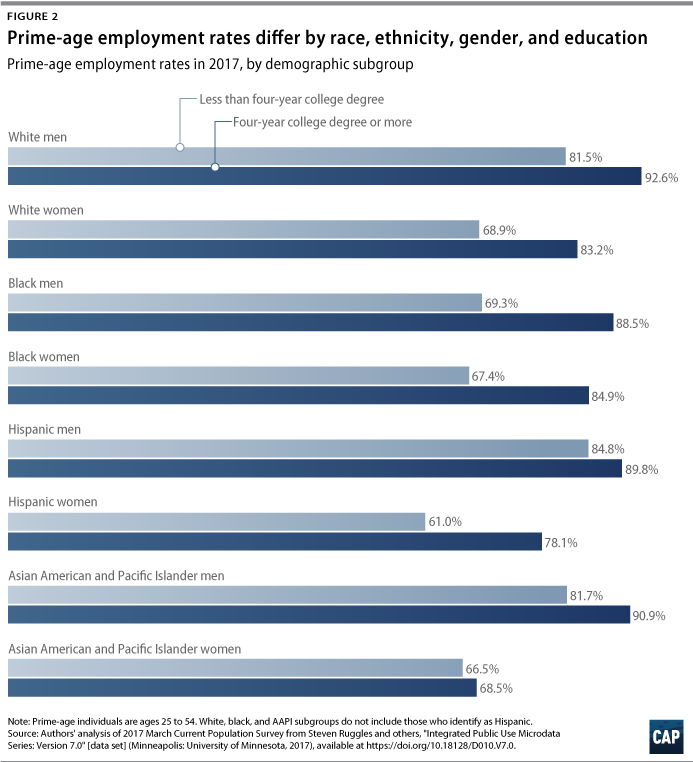
As shown in Figure 2, certain demographic groups fared disproportionately worse in the labor market. Among workers without a four-year college degree, black men have seen the greatest drop in prime-age employment from 2000, with their prime-age employment rate falling 7.6 percentage points to 69.3 percent.3 Prime-age white men still enjoy a relatively high employment rate among those without college degrees but have seen a 6 percentage point drop since 2000. Female employment for those without college degrees has fallen as well, with white women and black women’s employment rate dropping since 2000 by more than 5 percentage points to 68.9 percent and 67.4 percent, respectively.
While workers without college degrees have seen the largest employment challenges in the 21st century, some groups of college-educated workers have similarly seen their employment rates decline. For example, college-educated black and Asian American and Pacific Islander (AAPI) female prime-age employment rates have dropped by 4.9 percentage points and 5 percentage points, respectively, since 2000. Employment rates of prime-age college-educated Hispanic men have fallen by 4.2 percentage points.
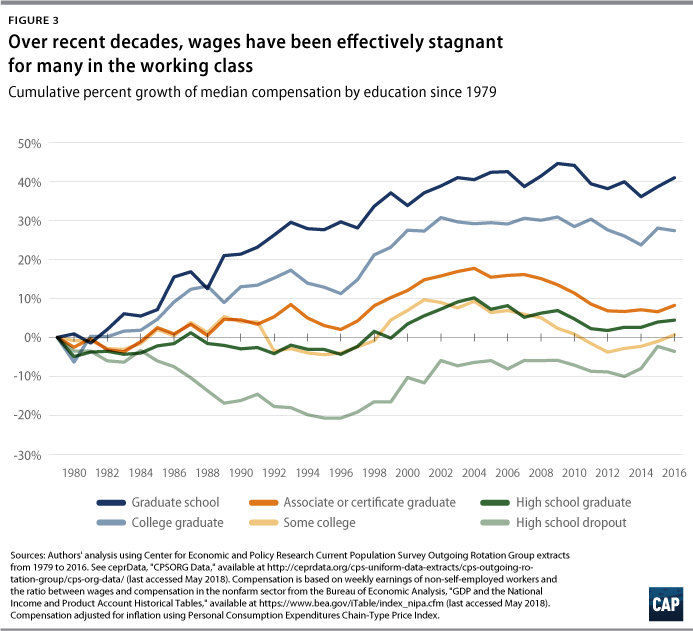
The real compensation of the working class, which has been nearly stagnant from 1979 to 2016, remains below levels previously achieved.4 Between 1979 and 2000, median compensation for those with at least a four-year degree increased 31 percent in real terms, while median compensation for all other workers only increased 4 percent.5 Moreover, the median compensation of workers without a four-year degree grew just 3 percent in real terms from 2000 to 2016. In contrast, weekly compensation of workers with at least a bachelor’s degree has risen by just more than 7 percent in real terms over the same time period.
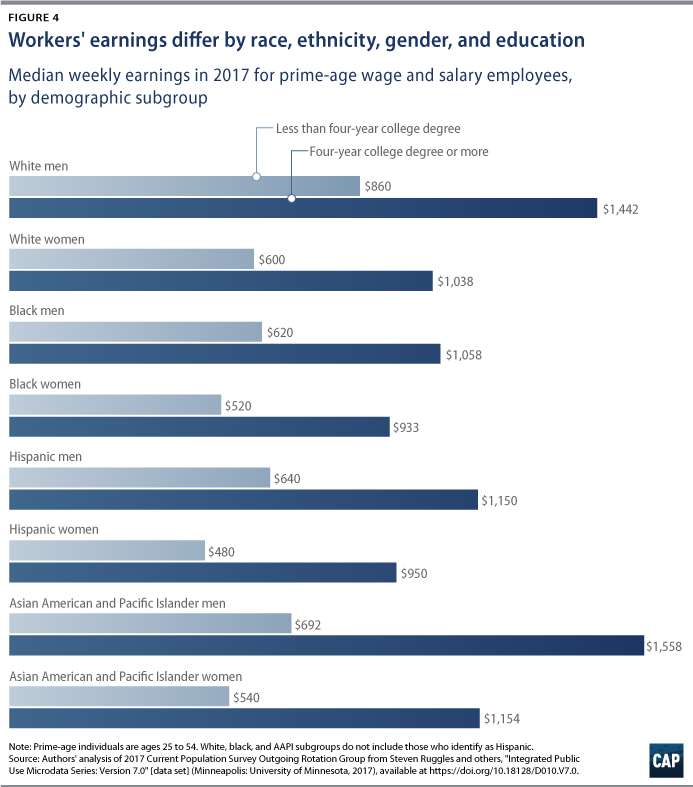
The story is similar when examining wage growth of prime-age workers since 2000. It is clear that workers in their prime working years without four-year college degrees have fared worse overall. And 2017 data show that college-educated workers tend to earn higher weekly wages on average than those without four-year college degrees, as shown in Figure 4. But not all college-educated workers have seen their wages grow in recent years. Among black workers, even college graduates are experiencing sluggish wage growth, with the typical prime-age college-educated black man seeing just a 1.5 percent increase in his weekly wage earnings and the typical prime-age college-educated black woman seeing declining pay since 2000.6 And while the median prime-age member of the working class has seen just stagnant real weekly wages, working class black men and women, white men, and AAPI men and women in their prime have actually seen their median weekly earnings decline since 2000.
It is also important to note, as shown in Figure 3, that inequality is also growing among those with at least a four-year degree. Those with the highest levels of education are pulling further away from those with just a bachelor’s degree.
The working class increasingly consists of service-sector workers, workers of color, and women
Today’s working class—who we roughly define to cover those without a four-year college degree—are a diverse group across demographical and industrial lines.7 In 2015, more than three-quarters of the working class worked in the service sector compared to 21 percent in industrial sectors of manufacturing, construction, and mining. And service sector workers have actually always made up a major part of working-class jobs: Working-class industrial employment peaked in 1960 at 37 percent.8
The non-Hispanic white share of the working class is also on the decline. While non-Hispanic white people make up 64 percent of the U.S. adult population, they are just 59 percent of the working class. One in 5 working-class workers are Hispanic, while 14 percent are black.9
Women now make up 46 percent of the working class. This share has risen from about one-third of the working class in 1960 but has remained roughly stagnant since 1990 as female labor force participation growth slowed and female educational attainment has risen.10
In 2015, roughly 7.5 million workers in the working class had a disability, although many people with disabilities are kept out of the labor force due to inadequate supports.11
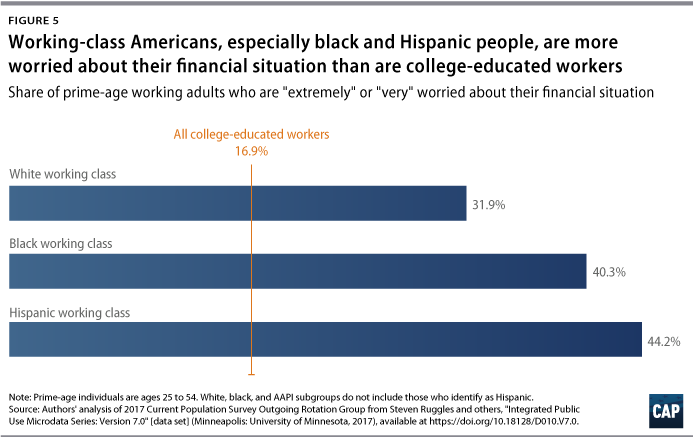
The combination of wage stagnation and employment decline has resulted in declining household incomes for working-class families. Median real incomes for households with children headed by a worker without a four-year degree have declined since 2000. It is unsurprising, then, that more than 30 percent of working-class Americans indicate they are “extremely” or “very” worried about their financial situation. 12 This is twice the rate for college-educated Americans, and it only grows larger for communities of color. In fact, a January 2018 poll conducted by GBA Strategies and commissioned by CAP revealed that nearly half (48 percent) of voters report a serious problem with “finding a decent job with good wages.”13
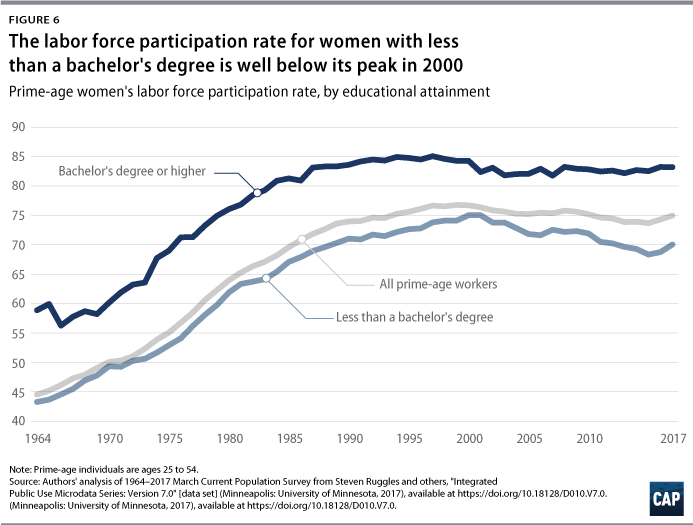
For several decades, middle- and working-class families counteracted stagnating wages first by working more hours and then by taking on more debt. The increase in labor supply was, principally, the consequence of increasing numbers of women entering the labor force. As Figure 6 shows, working-class female labor force participation increased by 31.8 percentage points between 1964 and 2000, raising overall employment rates even though male labor force participation declined. Participation rates for women have declined since then, and research suggests that insufficient support, such as child care, paid family leave, and long-term supports and services, present significant obstacles to economic security and opportunity for both working-class families and women in particular.14
After the year 2000, as households exhausted their ability to work more hours, they increasingly tapped their savings and took on more debt. These trends were more pronounced in areas where real incomes were declining. Unfortunately, the 2008 financial crisis and Great Recession devastated these workers who were made newly vulnerable because of higher debt levels.15
General sources of employment decline and wage stagnation
The reduction in employment rates since 2000 are, in large measure, the result of insufficient private sector demand for labor. A careful review of the evidence on the 60-year decline in prime-age male labor force participation, issued by the Council of Economic Advisers in 2016, concludes that “reductions in the demand for labor, especially for lower-skilled men, appear to be an important component of the decline in the male labor force participation rate.” By contrast, reductions in labor supply—for example, from increased reliance on government transfer payments or spousal income—explain relatively little.16 A recent review of the evidence on the aggregate employment rate also concludes that labor-demand factors are the most important causes of its decline, with labor-supply factors playing a less important though nonnegligible role.17
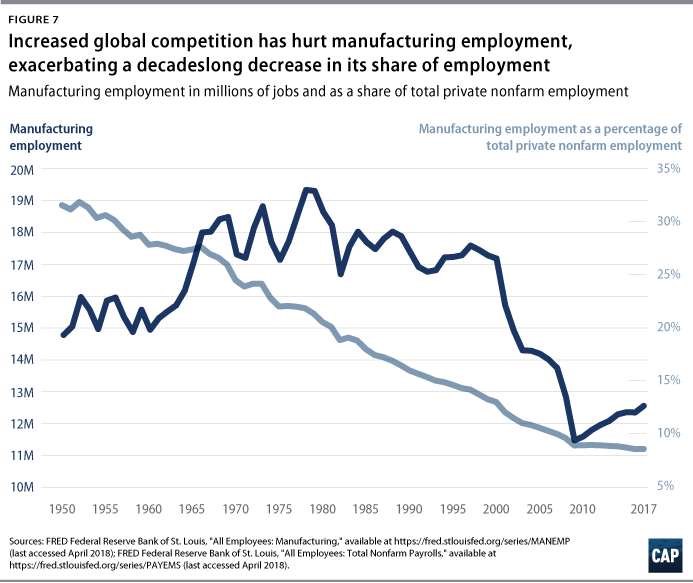
The decline in private demand for labor has multiple sources. Technological change increases worker productivity but does not guarantee a compensating increase in demand for the products that can be produced with greater efficiency. Trends in the manufacturing sector illustrate this dynamic. Between 1970 and 2000, U.S. manufacturing output increased, but employment in the sector was roughly stable, as productivity also increased. 18 Together with offshoring, this led to a drop in the manufacturing share of total nonfarm employment from about 25 percent in 1970, to about 13 percent in 2000, to under 9 percent since the Great Recession. Therefore, historically higher-paying manufacturing jobs represent a decreasing share of total nonfarm employment, with the remaining jobs also being ones that needed higher levels of education.19 This led to workers finding lower-paying jobs in manufacturing or other sectors—or even dropping out of the labor force altogether.
In addition, increased global competition, facilitated by offshoring, has negatively affected employment in sectors most exposed to it. For example, the large increase in U.S. imports from China that began in 2000 saw widely dispersed benefits through cheaper products to American consumers and returns to American businesses and their shareholders. Meanwhile, the workers in industries such as furniture manufacturing and game and toy assembly disproportionately bore the costs in the form of lost jobs and wages.20 Between 1999 to 2011, this reduced employment by more than 2.3 million workers.21 The threat of offshoring also reduced worker bargaining power and, as a result, wages.22
There is also emerging evidence that increased concentration amongst employers in regional labor markets has reduced employment rates.23 The resulting monopsony power—that is, the market-dominating power created when a small number of employers in a given labor market employ a large share of workers—contributes to lower employment and lower wages. By one recent estimate, monopsony may reduce aggregate employment and output by 13 percent from competitive levels.24
Increased corporate market power in product markets also negatively affects employment. Monopoly power in product markets leads to lower output and employment, and there are several indicators that monopoly power is on the rise—ranging from increased markups over cost to measurable and significant postmerger price increases.25 The impact of increased pricing power also has the effect of reducing the real wage.
While macroeconomic policy could have counteracted this employment decline, policymakers chose not to do so, instead focusing on tax cuts for high earners. Job creation during the cyclical recovery that began in 2001 was remarkably weak, but tax cuts directed at upper-income households had limited demand effects and failed to raise employment rates to previous levels, arguably pushing the Federal Reserve to slow the labor market in the expansion.26 Although the Federal Reserve took extraordinary steps to counteract the Great Recession that began in 2008, monetary policy was insufficient to counteract the huge scale of the downturn. Expansionary federal fiscal policy was limited mostly to the American Recovery and Reinvestment Act of 2009, the effects of which had faded by 2013.27 Congress’ turn toward fiscal austerity, amplifying similar trends in state and local expenditure, helped to slow the recovery and allowed a low employment rate to persist.28 The 2017 tax law, which again directs substantial tax cuts to upper-income households, is expected to produce small employment effects.
Insufficient labor demand—which, as we have illustrated, has many sources—will in itself have a negative effect on real wages. But there are several other factors that have contributed to the wage stagnation we have observed for several decades.
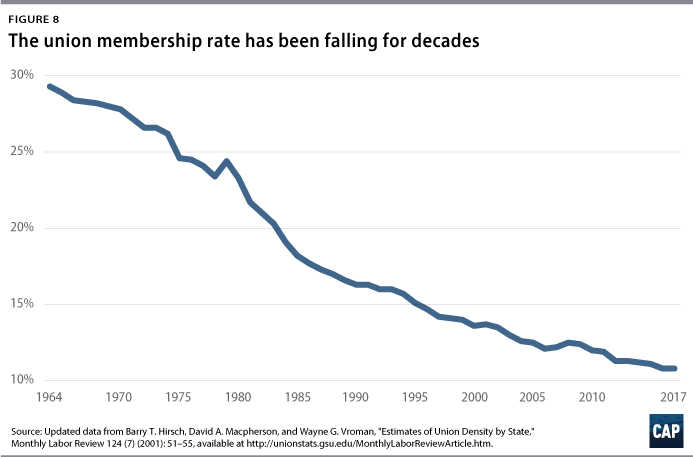
The institutions that sustain worker bargaining power have declined. As Figure 8 shows, union membership rates have fallen from about 30 percent in the mid-1960s to roughly 10 percent today. Unions are vital institutions that help ensure workers share the benefits of productivity gains and are especially critical for women and workers of color, who benefit from better workplace protections and higher wages.29 This steady decline is the result of coordinated political and legal attacks on union membership—an attempt to minimize the leverage workers have to bargain for increased wages and benefits.30
Corporations have also changed the legal form of their relationship with their workforce in ways that shift considerable risk onto workers and reduce worker bargaining power. Many corporations are shedding employees, instead relying on temporary workers; freelance workers and independent contractors; part-time workers; and day laborers to supply an increasing share of their workforce. Today, a significant portion of the American workforce is employed through these so-called contingent work arrangements, with one government study finding that as much as 40 percent of the workforce has recently been subject to such an arrangement.31
Independent contractors do not receive a host of protections afforded to traditional employees—such as coverage under federal minimum wage, overtime, and collective bargaining requirements—and are far less likely to receive company-provided benefits.32 This is, of course, particularly problematic when those workers were not classified correctly and should have received the full range of employee protections and benefits. Similarly, when workers are employed by intermediaries, such as temporary staffing firms, they are often paid very low wages and the incentives to violate the law are high, since intermediaries’ ability to make a profit hinges on low labor costs, and contracting companies are able to avoid direct oversight of legal compliance.
For example, research from the University of California, Berkeley Labor Center finds that janitors working for contracted cleaning companies earned 20 percent less than noncontracted janitors.33 And, in the heavily outsourced coal mining industry, contract miners in underground operations have significantly higher rates of traumatic injuries and exposure to fatality risks compared with direct employees of mining companies.34
A final notable factor in the decline of employment and real wages for working-class workers is the federal minimum wage, which has declined significantly over the past decade in inflation adjusted terms. This has resulted in a clear and stark reduction in the real wages of the lowest earners. Since the last time the federal minimum wage was raised, in 2009, full-time minimum-wage workers have lost nearly $2,370 in annual purchasing power, meaning they need to work an extra 41 days in 2018 to make what they earned in a single year in 2009.35 This reduction, shown in Figure 9, has directly lowered real wages for positions filled by these workers as well as workers earning just above the minimum wage, despite the fact that today’s low-wage workers are significantly more productive, better educated, and older than their counterparts in the past. A similar erosion has occurred in the value of other wage and employee protections, such as overtime coverage and social insurance programs like unemployment insurance, which has further reduced workers’ incomes and bargaining power.36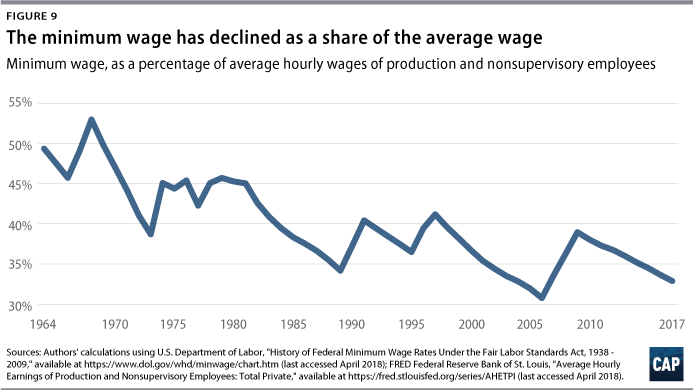
Regional economic disparities
As the U.S. economy has grown in the past few decades, its growth has been increasingly spatially unequal, meaning that there are vast differences in the availability of good jobs, innovation, and resources across places. Discussion around income inequality often focuses on individual earnings, but recent research suggests that this spatial inequality has contributed to a bifurcated economy. The distribution of high- and low-paying jobs across regions has become increasing skewed.37
Historically, the mobility of labor and capital has reduced regional economic differences. For much of the 20th century in the United States, average incomes of states were on a path toward convergence, as poorer states grew at a faster rate than richer ones. But, since 1980, poorer states are not catching up to richer states at anywhere near the same pace.38
These developments are explained, in part, by the benefits that firms derive from economies of agglomeration, where the co-location of firms and access to large pools of qualified workers in one place reduces costs and creates positive spillover effects. The result is the concentration of important industries in a few major places, such as Boston for biotechnology, North Carolina’s Research Triangle for high-tech manufacturing and life sciences, and Silicon Valley for startups and venture capital. 39 There is also evidence that lower-wage workers find it difficult to move to these and other more dynamic areas because the limited supply of affordable housing creates an economic barrier to labor mobility.40
Other factors, such as shocks from increased global competition, which have produced negative effects on employment and wages concentrated in particular regions of the country, have also contributed to spatial inequality.41 For example, the Midwest, which lacks fast growing “supercities” and has been subject to the effects of increased global competition, has done relatively poorly since 2000. In the years preceding the Great Recession, 2000-2007, the Midwest saw the greatest decrease in the prime-age employment rate across census regions: 2.6 percentage points, compared to 1.7 for the South, 0.9 for the West, and 0.7 for the Northeast. Wage growth for prime-age workers was also remarkably slower than in other regions during this period. After the Great Recession, the Midwest continued to experience declines in the employment rate, and wage growth continued to lag.42 Over 2000 to 2016, wage growth in the Midwest was far behind other regions, with nine of the 20 worst performing states located there.43
Racial, gender, and other disparities
Of course, for many groups of workers, low wages and high unemployment are not new phenomena. Even during periods of economic expansion, workers of color have fewer opportunities for economic mobility and are more likely to be economically insecure than whites. For example, the African American unemployment rate is routinely twice the rate of white unemployment.44 Data on wealth—perhaps the most complete measure of an individual or household’s economic well-being—demonstrate substantial inequality by race. In 2016, black household wealth was one-tenth of white wealth, with median wealth for black college-educated households equaling about 70 percent of median wealth of white households without a college degree.45 African Americans are less likely to own assets, such as homes; are less likely to see the same returns for homeownership as whites; and are much more likely to carry costlier debt than whites.46 Similarly, Hispanics face a stark wealth gap. In 2016, the median wealth for Hispanic families was $20,700 compared to $171,000 for white families.47 While AAPI wealth, on average, is similar to their white counterparts, this does not tell the whole story. Wealth inequality within the AAPI population, the fastest growing racial and ethnic group in America, is higher than wealth inequality among white households and has risen over time.48 This higher inequality is due in part to lower rates of homeownership and pension ownership among AAPI people.
People of color also face persistent employment discrimination as well as other barriers to employment. For example, a 2017 analysis by researchers at several top universities found no decline in employment discrimination against African Americans since 1989 and just a moderate decline in discrimination against Latinos.49 Similarly, a recent analysis conducted by Federal Reserve Board staff examining racial disparities in labor market outcomes over the past four decades found a substantial black-white employment gap, which the study’s authors say is largely unexplained by so-called observable factors, such as educational attainment, age, marital status, or geographic location.50 The study’s authors found gaps between white and Hispanic employment as well, although the gaps were largely explained by lower educational attainment levels among Hispanics, particularly among individuals who were foreign-born.51 Additionally, both blacks and Hispanics were more likely to be employed part-time for involuntary reasons. According to a recent Economic Policy Institute analysis, the most common reason for employment disconnection among black and Hispanic men in 2016 was illness or disability, followed by an inability to find work, or caring for family, respectively.52 Black men were much more likely than white or Hispanic men to be out of work involuntarily. Nearly half of black women who were out of work in 2016 were out of work involuntarily.
Black men, especially those without a college education, face perhaps the steepest barriers to the labor market. In 2016, one-quarter of black men with a high school diploma and nearly 50 percent of black men with less than a high school diploma did not work.53 While it is not entirely clear why black men’s nonemployment is so much higher than others, it is likely connected to ongoing employment discrimination as well as our current criminal justice system. The depth and breadth of our criminal justice system disproportionately affects black men, even those not directly connected to the system. Indeed, recent research on policies that prevent employers from making criminal record inquiries on job applications—commonly known as “ban the box”—have found that black men are less likely to receive a callback, regardless of whether or not they have a criminal record. This suggests the extent to which employers are using race as a proxy for criminality when making employment decisions.54
Women face challenges in today’s labor market due in part to attitudes and biases ingrained in American workplace culture.55 Women historically were expected to assume primary responsibility for caring for their families and conform to specific roles—some unpaid and some paid—that either excluded them from participating in the labor market entirely or relegated them to the lowest-paying jobs. These expectations were fueled by biases around gender, race, and ethnicity that too often devalued women’s skills and abilities and limited women’s opportunities for advancement. Women of color, for example, were often confined to care and service sector jobs with low pay, limited mobility, and few—if any—protections to respond to family or medical needs.56 These attitudes have lasting effects today and can affect how workers are treated by their employers.
Today, many women are expected to support their families both at home and at work. But our country’s work-family policies have not kept up with this reality. For example, without access to affordable child care, it is difficult for women who choose to work to obtain and retain a job. And many women lack comprehensive paid leave and scheduling predictability at work, making it even harder to manage work and family.
These challenges combine to keep women earning less than men on average. Due to differences in work hours,57 lack of access to strong work-family policies, occupational segregation,58 and discrimination, women confront a sizable and persistent wage gap—one that is especially large for rural women and women of color.59
Workers with disabilities face persistent discrimination in the labor market, as well as financial, physical, mental health, and other barriers to work. They continue to be dramatically underemployed and paid very low wages relative to their nondisabled counterparts, including being subject to a subminimum wage that can amount to pennies per hour. Their ability to work is additionally compromised by insufficient services and supports, which keep far too many people with disabilities out of the labor force, as well as a lack of key workforce policies, such as paid family and medical leave that are particularly important for workers with disabilities. Disabled workers of color, who face additional barriers, are especially likely to be unemployed or underemployed.60
LGBTQ workers—who still lack explicit, statutory protections from discrimination in most U.S. states as well as at the federal level—bump up against labor market discrimination that can choke off opportunities for employment and advancement. While data on this population are extremely limited, available research suggests that LGBTQ communities—particularly transgender people, LGBTQ people of color, and older LGBTQ people—are less economically secure than their non-LGBTQ peers.61
For example, same-sex couples show a greater likelihood of living in poverty than married different-sex couples, even when controlling for other factors such as employment status, age, and race or ethnicity. One 2017 analysis showed that female same-sex couples evidence the greatest likelihood of living in poverty, relative to married different-sex couples.62 That same analysis showed the power of employment at protecting same-sex couples from experiencing poverty, making the availability of quality job opportunities and the comprehensive protection of civil rights law all the more meaningful.
The largest survey of transgender people to date reported an overall unemployment rate of 15 percent, three times that of the general population when the survey was fielded.63 That rate increased for transgender people of color, with black (20 percent), Latino/a (21 percent), multiracial (22 percent), American Indian (23 percent), and Middle Eastern (35 percent) subgroups all reporting high unemployment. In that survey, 1 in 6 respondents who had ever been employed reported losing a job at some point in their lifetime because of their gender identity or expression.
People with criminal records, particularly, can face lifelong barriers to employment, leaving many unable to move on with their lives long after paying their debt to society.64 The U.S. criminal justice system has grown by more than 500 percent since 1970. Today, there are 2.2 million people in jails or prisons and another 1 in 3 adults are living with a criminal record. 65 People of color—particularly men of color—have taken the brunt of these outdated and racist drug and sentencing policies. Having a minor criminal record can affect the chances for employment, education, housing, and other pillars of economic stability. For example, we know that 1 in 4 workers in America need an occupational license or certificate to work in certain professions. Yet, there are barriers to obtaining such licenses for people returning to communities from jail or prison. These barriers to employment come at a cost to these individual workers and the broader economic opportunities for all workers to obtain better employment and higher wages.
Impacts of extreme weather
Extreme weather events, such as floods, heavy storms, and hurricanes, can expose and exacerbate socio-economic inequities and chronic underinvestment in struggling communities.
Lower-income households are more likely to live in substandard housing stock that is less resilient to extreme weather.66 They also have less disposable income to prepare for disasters.67 A study by the Federal Reserve found that 44 percent of Americans say they could not cover an unexpected $400 expense.68 The unforeseen costs of preparing for a major storm—such as purchasing plywood to board up windows, emergency food supplies, gasoline to drive to safety, or temporary hotel rooms—could far exceed that amount.
Moreover, it is harder for families lacking economic security to recover in the aftermath of a disaster. Researchers at the National Bureau of Economic Research looked at 90 years of disaster data and concluded that severe disasters—which they define as those resulting in 100 or more deaths—caused poverty rates to increase more than 1 percentage point in affected counties. Overall, the researchers found that disasters increase outmigration from affected counties; cause housing prices to decline; and push some households into poverty.69
Investing in our nation: 5 bold initiatives to revitalize communities and address pressing economic needs
Our plan proposes five major investments that will have a real and immediate impact. It will bolster America’s economic competitiveness and improve the quality of life for millions of Americans, all while creating more than 3 million jobs, raising wages, and revitalizing communities suffering from decades of decline and disinvestment.
These nationwide investments will significantly enhance job creation and overall economic opportunities for all working-class Americans, including those living in communities facing economic distress but that are not covered by the job guarantee. Moreover, the initiative is designed to have lasting effects, supporting working-class employment for at least a decade. This longer-term approach to fiscal policy is a profound departure from recent past practice, which, in recent decades, has relied on monetary policy alone to affect employment.70 However, given the challenge that many workers without bachelor’s degrees—and indeed some workers with four-year degrees—face, this new, bolder approach is timely and called for.71
We recommend making these investments in areas where strategic, large-scale investments could dramatically bolster the U.S. economy, improve families’ bottom lines, and provide the foundations for greater economic mobility for today’s children. These investments include:
- Ensuring that all families have access to quality, affordable child care
- Building a 21st century infrastructure, including expanding the system and repairing and replacing aging highways, public transportation, passenger rail systems, and water infrastructure
- Rebuilding the K-12 schools essential to our children’s future
- Preparing homes and communities for the impacts of climate change and saving households money on their energy bills through a new Future-Ready Communities Corps
- Providing long-term services and supports so that more older people and people with disabilities can thrive in their communities
Together, these nationwide investments will strengthen U.S. economic competitiveness by securing a healthier and more educated workforce; providing a modern infrastructure to bring goods to market; and enabling communities to respond to the challenge of climate change—all of which lays the groundwork for future economic growth. These investments will also increase labor force participation by supporting people with caregiving responsibilities; improving workers’ transportation options and commutes; and dramatically expanding access to the long-term services and supports many people with disabilities need to live independently, work, and otherwise fully participate in their communities. These investments will address many of the major strains on families’ pocketbooks, including unaffordable child care; unattainable supports for aging, sick, or disabled loved ones; and high energy bills.
The duration and impact of these initiatives will also be more significant than any fiscal program in recent memory. Infrastructure, K-12 school modernization, and future-ready communities will be undertaken over the next decade to address years of underinvestment, while proposals for child care and long-term services and supports would be permanent.
To accomplish these goals, all jobs created through these nationwide investments would adhere to standards to ensure that workers receive decent pay, enjoy the freedom to join together in unions, and do not face discrimination. Indeed, the federal government has long attached job quality standards to its spending to ensure that it functions as a model employer and does not undercut existing private-sector work—and these jobs would be no exception.72
Initially, at a minimum, these jobs would pay wages consistent with proposals to raise the minimum wage to $15 by 2024 and index it to median wages thereafter. In addition, consistent with other federal policies CAP has proposed or endorses—including the Medicare Extra for All initiative and proposals to expand paid leave—nationwide investment jobs would provide benefits such as health care, paid sick days, and comprehensive paid family and medical leave. 73 However, funding recipients would be required to pay workers existing prevailing wage and benefit rates when those rates are higher. To ensure that workers who want to form a union are able to do so, employing entities would be required to adhere to existing requirements that protect the collective bargaining rights of the federally contracted workforce and prohibited from attempting to persuade workers to exercise or not to exercise their right to bargain collectively.74
Investing in workers by providing good-paying, quality jobs that offer a meaningful opportunity for advancement is an essential foundation for economic security and, eventually, prosperity. Many women, especially women of color, experience a “sticky floor” that keeps them stuck in jobs that have higher turnover, limited flexibility, and lower pay.75
In terms of closing gender wage gaps, the Jobs Blueprint seeks to professionalize and raise wages and job quality in child care and long-term services and support jobs that have traditionally been undervalued because they were disproportionately filled by women and people of color.76 For example, wage boards, which bring together representatives of workers, businesses, and the public to set minimum pay and benefit standards for industries and occupations, are an especially promising tool for raising wages in industries and occupations that have historically devalued the work of women and racial minorities.
At the same time, recognizing that prevailing wages are higher in the male-dominated fields such as infrastructure, CAP recommends significantly higher investment in the Department of Labor’s Women’s Bureau program—Women in Apprenticeship and Nontraditional Occupations—which helps ensure more women have the opportunity to train for high-paying jobs in the trades. This is only one of a series of efforts that are needed to help close wage gaps.
To that end, we would also require the federal government to implement an equity assessment program so that all participants have equal access to employment in publicly supported jobs, regardless of race, color, religion, sex, sexual orientation, disability status, gender identity, or national origin. This is to ensure that populations of workers who have traditionally been shut out of the labor market, including individuals with criminal records, do not continue to lose access to appropriate job opportunities.
Throughout our nation’s history, government institutions have sometimes had a disparate impact on the communities they serve. For example, zoning ordinances initially designed to protect people from public health hazards were transformed over time into mechanisms to separate communities; protect individual property rights at the expense of the social good; and exclude “undesirables.”77 Many well-intentioned policies have reinforced disparate outcomes in practice. This has led to persistent structural barriers, economic inequality, and low intergenerational mobility.78 To safeguard against this, CAP wants to proactively build in a process to ensure equitable access to jobs.
These plans would be similar to standard policies followed by all federal contractors. They would require an analysis of the existing population of dislocated and low-wage workers by demographic status and affirmative action goals; identify barriers to reaching these goals and actions to overcome these barriers; and implement plans to address implicit bias in hiring and screening of applicants.79
While the allotment of nationwide investment funds across communities will be driven by area needs, prior to fund allotment, the federal government would work with local communities to develop and maintain a plan to take the proper steps at conception to ensure that all individuals have equal access for employment in the five publicly supported jobs fields: child care, long-term services and supports, infrastructure-related work, and paid training.
The following sections outline the goal, rationale, design, and impact of these five nationwide investments that, together, will create more than 3 million new jobs.
Nationwide investment 1: Ensure affordable, quality child care for all
With more dual earner families and single-headed households, American families are increasingly reliant on child care to work. Among children under age 6, 65 percent have all parents in the workforce.80 Three-quarters of women with school-age children work, meaning that millions of families need after-school care and child care during the summer months.81
Yet, finding affordable child care is a common stumbling block for working parents. The average annual tuition at a child care center exceeds $10,000 per year, and a quality program that compensates its teachers to reflect the value of their highly skilled work can cost more than double that.82 While these costs can put child care out of reach for lower-income families, even parents who can afford high child care costs often struggle to find high-quality child care. Approximately half of Americans live in a “child care desert,” where the supply of licensed child care centers and homes is well below the need.83 Not surprisingly with these challenges, an estimated 2 million parents annually experience a career interruption due to child care issues.84 Countless other families make financial sacrifices or experience the stress of patching together child care on a weekly or even daily basis.
The 2 million members of the early childhood workforce fulfill a critical role for American families and the economy.85 The vast majority of early educators are women, and women of color and women who were born outside the United States are overrepresented. In addition to the vital role that early educators play in the U.S. economy, they also support early childhood development during a critically important time. In the first few years of life, children are experiencing rapid growth and brain development, making 1 million new neural connections each second.86 Early experiences play an outsized role in future learning and development. When young children have sensitive caregivers and enriching early learning opportunities, they develop brain architecture that sets them up for healthy development throughout their lifecycle.
High-quality child care and early education is largely dependent on the skills and competencies of the adults in settings such as schools, child care centers, and homes who interact with young children each day. Despite the importance of early education, however, educators experience low compensation and poor working conditions, and the current child care system is not set up to promote high-quality child care. The average wage is about $10 per hour and about half of early educators rely on public assistance programs to meet their basic needs, such as food and health care.87 This creates frequent turnover and also means that early educators experience the stress associated with living in poverty. Both of these consequences result in the disruption of the critical relationships and positive interactions between children and educators that form the backbone of high-quality early childhood education.
To address child care affordability, quality, and accessibility, Sen. Patty Murray (D-WA) and Rep. Bobby Scott (D-VA) introduced, in September 2017, the Child Care for Working Families Act.88 The bill establishes wage standards for the child care industry to ensure that people who work in child care do not have to sacrifice their own basic needs to care for our country’s children. The legislation sets a floor of self-sufficiency for wages, meaning that no early educator can earn less than the amount needed to cover basic living standards such as food, housing, and health care. Moreover, the legislation calls for compensation parity between early educators and elementary school teachers for similar levels of education and experience.
Given that early educators work with children during a critically important time in their development—during which children are meeting important socio-emotional, physical, and cognitive milestones—people in the early childhood field need to have the knowledge, skills, and dedication to successfully facilitate early learning. Our paid training proposal can provide an on-ramp for those wishing to become early educators who have not had the opportunity to pursue higher education to gain the basic credentials and skills to begin their careers in this area.
However, recognizing the importance of the first few years of life, federal and state early childhood programs increasingly require early educators to have at least a bachelor’s degree in early childhood development or a related field. For example, in 2007, Congress passed legislation that requires at least half of Head Start classroom teachers nationwide to attain a B.A. within six years. Many of these teachers have pursued such a degree while continuing to work in the classroom, and by 2014, two-thirds of Head Start lead teachers had a bachelor’s degree or higher.89 Similarly, many state preschool programs require teachers to attain a bachelor’s degree.90
At the same time, just 18 percent of home-based child care providers and 26 percent of center-based providers currently have a four-year college degree.91 It is critical that the current early childhood workforce and those just entering the field have pathways to move up a career ladder by attaining credentials or degrees with timelines that recognize that most early educators are nontraditional students who are also working full time. Supports such as paid release time, substitutes, and financial help with tuition, books, child care, and transportation are necessary to ensure that the early childhood sector is open to all people who have the drive to work with young children.
The Child Care for Working Families Act supports this approach by requiring states to establish career and wage ladders to provide a clear path for educators to build upon their training and education. Furthermore, it supports current educators in moving up those ladders by establishing professional development systems and scholarships for educators.
The self-sufficiency wage floor coupled with parity requirements between early educators and K-12 teachers will increase the average wage for early educators to nearly $16 per hour.92 States must create wage boards that will establish industry-wide wage standards to consider training, education, and the cost of living in a geographic area. Notably, wage standards must be embedded in quality rating systems, which articulate progressively higher standards for child care programs—recognizing that child care quality includes and depends upon fair compensation for early childhood educators. In addition to improving compensation across the board, wage standards will help reduce inequities in the child care sector; currently, African American women in child care, for example, earn 82 cents for every dollar that white women earn.93
States will continue to administer child care assistance under the Child Care for Working Families Act, with funding allocated based on the number of eligible children in each state. In order to be eligible, children must live with families earning up to 150 percent of their state’s median income and have parents who are working or in school. Parents will select a child care provider and the child care subsidy will be paid directly to providers, expanding the need and demand for early educators. States will also administer quality rating systems, wage boards, and professional development systems to ensure access to high-quality child care with well-compensated educators.
In the community infrastructure section, below, we also invest in the construction of quality child care facilities.
CAP estimates that the Child Care for Working Families Act will create 700,000 early childhood sector jobs, including 350,000 center-based jobs and 350,000 jobs in child care homes.94 In addition, compensation for the existing early childhood workforce will increase by approximately 26 percent.95 The Child Care for Working Families Act will also boost employment among parents. An estimated 1.6 million parents—mostly mothers with young children—would enter the paid labor force with expanded access to high-quality, affordable child care. 96 The total cost of the Child Care for Working Families Act is an estimated $60 billion per year.97
Child care facilities
Ensuring access to quality, affordable child care for all will depend also upon investing in high-quality physical facilities. In many low-income neighborhoods and rural areas, a lack of safe and developmentally appropriate facilities is an impediment to high-quality early childhood service delivery.
CAP proposes the federal government invest $2 billion per year as a down payment to improve early childhood facilities, including child care centers, family child care homes, and Head Start programs.
This will bring 110,000 child care centers up to professional standards, including addressing basic health and safety issues linked to the physical environment, repairing structural issues, upgrading utilities such as plumbing and electricity, and ensuring that classrooms have appropriately designed restrooms for use by children. With the National Head Start Association estimating that Head Start programs need at least $4 billion to renovate and repair their facilities, this investment should serve as a down payment to the larger increase in funding that is ultimately needed to support the needs of all child care facilities across the United States.
Resources should also be distributed to states and communities to increase the number of licensed family child care homes by helping providers meet licensing requirements and building state capacity to license additional providers. Family child care is especially important in rural areas, where child care centers are less common.
Funds to upgrade child care centers would flow through intermediary organizations designated as Community Development Financial Institutions by the U.S. Treasury. These entities can leverage federal resources to raise private and philanthropic funds to provide additional support for facilities improvement.
This investment would create approximately 17,000 jobs annually.
Nationwide investment 2: Build 21st century transportation and water infrastructure
Infrastructure is the foundation that supports a competitive, prosperous, and equitable society. Smart investments ensure that everyone lives in a healthy community with access to opportunity and essential services. Unfortunately, the United States faces a tremendous infrastructure backlog that acts as a drag on the economy. The American Society of Civil Engineers estimates that there is a $2 trillion shortfall between overall infrastructure need across sectors and projected expenditures by all levels of government over the next 10 years.98
In fast-growing regions, inadequate transportation infrastructure and a lack of affordable, safe mobility options creates intense congestion that raises household and business costs while reducing national competitiveness. At the other end of the spectrum, many distressed communities face persistent economic hardship and crumbling infrastructure that make it difficult to create economic growth, reduce unemployment, and build long-term regional prosperity. America’s infrastructure faces additional stressors from climate change, including sea level rise, flooding, wildfire, and extreme heat.99
In short, the lack of a well-crafted and robust federal infrastructure program harms every community and business. As a result, millions of Americans drink unsafe water and drive over broken roads, to name only a few challenges. At the same time, congested and deteriorating facilities raise production costs for businesses and create barriers to markets.
Under the Jobs Blueprint, the federal government should make a down payment in closing our infrastructure backlog, investing $42 billion per year over the next decade on the infrastructure facilities described below—roads, bridges, rails, and water facilities—above baseline. Overall, this level of investment would create 350,000 jobs, directly and indirectly, for the life of the program.100 This does not foreclose other infrastructure spending that CAP recommends, including spending necessary to close the remaining backlog across other areas, such as in airports and seaports. Indeed, in the following two sections, we also recommend infrastructure investments to modernize K-12 schools and ensure climate resilience. The Jobs Blueprint represents an important contribution to CAP’s overall proposal to invest at least $100 billion per year, or $1 trillion over 10 years, in our nation’s physical infrastructure.101
To start, it should enable us to make the following two big promises to the American people: a 21st century transportation system and access to safe, clean water.
21st century transportation system
The United States has one of the most productive and extensive surface transportation systems in the world with more than 2,100 public transit operators102 and 4.2 million miles of public roads.103 Each year, transit operators provide 10.8 billion trips104 while the roadway network support 3.2 trillion miles of driving.105 Yet, rising roadway congestion, deteriorating highways, and aging transit fleets reduce productivity and increase the cost to households and businesses.106
According to the U.S. Department of Transportation (USDOT), 64 percent of federal-aid highway miles have pavement in fair or poor condition.107 Moreover, there are 54,560 structurally deficient bridges—approximately 9 percent of bridges in the United States.108 According to research by Texas A&M University, travel delays due to traffic congestion caused drivers to spend nearly 7 billion extra hours driving, or roughly 42 hours per rush-hour commuter annually.109
Additionally, USDOT estimates that transit operators face a repair and replacement backlog of $86 billion.110 This figure includes elements such as buses, streetcars, vans, and subway cars as well as stations, power systems, communications equipment, maintenance yards, and tracks, among other facilities.
Under this Blueprint, the Federal government would spend $36.5 billion annually above baseline for 10 years to repair aging facilities, reduce congestion, and increase transportation choice. New infrastructure should be resilient to the likely impacts of climate change. Federal funds would flow through the following existing programs: $29.3 billion for the Highway Trust Fund; $1.7 billion for New Starts; $500 million for TIGER; and $5 billion for passenger rail split between the Intercity Passenger Rail Service Corridor Capital Assistance and the High-Speed Rail Corridor Development programs. Fifteen percent of highway funds would be set aside for bridge repair, rehabilitation, and replacement.111
Access to safe, clean water
The average person uses between 80 and 100 gallons of water each day when they wash clothes, take a shower, cook, and flush the toilet.112 In total, businesses and households use more than 42 billion gallons of water every day.113 While drinking water is something most people take for granted, collecting, treating, and distributing safe drinking water requires massive amounts of infrastructure and technically sophisticated management.
The Environmental Protection Agency (EPA) estimates that public drinking water utilities face $384 billion in capital needs over the next 20 years.114 These costs include four major elements: acquisition/source, treatment, distribution, and storage. Of these four, distribution accounts for the largest share of the total need.115 The federal government estimates that there are 880,000 miles of water distribution pipes.116 Many of these pipes have come to the end of their useful life and need to be replaced.
In addition to the needs of public water systems, many homes and apartment buildings have lead service lines that connect to the public distribution system. These lines have the potential to become a major source of lead contamination as demonstrated by the ongoing public health crisis in Flint, Michigan. Research by the American Water Works Association (AWWA) reveals that there are approximately 6.1 million lead service lines in need of replacement, affecting approximately 7 percent of homes.117 While the cost of replacing a lead service line varies depending on the size of the lot, where the line enters the house, and labor and materials costs for a given community, AWWA estimates the typical cost is around $5,000 per service line.118 Based on this estimate, the total cost to replace all lead service lines would be more than $30 billion.119
The other half of water infrastructure needs relates to wastewater treatment from residential and commercial water use as well as the pollution that rainwater picks up as it flows over agricultural and urban land. As rainwater passes over developed land, it accumulates sediment, microbial pathogens, and chemicals, among other pollutants. The EPA estimates that more than 246,000 miles of rivers and streams within the United States are polluted to a point that they cannot support their intended use, such as fishing and swimming.120
The challenges facing municipal wastewater treatment works are immense. According to the EPA, municipal treatment works will require $271 billion in capital investments to meet Clean Water Act standards over the next 20 years.121 The Blueprint proposes the federal government spend $5.5 billion annually over 10 years to improve water quality and ensure that everyone has access to safe drinking water.
Federal funds would flow through existing programs. Specifically, federal capitalization grants for the Drinking Water State Revolving Fund (DWSRF) and the Clean Water State Revolving Fund (CWSRF) would each increase by $1 billion a year. These capitalization grants would support existing eligible drinking and clean water projects. Additionally, funding for the Public Water System Supervision program would increase by $150 million while funding of the Nonpoint Source Management Program would increase by $350 million.
Finally, to eliminate the threat posed by lead service lines, the federal government would provide $3 billion a year through the DWSRF program. States would distribute these funds as grants to local public water agencies based on survey results of lead service line needs. Water authorities would use these funds to cover the full cost of lead service line replacement for homeowners below 150 percent of area median income (AMI). For homeowners between 150 and 250 percent of AMI, water authorities would use federal funds to cover half the cost of replacement and provide a zero-interest loan for the balance that would be repaid over a 20-year period through a monthly water surcharge. Homeowners above 250 percent of AMI would be eligible for a zero-interest loan for the full cost of replacement.
Nationwide investment 3: Rebuild K-12 schools
About half of America’s public schools do not provide students a clean, safe, comfortable, and healthy learning environment.122 This means that far too many attend schools in moderate to extensive state of disrepair, affecting the quality of air, water, and other environmental factors.
While this is a national problem, the disrepair of America’s public schools disproportionately affects students in low-income communities that cannot raise funds for maintenance, repair, or modernization. According to a recent estimate by the 21st Century Schools Fund, school districts around the nation underinvest in capital construction and maintenance and operations by $46 billion a year.123
Research finds a clear relationship between school building quality and student achievement.124 For instance, studies show a link between poor air quality and student absenteeism as well as impaired cognitive functioning and poor health.125
Under the Blueprint, the federal government would spend $46 billion per year over 10 years on a national school infrastructure program that will repair, modernize, and expand school facilities and collect data on the condition of school facilities. These expenditures would create, directly and indirectly, 380,000 jobs each year.
Federal funds would be granted to states—including the District of Columbia and Puerto Rico—based on student enrollment and poverty levels, with 0.5 percent of total funds reserved for outlying territories and 0.5 percent reserved for the Bureau of Indian Education. Funds to states, and then districts, would prioritize allocations according to three factors: poverty rates, student enrollment, and building conditions, the latter of which is informed by a needs assessment. Funds support public schools, including public charter schools.
Federal assistance would support the following: 1) repair, rehabilitate, and modernize existing facilities, including building systems that manage drinking and wastewater, air quality, heating and cooling, and lighting, especially if such systems help to reduce costs and make buildings environmentally sustainable; 2) purchase broadband internet access and wireless networking in schools as well as outfitting computer labs; 3) support expansion and new construction to meet student enrollment growth; 4) support repayment of outstanding municipal bond debt issued within the previous 10 years in support of eligible capital costs, up to a federal limit.
Districts must provide the state with a plan for operations and maintenance, including the training of facility maintenance staff, as modernized buildings will likely be run by computerized systems that require specific technical knowledge to operate effectively.
Nationwide investment 4: Prepare homes and communities for a more affordable, resilient future by building a Future-Ready Communities Corps
Communities across the United States have directly experienced the consequences of the changing climate, from natural disasters such as severe flooding or wildfires, to hotter summers that lead to higher air conditioning bills.126 Low-income areas, communities of color, and indigenous communities typically have fewer defenses against natural disasters, including unsound or inefficient housing and fewer financial resources, because they are often located in flood-prone areas and are already overburdened by the legacies of historic inequities, pollution, and disinvestment.127 Extreme weather often affects the infrastructure these communities share, such as roads or water and sewer systems, as well as the houses and residential buildings they inhabit. The combination of inefficient housing, high energy costs, and related financial constraints makes it harder for struggling families to recover and rebuild in the wake of disaster, potentially leading to financial crisis.
American families and communities deserve to be prepared for the future, whether facing high energy bills that constrain household finances or the risk of natural disasters. To better prepare them, the Jobs Blueprint proposes a Future-Ready Communities Corps to:
- Upgrade homes for energy efficiency, livability, and extreme weather- and solar-readiness
- Make homes and community-wide infrastructure resilient to sea-level rise, flooding, wildfires, and more intense extreme weather events, such as heat waves, hurricanes, and severe storms
With an investment of $24 billion each year over 10 years, the Future-Ready Communities Corps could save households approximately $7 billion a year, combined, on their energy bills annually; avoid $60 billion each year in costs related to disaster damages; and employ 290,000 people retrofitting more than 2 million homes each year, making communities more resilient to extreme weather events, which will become more frequent and severe as the climate continues to warm.128
Energy burden diminishes public health, safety, and the ability of families to succeed
A household’s annual electricity, natural gas, and other home heating costs are subject to fluctuations in energy prices and can strain the budgets of lower-income households, forcing trade-offs between paying utility bills and other monthly costs.129 Rising temperatures and more frequent and intense heat waves put low-income families with energy inefficient housing, who are already facing a heavy energy burden, at high risk of heat-related illnesses.130 For example, during a 1995 Chicago heat wave, 739 people died, mainly in neighborhoods composed of families living paycheck to paycheck.131
At the same time, community reliance on electric distribution lines—the source of most blackouts and grid reliability problems—can increase challenges when service becomes interrupted, especially during severe weather events.132 Increasingly, homes have installed distributed energy resources such as solar photovoltaic (PV) panels and home batteries to help defray monthly energy bills or cover gaps in service from grid-related blackouts.133 For some structures, combining solar installations with weatherization may maximize energy bill savings for families.134
The legacy of community disinvestment in some neighborhoods has meant that housing and buildings require extensive rehabilitation and upgrading in order to be ready for energy efficiency or renewable energy technology installations.135 Poor structural and roof conditions of property create barriers for many community residents to participate in the benefits of a clean energy economy.136 Thus, some families may require more comprehensive rebuilding to bring their homes up to health, structural, and energy standards.137
The federal government can help reduce the energy burdens facing families by hiring workers to improve household energy efficiency, make homes and buildings solar-ready, and, where needed, rebuild structures to appropriate health and structural standards so that they are ready for clean energy technology installations.
Extreme weather can devastate communities
As Hurricanes Harvey, Irma, and Maria laid bare, more frequent and intense extreme weather events fueled by climate change pose vast financial risks to federal, tribal, state, and city governments as well as businesses and households.138 Moreover, the diversity of extreme weather and other natural disasters facing communities amplifies the need for assistance in planning and preparation that matches local contexts and is shaped with community input. Involving communities directly in preparing their shared infrastructure for natural disasters can combine local and regional knowledge with employment efforts.
Disasters can destabilize everything from city transportation and services to the safety of buildings, housing, and infrastructure. In the wake of Superstorm Sandy, roughly 30 percent of the small businesses hit by the storm permanently closed.139 Many struggling households face added financial insecurity in the wake of a storm as they cope with lost wages, damaged property, or medical bills and may never fully recover from a disaster. Persons with disabilities are hit particularly hard by natural disasters, and the disability population typically increases following a natural disaster as well.140 In the worst economic cases, families are pushed deeper into poverty or even become homeless in a disaster’s aftermath.141 Even when extreme weather events do not trigger disaster declarations, they can create costly, dangerous, and even deadly emergencies in communities struggling to make ends meet.142
The federal government can help to reduce these risks by hiring workers to help families and communities prepare their buildings and infrastructure for extreme weather events and other natural disasters.
Design of the investment
The Future-Ready Communities Corps would provide two key services: making homes energy-efficient and solar-ready and preparing communities for extreme weather. The Future-Ready Communities Corps would work with state and local governments to determine where to deploy workers and for what projects. Some communities may be in greater need of energy-efficiency upgrades, whereas others may need more investment in flood control projects. The Future-Ready Communities Corps would deploy workers with the necessary skills to meet those needs.
Energy-efficient and solar-ready homes
Upgrading homes and buildings for energy efficiency and solar creates construction jobs. The Future-Ready Communities Corps would train and employ workers who would assess and upgrade homes and residential buildings for energy efficiency and solar-readiness. These projects would need workers with skills in electrical wiring, roofing, general carpentry, and residential construction.
The corps would identify the housing stock most in need of upgrades using annual household energy burden data and weatherization guidance from the U.S. Department of Energy.143 Additional resources from programs such as the U.S. Department of Housing and Urban Development’s (HUD) HOME Investment Partnerships or Community Development Block Grants or the U.S. Department of Agriculture’s Rural Housing Service may assist or provide guidance in cases where housing units need more comprehensive reconstruction or replacement.144 Households receiving Supplemental Security Income (SSI) or living below 200 percent of the federal poverty level in relation to family size qualify for the Future-Ready Community Corps residential building upgrades.145 The Department of Energy Weatherization Assistance Program has a long track record of aiding families in need of energy efficiency and other upgrades that increase the comfort and affordability of their homes, ranging from insulation to more efficient heating and air conditioning systems.146 In addition to these efficiency upgrades, workers could make houses ready for solar installations by adding the necessary structural supports and wiring for rooftop solar in the appropriate locations or replace the roof when needed for solar-readiness.147
More resilient communities
To make households and communities more resilient to climate change and more intense extreme weather, the Future-Ready Communities Corps could perform a variety of services, depending on the needs of those communities. The corps could elevate or relocate homes that are situated in flood plains or upgrade and stormproof schools, hospitals, police and fire stations, and other community infrastructure. They could improve a county’s emergency response and communications systems. To lower heat and flood risks, workers could plant trees for shade, build or expand parks to help absorb storm water, or construct community centers that double as cooling centers in the summer. Similarly, along rivers or coastlines, workers could restore wetlands to help reduce erosion and protect against flooding and storm surges. The corps could also take steps to ensure communities’ disaster preparedness does not leave behind community members with disabilities.
The Future-Ready Communities Corps would need workers with a range of skills for these projects. Construction equipment operators and laborers, carpenters, and electricians would be needed to help storm proof homes, for example. Workers skilled in landscaping and ecosystem services would be needed to restore natural barriers to extreme weather.
Federal and state governments should work together to establish common criteria for distributing funds for resilience projects. Important criteria could include proximity to flood plains or low-lying coastal areas; poverty rates; and historical trends, such as cumulative pollution burdens that could make floods even more dangerous for public health. The EPA has developed a “climate resilience screening index” for every U.S. county based on several factors, including the risk an event will lead to loss of life and property; governance, including whether households and government agencies are prepared for an event; societal factors, including demographics, socio-economics, and access to health care; and the quality of the built environment.148 This index could provide a useful tool for assessing where to prioritize resilience spending.
Nationwide investment 5: Providing long-term services and supports so that more older Americans and people with disabilities can thrive in their communities
In the next 30 years, the United States will undergo substantial demographic shifts that require policymakers and practitioners alike to rethink the delivery and adequacy of long-term services and supports. As Baby Boomers age into retirement, the number of adults older than age 65 is projected to nearly double by the year 2050, while the number of those older than age 85 will more than triple.149 Seventy percent of seniors age 65 or older will need long-term services and supports. 150 One in 5 Americans lives with disabilities, many of who need long-term services and supports in order to live independently and work. 151
But, today, access to long-term services and supports—which are critical to the health and independence of seniors and people with disabilities as well as to their economic security and that of their loved ones—is all too limited in the United States. Private long-term care insurance generally offers only limited benefits and is prohibitively expensive for most individuals,152 while Medicaid eligibility requirements restrict enrollment to only those individuals who become impoverished, leaving others at risk of unmet service needs. People who need care are often unable to foot the bill for a home health aide. For example, a year of work from such an aide can cost nearly $46,000.153 The supply of workers to provide long-term services and supports is thus woefully inadequate. While family members and other informal caregivers help to meet some of the need by providing unpaid long-term supports and services for their loved ones, there is vast unmet need for paid services that are necessary to both supplement this unpaid care and provide the range of services that adults may need in order to thrive in their communities.
As a result, far too many seniors and people with disabilities struggle without needed services and supports. Indeed, today, more than 650,000 people with disabilities who already qualify for Medicaid remain on waitlists to receive critical home- and community-based support services.154 And just about 30 percent of noninstitutionalized seniors who require long-term services and supports receive paid care; the rest rely on family caregivers.155 This lack of paid home- and community-based services can be disastrous for seniors, pushing them out of their homes despite the fact that 90 percent of them prefer to age in place.156 It can especially compromise the independence of people with disabilities, many of whom can live independently and maintain or return to gainful employment with the assistance of a home health aide or personal care aide, for example, but cannot afford these supports.
The inability of most families to afford the out-of-pocket costs of long-term services and supports, coupled with insufficient investment in this sector, has resulted in a clear market failure. As a result, jobs in this sector suffer from stubbornly low wages, minimal career development, and a negative societal perception. These and other care jobs have been chronically undervalued in no small part because they are disproportionately filled by women of color—many of whom are immigrants157—whose work has long been dramatically unappreciated.158 It comes as no surprise, then, that these jobs—particularly when they are not part of a unionized workforce—are of notoriously low quality.159 The positions are often isolated, with few opportunities for training and peer interactions; on-the-job injuries are not uncommon; there are routinely too few opportunities for advancement to go around; wages are persistently low (home health aides, for example, earn a median $11 per hour, while personal care aides have median wages of less than $10 per hour);160 and benefits are virtually nonexistent.161
Not only have long-term supports and services workers struggled in these positions; family members and other informal caregivers have had to step in to provide needed support for their loved ones. Unpaid caregivers (also disproportionately women) contribute hundreds of billions of dollars in unpaid care work to the economy ($470 billion in 2013), while their own economic security suffers.162 A 2016 report by AARP found that more than half—56 percent—of informal caregivers to disabled adults and seniors who are otherwise employed have to work fewer hours, take time off without pay, or face other forms of work-related strain as a result of their care-related activities.163 People with disabilities who are employed often have to leave their jobs as a result of being unable to maintain consistent quality of life due to a lack of needed services and supports. Interruptions in the workforce can lead to immediate financial stress—both for individuals who must leave the workforce due to lack of needed services as well as those who have to reduce their hours or exit the workforce to provide long-term services and supports for a loved one.164 The toll is not just economic—both individuals who need supports to work and live in their communities and end up needlessly institutionalized in their absence and family caregivers are especially susceptible to depression and physical health issues.165
Workers, seniors, people with disabilities, and their families all need policymakers to invest in high-quality services and supports that will in turn create high-quality jobs for the people providing those important services. Making a serious commitment to start addressing this unmet need will not only benefit the nation’s seniors and people with disabilities—for whom needed services and supports will finally be within reach—it will also enhance the economic security of family caregivers who often struggle to pay for services and supports in the absence of sufficient support. And, critically, increased investment into these jobs will be of tremendous benefit to the individuals who fill them and will provide opportunities for workers who have been historically locked out of high-quality jobs.166
Investing in the long-term services and supports workforce
The plan involves two investments in long-term services and supports designed to create new jobs to meet demand for these services and supports and professionalize these jobs. These changes will, in turn, improve the quality of the long-term services and supports provided to disabled and elderly individuals, especially in home- and community-based settings while ensuring that clients do not lose services as wages rise. Given the elevated rates of disability in distressed communities, these jobs will disproportionately help distressed communities, improving the economy and the health outcomes of their residents.167
First, 1 million home health aide and personal care aide jobs will be created. CAP’s forthcoming proposal for a national system of long-term services and supports, building on CAP’s recent Medicare Extra for All proposal that would guarantee universal health coverage in the United States, will provide more detail on the creation of long-term services and supports jobs.168
Second, the federal government will work with those in the direct-care workforce and other health care industry stakeholders to identify growth opportunities and career lattices for those in this profession. It will also develop basic and advanced training programs that will give direct care workers the skills necessary to expand their role along these pathways. For example, following the passage of a 2011 ballot initiative, Washington state has required home care workers to complete 75 hours of basic training and pass a state certification exam. The SEIU HealthCare NW Training Partnership, a labor-management partnership, provides training that consists of core skills training, cultural competency, applied learning for specialty treatment, professionalism, and skills to facilitate stronger communication with the care team. Approximately 45,000 home care workers across the state are served annually. Additionally, in 2012, the Training Partnership launched an Advanced Home Care Aide Apprenticeship Program, which provides additional training to home care workers while increasing their wages.169
The purpose of this investment is to provide workers with more specialized skills that will enable them to become an essential part of their clients’ care teams. Their role will be to facilitate communication between their clients’ doctors and other health care professionals and provide updates on their clients’ health status and flag issues that may need additional assessments. The home health aide or personal care attendant would also be able to connect their clients with other social service organizations, such as Meals on Wheels or transportation services. Expanding the role of these workers to more closely interact with the client’s health and social service providers will improve the quality of services provided to the individual. In addition, the proposal will ensure that people do not lose services as wages rise, as the new investment dollars are designed to support higher quality of services for more seniors and people with disabilities as well as support better jobs for workers.
This investment is an essential down payment in addressing the unmet need for long-term services and supports that benefits workers, seniors and people with disabilities, and their families by creating 1 million high quality jobs. These workers will provide much-needed support services so that older people and people with disabilities can thrive in their communities and their families can afford to care for their loved ones without sacrificing their own economic security. The total cost of this investment will be $44 billion annually, which will cover the costs of 1 million jobs that pay $15 per hour and provide essential benefits.170
Economic impact
The five nationwide investments described above should directly employ about 2.7 million people at an annual cost of $218 billion. In addition, we would expect an induced (multiplier) increase in GDP that would result from the increased expenditures. We estimate this to be on the order of $90 billion, assuming an expenditure multiplier of 1.4.171 The induced effect on employment would, in turn, create an estimated 350,000 additional jobs.172 All together, we estimate that the five investments would raise employment by about 3.1 million jobs. The increased demand for labor should serve to raise wages as labor market slack is reduced.
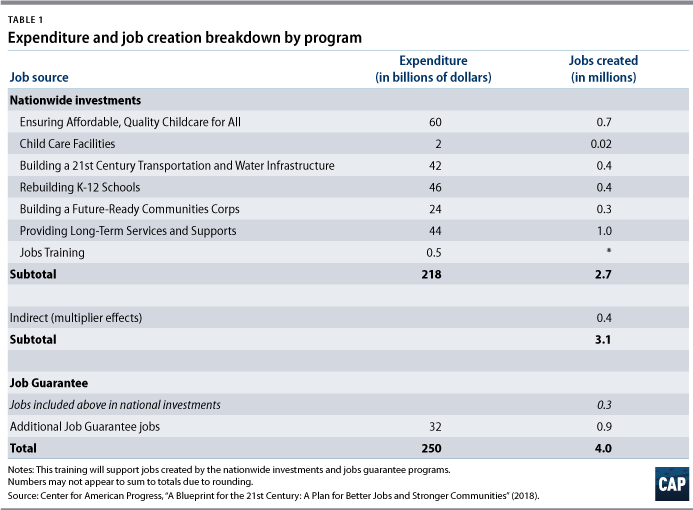
And, just as critically, these nationwide investments will have a tangible and immediate impact on the well-being of families and communities. Low- and middle-income families will not pay more than 7 percent of their income toward child care, bringing more people into the workforce and improving families’ ability to pay other bills. Millions of people will see shorter commutes and safer roads and bridges. Children will experience improved educational outcomes from higher-quality early education and safer, more modern schools. Communities that had been suffering from lead poisoning or contaminated water will see improved health and educational outcomes. Millions of households will collectively save approximately $7 billion on their energy bills, and families and communities will avoid $60 billion a year in costs related to disaster damages. Hundreds of thousands of seniors and people with disabilities, many of whom are on waitlists for community-based services and supports, will receive the services they need to live independently and fully participate in their communities. They, and their families, will have greater financial security and more stable employment prospects.
The annual expenditures for these investments, and for the job guarantee described below, are well within the fiscal capacity of the United States. As discussed later in this report, they are comparable in size to the cost of the 2017 tax legislation for this coming fiscal year, which conferred substantial benefits on upper-income households and corporations but did little for working-class families.173
Taken together, these nationwide investments create enough jobs to move us substantially toward full employment while meeting pressing needs in communities.
Job guarantee for distressed communities
Every community in the United States has critical work in need of doing, and people eager to engage in that work. For that reason, the nationwide investments that the Jobs Blueprint proposes will be felt in communities across America. These investments will improve standards of living and productivity; boost local families’ employment opportunities and economic security; and offer a pathway to upward mobility for Americans that is too often absent in today’s labor market.
However, certain communities have been left especially far behind in today’s economy. These include those that have fallen behind in recent years due to increasing automation, offshoring, or market concentration as well as areas that have experienced a persistent poverty or lack of opportunities for decades.
CAP believes that a federal job guarantee would help these communities overcome their challenges by delivering an additional boost of investment and employment opportunity over and beyond the nationwide investments. Accordingly, under the Jobs Blueprint, in the hardest-hit counties comprising 10 percent of the U.S. population, CAP proposes that long-term residents be offered a job in their local labor market, defined as their commuting zone.174 These jobs may be either private jobs supported by the public sector or in the public sector itself.
Many of the workers in qualifying communities may be able to find a job through one of the nationwide investment initiatives. Others could choose to enter the newly created paid training program set out under this Jobs Blueprint, as a way to take up on their guaranteed slot before seeking a nationwide investment job, another public job, or a private-sector job. And for workers who were not matched to a nationwide investment job or paid training, a job opportunity would be made available by the local administering body.
The idea of a job guarantee has risen to prominence in the national policy agenda and been extensively explored thanks to years of work by several researchers, including William Darity, Darrick Hamilton, Mark Paul, and Pavlina Tcherneva.175 Darity, Hamilton, and Paul’s most recent proposal calls for the provision of public jobs at nonpoverty wages for anyone older than age 18 who wants one.176 Tcherneva and her colleagues propose creating voluntary public employment opportunities with federally funded but decentralized administration to provide living-wage jobs to all who want them.177 Josh Bivens of the Economic Policy Institute recently advocated that the government offer “employer of last resort” jobs as a complement to a much wider program of national aggregate demand management, strategic allocation of public investment, and improvements in job quality and economic security.178 The work of these researchers over the past several years has helped bring the idea of a job guarantee to the forefront of the national conversation.
The differences between these proposals and the ones advanced here turn principally on issues of program scale, targeting mechanisms, and the relationship of a job guarantee to jobs created through broader public investments initiatives. However, the job guarantee and related proposals share the overarching goals of establishing full employment by offering meaningful work opportunities and supporting significantly better wages and job quality. To that end, CAP recommends funding be provided for program evaluation so that, as eligible communities implement the guarantee, lessons learned and best practices can be incorporated.
Identifying highly distressed communities
There are many ways to measure the economic and labor market distress within a geographical region. We have constructed a simple index—based on measures of employment, wages, and poverty—because we are interested in providing jobs at decent wages to people who most need them. Of course, there are other ways to construct such an index, and we regard the one used here as reasonable but subject to further refinement and improvement.
The index we use is a weighted average of three variables: nonemployment among adult workers between the ages of 25 and 64 without a four-year college degree; real median earnings (adjusted for regional price discrepancies); and the poverty rate.179 We calculate each county’s score on this index based on recent data. After ranking counties by their score, the lowest-scoring counties containing 10 percent of the U.S. population are designated as distressed.
When generating the index and identifying highly distressed communities (HDCs), we rely on county-level data because of their relative reliability and because of existing administrative capacity in such regions. When applied, the index identifies 676 highly distressed counties out of the roughly 3,142 U.S counties and county-equivalents across the country. Highly distressed counties are both rural and urban, with both large and small populations.
Fifty percent of the population that lives in highly distressed counties overall reside in the largest 38 of the 676 HDC counties, including communities widely known to have pockets of considerable economic challenges, such as Philadelphia, Bronx County, New York, and Baltimore City on the East Coast; Wayne County and St. Louis City in the Midwest; Fresno and Kern counties in California; and a variety of counties in the Southwest, Texas, and the Gulf Coast. Many lesser known and rural areas also face economic challenges, such as Pike County, Alabama; Coconino County, Arizona; Decatur County, Iowa; Douglas County, Oregon; and Lincoln County, West Virginia. Just over half the counties have populations of 20,000 or less. While there is economic distress in nearly every region of the country—with 42 states containing at least one distressed county—some of the greatest challenges are concentrated in Appalachia, the rural South, and Native American tribal lands in the West.180
However, because counties can simultaneously contain pockets of distress alongside areas of prosperity, our county-level measure of distress may not identify particular subregions where a job guarantee program should operate, such as in counties that experience high degrees of segregation and spatial inequality.
Additional steps that could be taken into account for these areas include exploring the use of an index based on finer geographic units or setting aside funds to pay for guarantees in communities that are not themselves distressed counties but within which employment, wage, and poverty measures indicate a degree of distress comparable to those in distressed counties.181 For example, a city, or areas within it, could be identified even though the county in which it resides does not register on our index as distressed. This would include pockets of distress in some major urban areas that have been highly distressed for decades as a result of factors such as structural racism and segregation but are not captured by our index, making them particularly appealing for a job guarantee intervention. These and other options are worth further examination.
The shaded areas of Figure 10 show the counties designated as distressed under our approach.
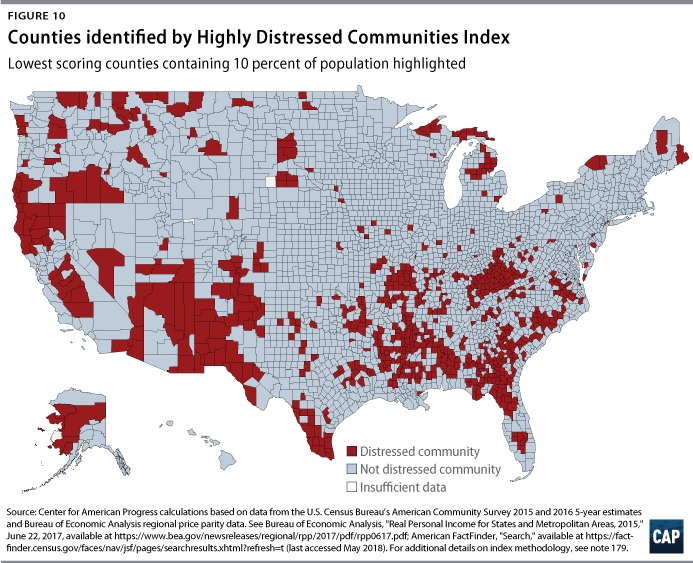
Characteristics of distressed counties
As Table 2 below shows, highly distressed communities have much smaller populations, on average, than nonhighly distressed communities. People of color are disproportionately represented among their residents. Distressed counties are more likely to be located in rural areas; contain a large share of very low-income communities; and be “persistent poverty counties” as defined by the U.S. Department of Agriculture.182 In recent years, these counties have experienced much slower population growth; higher poverty; and lower employment rates, incomes, and life expectancy. Residents are slightly older, on average, and are substantially more likely to be disabled.
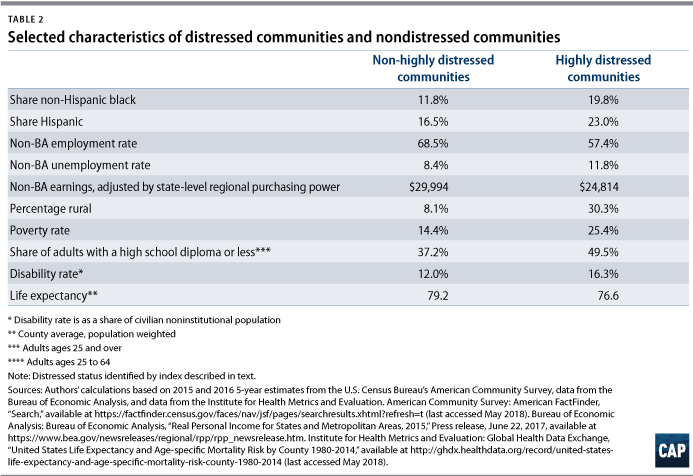
Estimated participation and cost
As with any bold, large-scale initiative with limited historical precedent in the U.S. context, takeup of the guaranteed job offer necessarily involves some degree of uncertainty. A number of factors contribute to uncertainty about takeup. These include nonworking individuals’ propensity to enter or re-enter the labor market if a guaranteed job were offered, which, in turn, depends heavily on reservation wages (the wage at which a worker would accept employment); workers’ preferences for a public or publicly supported job compared with other private-sector jobs; the effect of the nationwide investments, such as affordable child care on labor supply in the community; and the extent of any private-sector crowd out, which the public jobs and nationwide investments are designed to minimize.
However, we estimate the scale of guaranteed jobs by calculating the jobs required to bring the working-class employment rate (that is, the employment rate for those without a bachelor’s degree ages 25 to 64) in the highly distressed communities to a level above its previous peak in 2000.183 Since 2000, employment rates for working-age members of the working class have fallen much more than for working-age workers overall. Taking account of the benchmark working-class employment rates in highly distressed communities and nationwide in 2000 and in recent years, we estimate that approximately 1.2 million workers will take a job through the job guarantee program—approximately 300,000 of whom will be offered a job in one of the nationwide investment programs described above.184
To the extent possible, the workers in distressed communities who are eligible for the individual-level job guarantee will be directed to a nationwide investment job within a reasonable commute. Those who cannot obtain those nationwide investment initiative jobs will be employed in jobs determined by the administering body. We estimate that approximately 900,000 people would be employed in these noninvestment initiative jobs at an annual cost of about $32 billion.185
Administration of the job guarantee
The Job Guarantee will be administered by a range of local governmental bodies, including city, county, and tribal governments and, in some cases, may also include partnership and administration by community colleges, workforce investment boards, federal agency field offices, and even land-grant colleges and universities. A new federal agency—the Office of Community Employment (OCE), located within the U.S. Department of Labor—will establish overarching guidelines, facilitate engagement with all relevant stakeholders, including community-based organizations, ensure that jobs are distributed equitably within the community, and provide other ongoing oversight.
Distressed counties are the geographical unit eligible for the job guarantee, but in many areas, county governments are relatively small and, particularly in distressed areas, may have limited capacity to take on significant new responsibilities, such as administering a guaranteed jobs program. For this reason, administration of the guarantee may look different based on the specific county government. In more populous areas, the municipal government may take a leading role in consulting with its community and submitting to the OCE its plan for the guarantee. In any county that contains tribal lands, tribal nations as sovereign units can decide whether they would like to participate with the county or with their own plan. If the tribe chooses to participate in the county-wide plan, the tribal government will be a required partner to ensure the plan meets the unique needs of their population. Across all counties, workforce investment boards, community colleges, and federal field offices, such as U.S. Department of Agriculture and U.S. Department of Housing and Urban Development offices, are natural partners to consult on the local design and ensure it is consistent with relevant educational, employment, and other local needs.
Our proposal also includes implementation grants to local governments to help with both the rollout of the guarantee as well as ongoing technical assistance and course correction in real time. For example, if a jurisdiction wants to do a survey or hold a town hall meeting to get community input into the proposal for the guarantee or if they need to hire additional county staff to liaise with required stakeholders, the implementation grants could be used to help offset the costs and build capacity.
Eligibility for job guarantee
In general, counties and the administrative units within them will be eligible for the job guarantee if they are designated as distressed, meaning they fall in the bottom 10 percent of counties according to an index that considers employment, earnings, and poverty. While many of the workers requesting a job in these communities would be hired to a nationwide investment job located within their commuting zone, others will have access to public or publicly supported jobs that meet a variety of community needs.
The OCE will be responsible for identifying communities that are eligible for the guarantee program; estimating the number of job guarantee positions needed in these communities to meet total demand; ensuring that local programs are high quality and create new jobs that match community need; and creating a website where workers can search for job openings.
Once a county is determined to be eligible, it will be required—in collaboration with the local workforce board and counties in the surrounding commuting zone—to submit and receive approval for a plan to fulfill the job guarantee requirements that would include:
- Specific projects or tasks that job guarantee recipients would perform; an explanation of how these projects help meet community needs; and details on whether a public entity or a contractor would be the employer of record for each project.
- A plan to ensure appropriate wraparound services for people facing barriers to work, either to prepare them for work or to support them in it. This would include support for caregiving expenses or access to caregiving services; substance abuse counseling; disability-related services and supports; applicants facing domestic abuse; and assistance with expungement or record-sealing for individuals with criminal records. If needed, communities would be able to request additional implementation funding to support these services.186
- An equity assessment plan to ensure that all individuals have an equal opportunity for employment in the publicly supported jobs in child care, long-term services and supports, and infrastructure-related work as well as to paid training slots without regard to race, color, religion, sex, sexual orientation, disability status, gender identity, or national origin. County plans should include an analysis of the existing population of dislocated and low-wage workers by demographic status and affirmative action goals; identify barriers to reaching these goals and actions to overcome these barriers, including outreach to underserved communities; and plans to address implicit bias in hiring and screening of applicants.
- A demonstration of maintenance of effort for existing government jobs, including public employees and existing contract workers to ensure against displacement.
- An assessment of community priorities informed by community input so that residents feel ownership over the investments made.
- A plan to comply with all relevant environmental laws, including federal, state, and local efforts to meet climate and conservation goals.
In addition, participating counties would be required to submit regular reports to the OCE evaluating successes, challenges, and lessons learned.
The federal government will commit to financing this job guarantee for all long-term residents of distressed counties for five years, enabling counties to plan for longer-term projects and leverage the guarantee to attract private investment and grow their tax base. Implementation grants will also be provided to the local administering unit to cover the cost of standing up and implementing the proposal over time, including program evaluation.
At the end of five years, the OCE will reassess which counties qualify as distressed. If participating communities are no longer eligible, the federal government will wind down funding in line with local economic conditions and project completion needs. The costs of extension funding could vary considerably due to macroeconomic factors, as contracting government hiring in any community during a recession would not support the employment policy goals of the Blueprint. Moreover, how much turnover among distressed communities would occur depends on the extent to which all communities would be improved by the job guarantee, but under reasonable assumptions about turnover, transition costs could amount to as little as a few pennies for each program dollar.
Work opportunities—not paperwork requirements
Some lawmakers have suggested instituting work requirements on public assistance programs such as Medicaid, nutrition assistance, and affordable housing, which function as harsh and unnecessary time limits on programs that help workers who cannot find steady work afford the basics. Taking away a person’s health care, food, or housing is not going to help them find a job any faster and will only add unnecessary, expensive, and burdensome red tape for both individuals and state and local governments.
Rather than further undermining people’s economic security when they are struggling, CAP’s Jobs Blueprint is instead premised on the idea that the focus should be on creating good jobs with fair wages and addressing the barriers that families face to finding and maintaining work, such as the lack of affordable, quality child care.
In the vast majority of cases, people will be significantly better off taking a job guarantee offer at $15 per hour by 2024 than turning to public assistance. So applying work requirements to programs such Medicaid, nutrition assistance, or affordable housing just creates expensive bureaucratic hurdles that will cause many people who are working to lose needed assistance while causing great hardship for people who cannot work due to work-limiting disabilities or caregiving responsibilities or who prefer to continue with a private-sector job search better aligned with their skills.
Scope of job guarantee projects
Eligible counties would propose projects to the OCE that fulfill an important public service and can, in most cases, be performed after on-the-job training without the need for an additional certification. Projects should respond to community needs but could, for example, include:
- Support services in schools and libraries
- Outreach and peer support to people struggling with substance misuse by trained and certified graduates of treatment programs
- Assistance for families in the aftermath of a local disaster or extreme weather event
- Cleanups to fight blight and support agriculture, the recreational economy, conservation, and the health of local communities
- Beautification and maintenance of local business districts
- Support for after-school or summer enrichment programs
- Delivery of meals to seniors and other homebound individuals
Counties would be prohibited from using federal funds to undertake the work of existing government employees or employees of existing government contractors. Moreover, no job guarantee positions could be used to engage in any political activity.
Job placement
Once a community plan is awarded, workers could find out about job opportunities through their local American Jobs Center (also known as Career One Stops) or via a national jobs database.187 The county would be responsible for ensuring that all job guarantee positions were listed in the federal jobs database.
Pay and benefits
Job guarantee positions will pay wages, at a minimum, consistent with proposals to raise the minimum wage to $15 by 2024 and index it to the median wage. However, federal prevailing wage and benefit protections will apply to these jobs in order to prevent displacement of existing higher-wage workers.188 For example, if a county wants to use job guarantee funds to design a park, any construction workers needed as well as a landscape architect would need to be paid at least the prevailing wage for the work. In addition, consistent with CAP proposals to enact Medicare Extra for All and provide comprehensive federal paid family and medical leave, the jobs would provide benefits such as health care, paid sick days, and comprehensive paid family and medical leave.189 These workers will also enjoy the same protections of their bargaining rights as workers on nationwide investment projects.
Finally, most positions will be full time. Communities could apply to create a limited number of part-time positions for workers with caregiving responsibilities or to allow workers to participate in training programs. However, communities would be required to ensure that part-time jobs were not awarded in a manner that reinforces occupational segregation, and the Department of Labor would have the authority to reject such proposals.
Subsidized nonprofit employment
Counties would be permitted to designate up to 20 percent of the funds for which they qualify for subsidized nonprofit employment with a goal of supporting local economic development and creating employment opportunities that may last beyond the duration of federal support. 190 In addition, this added labor capacity could help local nonprofits provide necessary wraparound support services.
Ensuring compliance
The federal government will conduct ongoing oversight to prevent discrimination, the displacement of existing government jobs, and undermining of existing labor and environmental standards. An enforcement office similar to the Office of Federal Contract Compliance Programs would be hosted at the Department of Labor to ensure that funding recipients are not discriminating based on race, ethnicity, national origin, gender, sexual orientation, gender identity, age, disability, or religion and to support proactive affirmative action planning. Funded projects would need to comply with existing federal and state environmental review processes.191
For people with criminal records, securing employment is a crucial first step to leading productive lives after they have served their sentence. But too many obstacles stand in their way, such as being denied an initial interview or eligibility for an occupational license based solely on their criminal record. Many of the restrictions are overbroad in their application. For example, in some states, criminal records disqualify a person from being a barber or contractor.192 In order to provide fair opportunities for people who have paid their debt to society, employers for these jobs would be asked to make individualized assessments of a person’s criminal history, including the specific circumstances of the crime, the time elapsed since the offense, the job’s requirements, and connection between the job and the criminal record.193
This office would be entirely independent from the OCE in order to avoid conflicts of interest. In addition, the government would provide additional funding to the Equal Employment Opportunity Commission to ensure due process for workers claiming discrimination by a government entity or private employer receiving funds. Finally, the Department of Labor’s Wage and Hour Division would enforce compliance with program wage and benefits standards.
Repeated violations would result in the federal government changing the local administrative unit—such as from the city or county to, for example, a local community college—or even directly administering the job guarantee programs itself.
Paid training
As the previous sections illustrates, workers with limited education or training beyond high school face a challenging economic environment. The demand for the labor of these workers has dropped significantly, making it increasingly difficult to obtain good jobs that pay decent wages. Those same forces, including automation, globalization, and other factors, have also caused an increasing number of jobs to require some postsecondary education or training. The Bureau of Labor Statistics, for example, predicts that from 2014 to 2024, jobs that require a credential beyond high school will outpace overall job growth.194 However, relatively few adults have that training today. While 91 percent of adults in 2017 had a high school diploma or higher, 48 percent reported having an associate degree or higher, and slightly more than one-third reported holding a bachelor’s degree or more.195
The importance of postsecondary education and training
Indeed, postsecondary education and training have increasingly become important to securing a good job. While a bachelor’s degree or higher provides the greatest return overall, other postsecondary credentials such as an associate degree, certificate, or on-the-job training like apprenticeships can help workers move into higher wage jobs. And the United States is equipped with the largest, most accessible postsecondary system in the world, with community colleges providing an opportunity for anyone with a high school diploma to learn new skills, including those necessary to fill the jobs our nationwide investments would create.
While postsecondary education and training are not the sole answers to raising workers’ wages, additional education is associated with higher earnings. In 2017, median wages for prime-age workers with an associate degree were $39,500, compared to $31,000 for people with a high school diploma. At $54,431, the median wage for individuals with a bachelor’s degree was 76 percent higher than individuals with a high school degree. (see Figure 11)
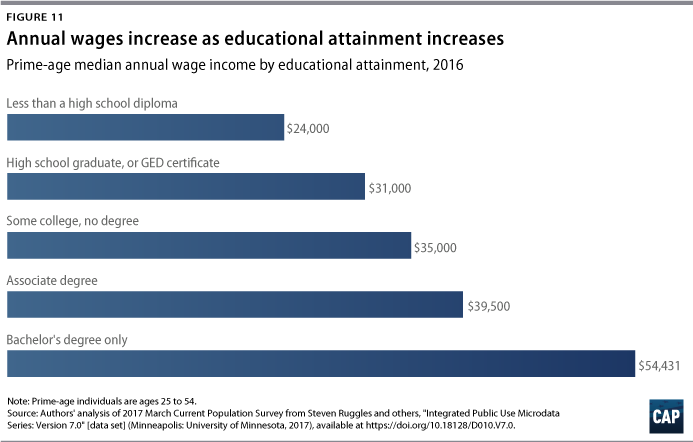
Educational attainment varies considerably by age, sex, race, country of origin, LGBTQ identity, and disability status. For example, in 2017, 26 percent of prime-age African Americans and 18 percent prime-age Hispanics had a bachelor’s degree or higher compared to 37 percent of the total prime-age population. Individuals with disabilities were also much less likely to have a postsecondary credential. When we compare the population age 25 and over without a disability to those with a disability, we find that a higher percentage of individuals without a disability hold a bachelor’s degree or higher (33.6 percent of all people without a disability) as compared to 15.7 percent of individuals with a disability. 196 Transgender adults are less likely to have attended college than cisgender adults: 36 percent of transgender adults have attended college compared to 57 percent of cisgender adults.197 Compared to straight women of the same age and race, bisexual women are 64 percent less likely to have graduated from high school and 48 percent less likely to have enrolled in college.198
Workers also tend to see a wage increase from postsecondary education across race and gender lines. Median wages for women with an associate degree or bachelor’s degree are 28 percent and 80 percent higher, respectively, than women just a high school diploma. African Americans see similar rates of return to associate and bachelor’s degrees. Hispanic workers see the lowest wage premium from associate and bachelor’s degrees—approximately 17 percent and 50 percent, respectively, compared to a high school diploma. 199 It should also be noted that while postsecondary education does raise earnings regardless of race, gender, or ethnicity, it does not close significant gender and race wage gaps.200
Declining opportunities for workforce training
Unfortunately, despite demanding skilled workers,201 employers have pulled back their training investments. Workplaces have become increasingly fissured,202 creating fewer opportunities for within-firm training and mobility. At the same time, unions—once prolific training providers—have been weakened,203 and federal funding for workforce training programs has declined,204 further reducing workers’ access to training. Workers are therefore increasingly on their own when it comes to financing training, which can include instruction plus other related costs, such as child care, housing, and transportation. Workers who would benefit from training, therefore, often find themselves unable to participate due to time or cost constraints.
These challenges are particularly acute for people who already face steep barriers to employment, including people who are low income; have low educational attainment; or otherwise face barriers to the labor market, including women, people of color, people with disabilities, people with criminal records, and others. A 2016 Institute for Women’s Policy Research survey of job training administrators, for example, found that “financial considerations,” followed by a lack of child care, were the most commonly cited reasons women did not complete training.205
A paid training trailblazer
Our public employment proposal seeks to help workers—particularly those with barriers to employment—secure family-sustaining, higher-wage jobs by making nationwide investments that will create jobs in child care; long-term services and supports; infrastructure; and climate resilience across the United States. Many of the jobs our proposal would create—such as home health aides and personal care providers; jobs requiring carpentry and electrical skills needed to make rooftops solar-ready; and early childhood teachers—require some education or training beyond high school. We also recognize that people who face barriers to training and work will require some assistance in order to ensure that they are able to participate in and complete the training required for these jobs. We, therefore, propose offering paid training that will directly respond to the private-sector labor market demand created by the Blueprint’s proposed nationwide investments.
Consistent with the broader minimum wage policy set out in this plan, workers participating in paid training programs connected to a nationwide-investments job will earn wages, at a minimum, consistent with the proposal we outline to raise the minimum wage to $15 by 2024. Trainees would be eligible for the same basic benefits available to workers pursuing a job guarantee position. Our proposal would help ensure that workers do not have to choose between participating in training or earning a wage. By creating the demand for skills with the nationwide investments, we would ensure that workers have sufficient opportunities for quality employment at the end of their training.
Under the plan, workers will receive paid training connected to a relevant nationwide investment job. Participating workers will receive employment assistance upon completion to help them transition into one of these new positions or into another related position in the private sector.
Workers in highly distressed communities who participate in paid training will receive similar employment assistance. However, if these workers are unable to secure employment in their field, they will be eligible for a guaranteed job. Workers in nondistressed communities will receive employment assistance but will not be eligible for a guaranteed employment.
Paid training for Future-Ready Community Corps
Our proposal to establish a Future-Ready Community Corps would create 290,000 new positions, including jobs to retrofit more than 2 million homes annually. Workers who are tasked with making homes solar-ready and more energy-efficient require some specialized skills to perform this work. Future-Ready Community Corps workers would therefore be eligible for paid training that prepares them for these positions.
The Solar Ready Vets program, for example—initially launched as a pilot program by the U.S. Department of Energy in 2014—prepares veterans for jobs as PV systems installers and other related occupations.206 The program provides active military personnel with four to six weeks of PV installation training. At the end of the training, students sit for the North American Board of Certified Energy Practitioners (NABCEP) exam in order to earn an NABCEP credential, generally considered the most widely recognized entry-level PV installation credential in the field.207
Similarly, Future-Ready Community Corps workers would prepare for solar jobs by participating in relevant paid training that culminates in an industry-recognized credential, such as an NABCEP certification.
Support for paid training
Paid training programs will be tied to nationwide investments made at the local level to ensure training is properly tied to the new labor market demand the Jobs Blueprint would create. These investments will be allocated to industry partnerships as defined under the Workforce Innovation and Opportunity Act (WIOA)208—including those led by workforce intermediaries such as labor-management-led intermediaries. 209 These intermediaries bring unions or other workforce organizations together with employers to assess local or regional skill needs in an industry and develop training programs that meet those needs.
Intermediaries can operate at either the sectoral, regional, or the national levels. These entities—which can be operated by community-based organizations, nonprofits, labor unions, community colleges, workforce development boards, and other organizations210—help with recruitment and retention and placement and play the role of convener of key community partners, including training and supportive service providers.211 Intermediaries can also promote strategies to ensure that underrepresented or disadvantaged groups have equitable access to education and training programs, which can include, for example, promoting women in nontraditional employment in the trades.212 In a recent report, CAP called on policymakers to provide dedicated support for labor-management led intermediaries—specifically, to ensure that workers have a say in training decisions and are able to ensure training is effectively designed and delivered.213
The U.S. Department of Labor will award funding to industry or sector partnerships in communities that are recipients of nationwide investments or are otherwise equipped to prepare students for nationwide investment jobs. Funds would be used to develop training programs and support the provision of supportive services. These partnerships would be required to engage key stakeholders in the planning process, including local workforce development boards and local institutions of higher education, such as community and technical colleges.
Workers enrolled in these programs would obtain training and credentials that qualify them for nationwide investment jobs. Partnerships may utilize apprenticeships and other on-the-job training or other proven or industry-driven training practices to prepare workers for employment.214
Additional paid training costs
Workers who participate in these programs at institutions eligible for federal student aid will be responsible for financing their training, although we expect that Pell Grants will wholly cover tuition and fees.215 This proposal will also substantially increase funding to the public workforce system to help subsidize the cost of training for workers participating in training provided by institutions not eligible for federal student aid, such as unions or nonprofits. We also expect that paying students a wage while they are enrolled in training will greatly defray other related costs, such as living expenses. Employment counselors at American Jobs Centers (mentioned earlier) will also work with trainees to alleviate any remaining barriers, such as child care or transportation challenges.
We do not anticipate that paid training will increase the cost of the overall proposal given that workers may use the paid training program as a way to take up on their guaranteed slot. However, we do anticipate that implementing the proposal will require an investment to develop and sustain industry partnerships and support related training costs. We, therefore, propose allocating $500 million to industry partnerships and the public workforce system to cover costs associated with this proposal.
Impact and beyond
Paid training will equip workers with credentials needed to obtain the nationwide investment jobs our proposal would create. As such, this new model sets the standards for enabling workers to enroll and complete a workforce training curriculum, and ultimately, unlock the economic opportunities that can arise from new skills and learning. While education alone will not raise workers’ wages or improve employment outcomes, this, coupled with minimum wage increases, collective bargaining, and other worker protections can help ensure more workers have access to a good job.
We plan to further address private-sector demand for skilled workers—along with the challenge of declining employer investment in training—in forthcoming work. Similarly, future CAP work will expand on broader solutions to improving college access, affordability, and completion.
The business cycle and monetary policy
It should be noted again that the policy proposals discussed to this point are not primarily intended to counter cyclical changes in employment or it effects. They are explicitly built to address the observable trends in wages and employment that affect workers—trends that have left millions of workers still struggling even with an unemployment rate below 4 percent. This Jobs Blueprint is offered as a direct response to that challenge—identifying a need for active efforts to support good-paying jobs, both nationwide and in distressed communities, even during an economic expansion.
This is not to minimize the need for stronger policies to respond directly to cyclical downturns. The events of the Great Recession should act as a reminder that business cycle effects can be very powerful. The Blueprint would put the economy in a stronger place in the case of a business cycle downturn, but it is not intended to take the place of automatic stabilizers or other countercyclical fiscal policy. The responses to cyclical problems should be tailored to their shorter-term duration.
Previous CAP policy work provides good examples of policy responses that could help to mitigate the employment and wage effects of a recession and act as automatic stabilizers for the economy. One such option CAP has proposed is a program of expanded national service, which would automatically create new and temporary national-service positions during times of high unemployment. These positions would phase out as the economy returns to normal.216 It would automatically fund new and temporary national service positions based on incremental increases in the long-term unemployment rate. The plan includes guardrails to make certain that national service is not expanded more rapidly than the system can support and prevent economic shocks that would follow from reducing temporary positions too rapidly. Similarly, CAP has proposed a national subsidized employment program, which pays a portion of workers’ salaries for a set period of time in order to facilitate businesses and nonprofits hiring unemployed workers, particularly those with heightened barriers to employment.217
Automatic stabilizers, such as unemployment insurance and the Supplemental Nutrition Assistance Program (SNAP), provide critical protections to ensure families can afford the basics and make ends meet when they experience a layoff or when job opportunities are scarce. A much more robust unemployment insurance system that includes greater support for people searching for work would also help to mitigate cyclical impacts.218 Together with the Georgetown Center on Poverty and Inequality and the National Employment Law Project, CAP has proposed a comprehensive set of needed reforms. These include expanding coverage to reach more unemployed workers, improving benefits, expanding work sharing, and making re-employment services more effective. In addition, the proposal advocates for the creation of a jobseeker’s allowance—a short-term support that would help those not eligible for unemployment insurance, such as independent contractors and those with limited work history, engage in a labor market search during economic contractions.
The success of the employment and wage policies advanced here will also be affected by the policy stance of the Federal Reserve. By raising interest rates, the Federal Reserve can slow the economy and reduce overall employment, negating some or all of the aggregate employment and wage benefits that would otherwise be created. While it would still be the case that the public investments and job guarantees would, in themselves, support working-class employment and wages, contractionary monetary policy would work in the opposite direction across the economy generally.
To the extent that the Federal Reserve relies too heavily on ideas such as the “natural rate of unemployment” as a guide for monetary policy,219 or de-emphasizes employment relative to inflation when executing its dual mandate,220 the more likely it is that interest rate policy would reduce the impact of these policies unnecessarily. It is important that monetary policy avoid this.
The United States can afford to invest in its workers and communities
As the world’s largest economy and one of the richest, the United States has ample capacity to make the kinds of investments in our workers and communities that the Jobs Blueprint proposes. We just need to have the will to do so. Fully financing the proposals in this paper would require a commitment of $250 billion, roughly 1.3 percent of gross domestic product (GDP).221 To put that in perspective, the tax legislation enacted in December is expected to increase the deficit in the coming fiscal year by $281 billion.222 Therefore, for about the same cost as the tax cuts that overwhelmingly benefit the wealthiest Americans and corporations, the United States could put millions of people directly to work; make child care affordable for millions of working parents; rebuild our transportation, water, and school infrastructure; prepare our communities and housing stock for climate change; and provide quality long-term care for older Americans and people with disabilities.
The Jobs Blueprint is designed to set out what is needed to bring the economy closer to full employment, creating opportunity for millions of Americans who have been falling behind or have been left behind altogether. In doing so, the Blueprint, as set out in this report, does not attempt to take on the additional question of where the plan fits in a conversation about our fiscal path going forward. But this conversation should occur with a recognition that—even beyond undoing the recent tax bill—the United States has significant capacity to raise more revenue in a progressive and economically efficient manner.
In the coming months, CAP will lay out an additional menu of options for raising revenues that could be applied for a variety of purposes, including paying for ambitious new investments such as the ones described in this proposal.
Reforms to raise wages and rebuild economic power for America’s working class
The job-creating nationwide investments, job guarantee, and paid training proposals outlined above will go a long way toward meeting the challenge of declining demand for the labor of America’s workers and raising wages and job quality through tightening the labor market. But to restore America’s workers to middle-class economic stability, additional reforms will be needed to shift economic power back in the direction of workers. While the long list of needed reforms to counter the concentration of economic power would include stronger antitrust, tax, financial regulatory, trade, employment law changes, and more, this report focuses specifically on two vitally important labor market changes that directly tackle working-class wage stagnation: The minimum wage and bargaining power.
To begin with, we note that within all of the policies outlined above—nationwide investments, a job guarantee, paid training—we adopt a new higher minimum wage, the proposal of which is outlined below. But we also propose below reforms that would raise wages for workers making far beyond that floor.
History shows us that to earn high wages, workers need bargaining power. The policy choices outlined support building that worker power. First, tighter labor markets inherently strengthen worker negotiating leverage. The approximately 4 million jobs the nationwide investments and the job guarantee create will have the benefit of putting upward pressure on the wages and job quality of the American working class. The initiatives also build in explicit bargaining protections. But, critically, we further strengthen the hand of workers by deploying new tools that enhance worker bargaining—and we do so to all relevant labor markets.
Restore worker bargaining power
Collective bargaining—where workers negotiate as a group with their employer—has proven to be a powerful force for raising wages and enabling broad-based participation in the middle class.223 Workers who are unionized and bargain collectively earn roughly 14 percent more per hour than comparable workers and are much more likely to have health and retirement benefits.224 When enough workers in an industry or region are able to bargain collectively, nonunion firms tend to raise their wages as well.225
Collective bargaining can be particularly powerful for groups that face discrimination—such as women and people of color—by creating fair processes, raising wages, and closing pay gaps.226 Unions also help boost economic mobility not only for their members but also for entire regions.227
Unfortunately, our current system of collective bargaining no longer works very well because of concerted attacks on unions by corporate special interests and because the law has not kept up with changes in the economy.
Polls show that 61 percent of Americans approve of labor unions—an approval rating similar to those in the 1970s and 1980s.228 Yet, despite generally positive approval ratings over the past several decades and polls showing that a majority of workers would like to join a union, the share of unionized private-sector workers has fallen sharply.229 Today, just more than 6 percent of private-sector workers are union members, which is about as low as union density has been since the National Labor Relations Act was passed in 1935 and substantially lower than the roughly one-third of private-sector workers in the 1950s.230
The decline of unions and collective bargaining is responsible for up to one-third of the rise in inequality among male workers over recent decades, according to research by Harvard University’s Bruce Western and Washington University’s Jake Rosenfeld.231 Estimates also indicate that nonunion workers have lost roughly $133 billion in annual wages due to weakened unions.232
Current law is dramatically tilted against workers trying to organize and bargain collectively. Indeed, there are virtually no repercussions for companies that break the rules.233 This allows business owners to clamp down on their workplaces and stamp out unionization efforts through legal means, such as by forcing workers to attend mandatory anti-union meetings with their supervisor, and illegal means, such as by punishing or firing workers for supporting a union.234 The weakness of penalties has become a bigger problem over recent decades as employers have increased their opposition to unions. Adding to these problems are significant restrictions on the right to strike, which prevent workers from being able to withhold their labor as a tool to improve pay and conditions. Furthermore, a number of states have passed so-called right-to-work laws, which allow workers to receive the benefits of unionization without having to pay for its costs, thus undermining unions.235
A central but lesser-known flaw in the current U.S. bargaining system is that it channels negotiations to the firm level—or a unit within a firm—instead of to a higher level such as a group of firms in an industry. As the percentage of workers in unions declines—as mentioned, it is just more than 6 percent in the private sector—firm-level bargaining leaves out a growing share of the workforce.236 Firm-level bargaining also exacerbates conflicts between workers and employers because it generally causes unionized firms to have higher labor costs than their competitors, further incentivizing anti-union efforts.
Firm-level bargaining has become even less effective in recent years as companies have contracted out work and directly employed fewer people.237 As firms’ structures change, workers often have trouble negotiating with the firm that is actually in charge and increasingly risk receiving lower pay and losing benefits when their employer changes.
Furthermore, over recent decades, a growing number of sectors of the economy have become dominated by a few firms. Evidence is emerging that increasingly concentrated industry sectors are not only leading to higher consumer prices but may be resulting in lower wages and fewer job changes for workers.238
The United States needs a collective bargaining system that responds to weaknesses in the law, changes in the economy, and employer behavior over recent decades. In this modernized bargaining system, virtually all workers would be able to join together and collectively bargain; workers would have sufficient power to negotiate with employers; and bargaining would occur primarily at the industry level.
To achieve these goals, CAP strongly supports—and the Jobs Blueprint incorporates—a number of reforms, including the WAGE Act.239 Specifically, the Jobs Blueprint would provide virtually all workers with the right to join a union and bargain collectively and ensure that these rights are adequately protected. The Blueprint also incorporates policies that fundamentally change the rules of the game to encourage collective bargaining at the industry or regional level as well as to strengthen funding streams for unions and promote additional forms of worker organization.
As a starting matter, the Jobs Blueprint would increase penalties, strengthen enforcement, and ensure workers can win recognition for their union and successfully negotiate a first contract. Companies should face significant fines for violations of labor law and violations should be swiftly dealt with. Workers should have the ability to go to court without having to wait for government. Signatures should be a valid way to join a union; employers should not be able to have captive audience meetings with workers about unions; and mediation and arbitration should be required for first contracts. Firms would be prohibited from attempting to persuade workers employed on taxpayer-supported work to exercise or not to exercise the right to organize and collectively bargain.
The Jobs Blueprint would provide bargaining rights to all workers and expand the right to strike. Virtually all workers should have bargaining rights, including public sectors workers, supervisors, agricultural and domestic workers, and most independent contractors. Workers that strike should not be able to be permanently replaced. Moreover, workers should have free speech rights to strike, picket, or boycott their own employers or other employers in order to improve working conditions.
A central element of the Blueprint’s plan to rebuild worker power includes policies to encourage industry-wide bargaining. This includes enabling workers to choose the appropriate bargaining unit and allowing strikes to encourage multiemployer bargaining.240 To further kick-start bargaining above the firm level, new “wage boards” would be created to bring together representatives of workers, businesses, and the public to set minimum pay and benefit standards for industries and occupations.241 These boards would set pay levels based on a range of economic and social factors, including the skill level of the work, productivity, and the cost of living—taking care not to continue current societal practices that devalue work in industries and occupations where women and racial minorities are overrepresented. Individual workers and unions could negotiate for improvements, and the board would make union contracts generally applicable in an area once they reach representativeness thresholds.
The Jobs Blueprint also endorses new forms of worker organization and would strengthen funding streams for unions and other worker organizations. For example, employers over a certain size would establish “works councils” at their worksite, which would focus on addressing firm- or worksite-level concerns.242 Workers would be elected to these councils, and the councils, in turn, would select worker representatives on corporate boards. To limit the ability of workers to free ride and benefit from union activities without paying for them, state right-to-work laws would be banned. To make it as easy as possible for workers to pay dues and encourage membership, employers would be required to facilitate paycheck deduction to unions and worker organizations of their choosing, and unions and worker organizations would be involved in the enforcement of employment law violations as well as in the operation of workforce training programs.243
These changes will help workers gain power to negotiate on a relatively even playing field with their employers and would lead to significant increases in wages and benefits for all workers, especially low- and middle-wage workers.
Collective bargaining complements full-employment policies. Tight labor markets provide the most benefits for workers who are willing and able to shop for a new employer. However, not every worker wants to threaten to quit in order to receive a pay raise, and not every employer pre-emptively raises wages to avoid losing employees. Furthermore, policies that support employment will have a hard time raising wages if the underlying private-sector economy remains below full employment. Collective bargaining helps raise wages for all workers in all economic conditions.
Workers will benefit the most if they can leverage the power of both higher employment and collective bargaining. Policies to promote higher levels of employment help workers strengthen their voices in negotiations, while collective bargaining ensures that tighter labor markets lead more evenly and directly to real workplace improvements.
Raise the federal minimum wage to $15 by 2024
All workers deserve a fair wage on the job that allows them to provide for their family. However, this is not the case today for far too many Americans. Unions provide perhaps the most powerful force for ensuring that workers earn fair wages, and we discussed how to restore union power previously. But a critical element of any discussion of wages is the federally mandated legal minimum.
The federal minimum wage has remained at $7.25 per hour for nearly nine years while families’ costs have continued to climb. As a result, many minimum-wage workers cannot make ends meet. A worker earning the minimum-wage working full-time for the entire year currently brings home just $15,080—below the federal poverty line for even a two-person household.244 That is $2,370 less than the purchasing power such an earner obtained in 2009.245 To earn the same inflation-adjusted amount annually today as she did in 2009, a minimum-wage worker in 2018 would have to work for an additional 41 days.246
But even in 2009, the minimum wage fell well short of its peak value historically. The minimum wage was worth nearly $10 in today’s dollars in 1968—about 20 percent more than the inflation-adjusted value of the minimum wage in 2009. Importantly, the 1968 minimum wage was much closer to what the typical worker was making than it is today. In 1968, the minimum wage was 53 percent of the average hourly earnings of production and nonsupervisory employees. Today, it is just 33 percent of the typical earners’ wage, indicating that those at the bottom of the wage distribution are falling further behind other workers.247 Since 1968, the U.S. economy has grown dramatically, but minimum-wage workers have not seen their wages grow accordingly. Today’s minimum wage would be well above $18 per hour had it grown alongside overall productivity since 1968.248
While the federal government has failed to act, many states have taken action to raise the minimum wage for workers in their state. Twenty-nine states as well as Washington, D.C., have now set their minimum wage above the federal wage.249 And a growing number of states already require tipped workers and workers with disabilities to be paid the full minimum wage.250
These increased minimum wages have paid real dividends for low-wage workers. Analysis from economist Elise Gould at the Economic Policy Institute finds that wage growth for the lowest-paid workers from 2013 to 2017 was more than twice as fast in the states that raised their minimum wage at least once during that time period—5.2 percent, compared to the 2.2 percent growth found in states without minimum wage increases.251 Over this same time period, economist Jared Bernstein found that the states with at least one wage hike experienced higher overall employment growth than states that left their minimum wage unchanged.252
Even with increased state action in recent years, too many working families are unable to secure a living wage on the job. In 2016, about 39 percent of employed workers lived in states that have not set minimum wages above the federal level. Black workers (49.8 percent) and workers without four-year college degrees (40.6 percent) are even more likely to live in these low minimum wage states.253 And while Arizona, California, Colorado, Maine, New York, and Washington state have approved future minimum wages above $12,254 other states have yet to enact laws to move their minimum wages above this threshold and closer toward a living wage.
Federal policymakers should right this wrong by immediately raising the pay of millions of workers, eliminating the discriminatory subminimum wages for tipped workers and workers with disabilities,255 and setting the federal minimum wage on a path to reach $12 per hour by 2020 and $15 per hour in 2024, indexed thereafter to the median wage. 256 The Economic Policy Institute estimates that by 2024, these policies would directly raise the wages of 22.5 million workers—29 percent of American workers—who would, on average, receive a $5,100 annual raise.257 Minimum wage increases also tend to boost the pay of workers who make just above the new minimum wage, since employers tend to maintain internal pay hierarchies after minimum wage increases are implemented.258 This indirect effect would result in higher wages for 19 million workers whose employers would raise their hourly pay above $15.
A $15 minimum wage would be a huge benefit for workers currently struggling to support themselves and their families. Contrary to claims that often emerge in the minimum wage debate, this wage increase would affect vastly more workers than just teenagers—a full 90 percent of its beneficiaries are aged 20 or older. Nearly 1 in 4 prime-aged workers—those ages 25 to 54—would see their pay grow as a result of a $15 minimum wage in 2024. Workers with less than a college degree would be especially likely to see benefits from this minimum wage level: Nearly 4 in 10 of these workers would be affected compared to about 10 percent of workers with a bachelor’s degree or more.259
Such a minimum wage increase would also help to close gender and racial pay gaps that currently exist in U.S. society. As shown in the below figure, more than one-third of women would see a pay increase (compared to one-quarter of men) and a greater share of black and Hispanic workers would receive pay raises than their white counterparts.
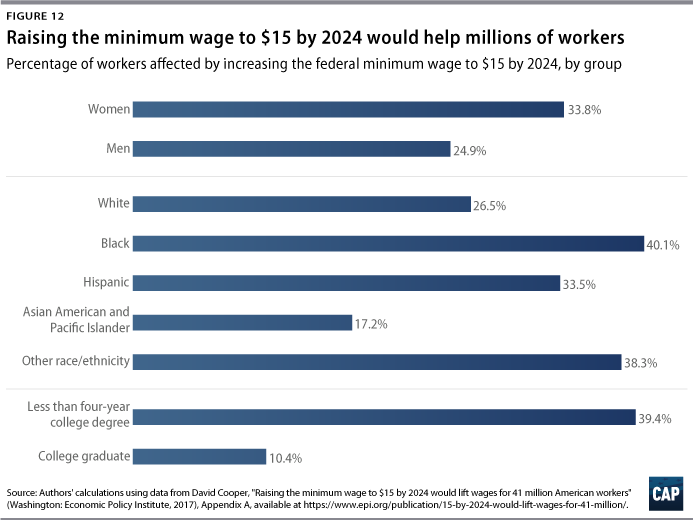
Raising the minimum wage can also help boost the economy. There is increasing evidence that the U.S. labor market does not actually reflect the textbook case of a perfectly competitive market, where wages are set by the market so that employees are paid wages that closely mirror their productivity.260 Instead, firms have market power and can, to some extent, determine the wage they will pay instead of taking wage levels determined by the market—also known as labor market monopsony. Under monopsony, firms can choose to keep wages artificially lower than they would be in a competitive market. This keeps employment and output lower than it would be if employers lacked market power but allows for higher firm profits due to paying lower wages. When monopsony exists in labor markets, wage increases—whether caused by raising the minimum wage, reductions of barriers to entry for firms, limiting noncompete agreements, or collective bargaining—can actually serve to boost employment and output.
Minimum wage increases are also effective at lifting families out of poverty. A working paper by Arindrajit Dube—an economist at the University of Massachusetts Amherst—for the Washington Center for Equitable Growth examined state-level minimum wage increases and found that raising the minimum wage led to increases in family income for those near the bottom of the income distribution. Using these findings, Dube estimated that raising the federal minimum wage to $12 per hour would bring 6.6 million individuals out of poverty and raise family incomes of those at the tenth income percentile by over $2,100, even after taking reductions in government assistance into account.261
While some suggest that minimum wage increases will lead to job losses, companies can adjust to the increased labor costs through a variety of ways. First, minimum wage increases tend to decrease employee turnover rates, which are very high in low-wage industries. Since replacing employees and training their replacements is a costly endeavor—costing about one-sixth of a low-wage workers’ annual salary—this reduction in turnover saves employers a significant amount. For example, Michael Reich, Sylvia Allegretto, and Anna Godoey estimate the reduction in turnover absorbs about 15 percent of the increased payroll costs resulting from Seattle’s minimum wage increase.262 Paying higher wages can also increase worker productivity. Studies show increased wages can lead to more productive workers by increasing motivation, reducing absenteeism, and reducing workers’ financial stress.263 Employers can also adjust for increased minimum wages by raising prices. But since not all workers receive pay increases from minimum wage hikes and labor costs make up only a subset of total operating costs, these price increases tend to be small.264
Furthermore, raising the minimum wage will increase the aggregate income going to families near the bottom of the income distribution, who tend to spend a greater share of their income. This increased spending serves to boost aggregate demand and create additional jobs. When researchers from the University of California, Berkeley Institute for Research on Labor and Employment modeled the potential economic effects of $15 minimum wage proposals in California and New York state, they found that the number of jobs created through increased aggregate demand outweighed any job loss from increased automation and the impact of price increases.265
As a result of these adjustment mechanisms, several studies have found that previous minimum wage increases have had little effect on employment levels.266 For example, a 2017 working paper from Doruk Cengiz, Arindrajit Dube, Attila Lindner, and Ben Zipperer examines how state minimum wage increases from 1979 to 2016 affect wages and employment for workers making around the new minimum wage. The authors find significant wage gains for affected workers as well as statistically insignificant changes in employment.267 Additionally, a study of Seattle’s minimum wage increase to $13 per hour from Reich, Allegretto, and Godoey found that employment effects in the food service industry, which is often reliant on minimum-wage workers, were not significantly different from zero.268
But should there be displacement of workers because of the increase in the minimum wage, the scale of job creation will be sufficient to absorb these workers in the aggregate as a result of the major nationwide investments and the job guarantee set out under this Blueprint.269
Conclusion
The economic challenges facing American workers are undeniable. Our economy has not delivered the levels of employment or the real wages working Americans need to fully participate in or reap the rewards from our nation’s economic growth. The sources of these challenges are many, but insufficient demand for labor—driven by concentration of corporate market power, technical change, and increased global competition—together with the atrophy of institutional supports for good wages; the long-run tendency of highly productive activity to concentrate in particular regions of the country; racial, gender, and other disparities; and extreme weather have all played important roles.
A range of policy responses are needed to address these complex challenges that are negatively affecting working Americans’ economic security. In this report, we have outlined a series of policy changes that squarely counter several of these complex economic forces. The five major nationwide investments will boost employment opportunities nationally and provide the overwhelming bulk of job-creating demand. These also deliver productivity-enhancing benefits, such as supporting greater labor force participation rates and pay equity for women and persons of color; improving infrastructure and K-12 schools; and helping communities become better prepared for the effects of extreme weather. A targeted job guarantee will provide additional support for the most distressed communities. Paid training will support a new model for upskilling workers. And additional labor market reforms to raise wages will shift economic power much more sharply in favor of workers. Together, the policies of this Jobs Blueprint tackle head on the deep and abiding failure of the market to create sufficient private-sector demand for the labor of American workers. In doing so, they help restore the virtuous cycle of economic opportunity for these workers and their communities and build a more productive America, ready to face the future together.
Acknowledgements
The Center for American Progress thanks the funders who made this research and report possible including The Annie E. Casey Foundation, The JPB Foundation, The Rockefeller Foundation, and The Siegel Family Endowment. We thank them for their support but acknowledge that the findings and conclusions presented in this report are those of the authors alone, and do not necessarily reflect the opinions of the foundations.
CAP deeply appreciates the time, engagement, and opportunity to exchange ideas with our distinguished advisory committee. Their participation does not signify endorsement of the ideas in the paper.
Advisory Committee
Hon. Carmel Martin, Chair, distinguished senior fellow, Center for American Progress and former assistant secretary for policy and budget at the U.S. Department of Education
Geoconda Argüello-Kline, secretary-treasurer to the Culinary Workers Union, Local 226
Katherine Cramer, professor of political science, University of Wisconsin–Madison
Diana Yazzie Devine, president and CEO of Native American Connections, Phoenix, Arizona
Arindrajit Dube, associate professor of economics, University of Massachusetts Amherst
Peter Hille, president of the Mountain Association for Community Economic Development (MACED), eastern Kentucky
Hon. Marc Morial, CEO National Urban League and former mayor of New Orleans
Susan Parish, dean of the Bouvé College of Health Sciences, Northeastern University
Hon. Thomas Vilsack, former U.S. Secretary of Agriculture and governor of Iowa
In addition, we greatly appreciate the input of bipartisan roundtables of individuals from Ohio, Mississippi, and Louisiana, facilitated by a range of local partner organizations that we also thank for their support.
CAP also acknowledges the hard work of a wide range of its staff, including but not limited to Luke Bassett, Will Beaudouin, Regina Willensky Benjamin, Melissa Boteach, Catherine Brown, Maura Calsyn, Colleen Campbell, Alison Cassady, Rebecca Cokley, Ryan Collins, Ed Chung, Denzel Cummings, Kevin DeGood, Christine Dickason, Laura E. Durso, Rejane Frederick, Jocelyn Frye, Gregg Gelzinis, Christy Goldfuss, Andy Green, Saharra Griffin, John Halpin, Katie Hamm, Angela Hanks, Chester Hawkins, Seth Hanlon, Tony Hanna, Galen Hendricks, Marc Jarsulic, Laura Jimenez, Daniella Gibbs Leger, Jacob Leibenluft, Cathleen Kelly, Michael Madowitz, David Madland, Annie McGrew, Ben Miller, Ben Olinsky, Shilpa Phadke, Allison Preiss, Bill Rapp, Katherine Gallagher Robbins, Alex Rowell, Scott Sargrad, Eliza I. Schultz, Andrew Schwartz, Danyelle Solomon, Winnie Stachelberg, Emily Tisch Sussman, Neera Tanden, Rebecca Vallas, Lauren Vicary, Karla Walter, Christian E. Weller, Rachel West, and Simon Workman.