The sad economic story stays the same month after month. The economy keeps expanding, profits stay high, and the stock market continues to flirt with new records. Meanwhile, American families struggle with persistent challenges such as stagnant wages and high debt. The economic data show that the most Americans’ economic lives are slowly improving, but the wealthy continue to pull away from the rest.
The bottom line is that decision makers need to enact policies that can make a real difference in people’s lives. Such policies include a higher minimum wage, stronger overtime protections, and paid family leave to make sure that middle-class Americans can share equally in economic growth. Additional policies such as infrastructure investments in roads, bridges, and schools can help to insulate economic growth from the possible fallout of slowing overseas demand. American families have seen few economic gains during the economic recovery of the past few years. It is important that economic policy strengthens economic growth and creates real middle-class economic security.
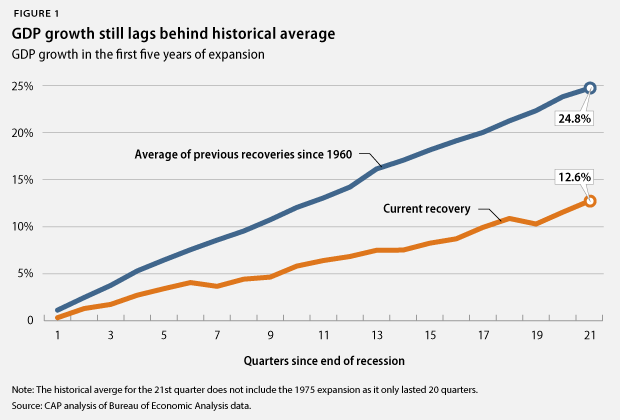
1. Economic growth in this recovery lags behind that of previous business cycles. GDP increased in the third quarter of 2014 at an inflation-adjusted annual rate of 3.9 percent, after an increase of 4.6 percent in the previous quarter. Domestic consumption increased by an annual rate of 2.2 percent, and housing spending rose by 2.7 percent, while business investment growth also increased at a rate of 7.1 percent. Exports increased 4.9 percent in the third quarter, while imports decreased 0.7 percent. Federal government spending rose by 9.9 percent, while state and local government spending increased by only 0.8 percent. The economy expanded 12.6 percent from June 2009 to September 2014—its slowest expansion during recoveries of at least equal length.
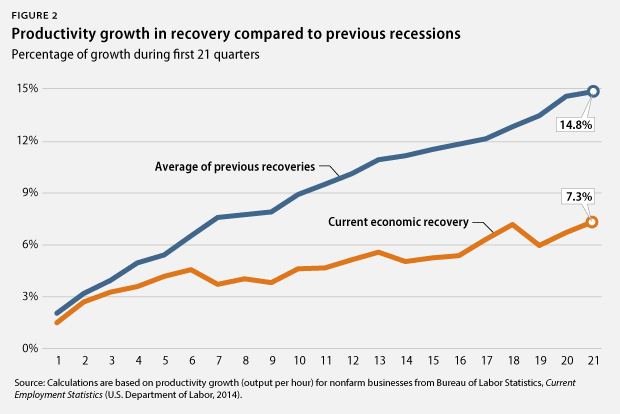
2. Improvements to U.S. competitiveness fall behind previous business cycles. Productivity growth, measured as the increase in inflation-adjusted output per hour, is key to increasing living standards, as it means that workers are getting better at doing more in the same amount of time. Slower productivity growth thus means that new economic resources available to improve living standards are growing more slowly than would be the case with faster productivity growth. U.S. productivity rose 7.3 percent from June 2009 to September 2014, the first 21 quarters of the economic recovery since the end of the Great Recession. This compares to an average of 14.8 percent during all previous recoveries of at least equal length. No previous recovery had lower productivity growth than the current one.
3. The housing market recovery still struggles to gain momentum. New-home sales amounted to an annual rate of 458,000 in October 2014—a 1.8 percent increase from the 450,000 homes sold in October 2013 but well below the historical average of 698,000 homes sold before the Great Recession. The median new-home price in October 2014 was $305,000, up from one year earlier.Existing-home sales increased by 2.5 percent in October 2014 from one year earlier, and the median price for existing homes was up by 5.5 percent during the same period. Home sales have to go a lot further, given that homeownership in the United States stood at 64.4 percent in the third quarter of 2014, down from 68.2 percent before the 2007 recession. The current homeownership rates are similar to those recorded in 1996, well before the most recent housing bubble started.A strong housing-market recovery can boost economic growth, and there is still plenty of room for the housing market to provide more stimulation to the economy more broadly than it did before the recent slowdown.
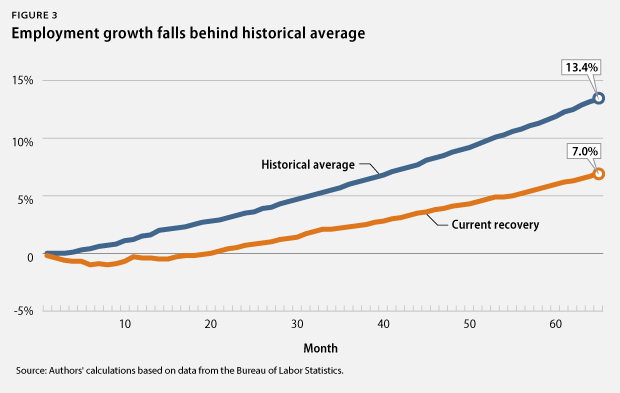
4. Moderate labor-market recovery shows less job growth than in previous business cycles. There were 9.1 million more jobs in November 2014 than in June 2009. The private sector added 9.7 million jobs during this period. The loss of some 548,000 state and local government jobs explains the difference between the net gain of all jobs and the private-sector gain in this period. Budget cuts reduced the number of teachers, bus drivers, firefighters, and police officers, among others. The total number of jobs has now grown by 7 percent during this recovery, compared to an average of 13.4 percent during all prior recoveries of at least equal length.
5. Employment opportunities grow very slowly for people in their prime earning years. The employed share of the population from ages 25 to 54—which is unaffected by the aging of the overall population—was 76.9 percent in November 2014. This was just above the level recorded in June 2009 and well below the levels recorded since the mid-1980s and before the Great Recession started in 2007. The employed share of the population has, on average, grown by 3.4 percentage points at this stage during previous recoveries of at least equal length.
6. Employers cut back on health and pension benefits. The share of people with employer-sponsored health insurance dropped from 59.8 percent in 2007 to 53.9 percent in 2013, the most recent year for which data are available. The share of private-sector workers who participated in a retirement plan at work fell to 40.8 percent in 2013, down from 41.5 percent in 2007. Families now have less economic security than in the past due to fewer employment-based benefits, which requires them to have more private savings to make up the difference.
7. Some communities continue to struggle disproportionately from unemployment. The unemployment rate remained at 5.8 percent in November 2014. The African American unemployment rate rose to 11.1 percent, the Hispanic unemployment rate decreased for the fourth consecutive month to 6.6 percent, and the white unemployment rate slightly increased to 4.9 percent. Meanwhile, youth unemployment decreased to 17.7 percent. The unemployment rate for people without a high school diploma rose to 8.5 percent, compared with 5.6 percent for those with a high school degree, 4.9 percent for those with some college education, and 3.2 percent for those with a college degree. Population groups with higher unemployment rates have struggled disproportionately more amid the weak labor market than white workers, older workers, and workers with more education.
8. The rich continue to pull away from most Americans. Incomes of households at the 95th percentile—those with incomes of $196,000 in 2013, the most recent year for which data are available—were more than nine times the incomes of households in the 20th percentile, whose incomes were $20,900. This is the largest gap between the top 5 percent and the bottom 20 percent of households since the U.S. Census Bureau started keeping records in 1967. Median inflation-adjusted household income stood at $51,939 in 2013, its lowest level in inflation-adjusted dollars since 1995.
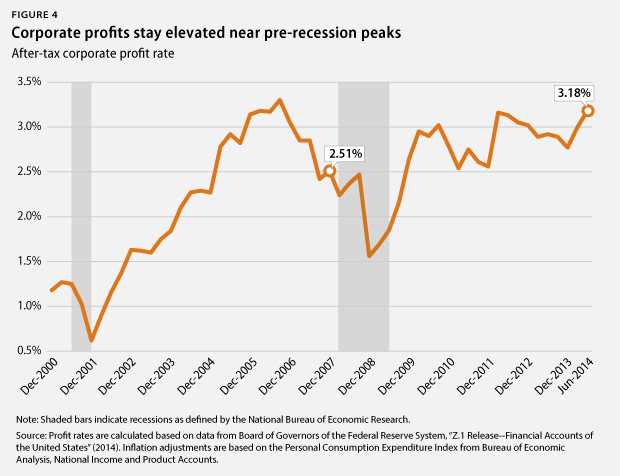
9. Corporate profits stay elevated near pre-crisis peaks. Inflation-adjusted corporate profits were 94 percent larger in September 2014 than in June 2009. The after-tax corporate profit rate—profits to total assets—stood at 3.2 percent in September 2014. Corporate profits recovered quickly toward the end of the Great Recession and have stayed high since then. Addressing income inequality that arises from the rich receiving outsized benefits from their wealth through tax reform is a crucial policy priority.
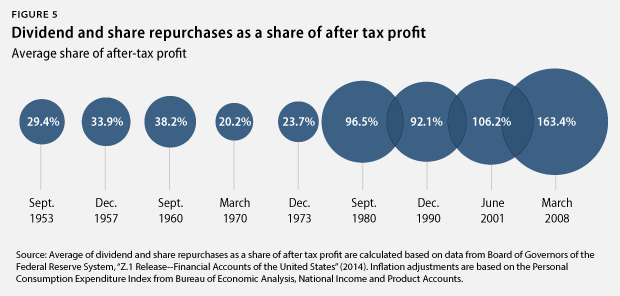
10. Corporations spend much of their money to keep shareholders happy. From December 2007—when the Great Recession started—to September 2014, nonfinancial corporations spent, on average, 98.5 percent of their after-tax profits on dividend payouts and share repurchases. In short, almost all of nonfinancial corporate after-tax profits have gone to keeping shareholders happy during the current business cycle. Nonfinancial corporations also held, on average, 5.3 percent of all of their assets in cash—the highest average share since the business cycle that ended in December 1969. Nonfinancial corporations spent, on average, 169.9 percent of their after-tax profits on capital expenditures or investments—by selling other assets and by borrowing. This was the lowest ratio since the business cycle that ended in 1960. U.S. corporations have prioritized keeping shareholders happy and building up cash over investments in structures and equipment, highlighting the need for regulatory reform that incentivizes corporations to invest in research and development, manufacturing plants and equipment, and workforce development.
11. Poverty is still widespread. The poverty rate was 14.5 percent in 2013, down from 15 percent in 2012. This change, however, was statistically insignificant. Moreover, the poverty rate for this recovery increased at a rate of 0.2 percentage points, compared to an average decrease of 0.7 percentage points in previous recoveries of at least equal length. Some population groups suffer from much higher poverty rate than others. The African American poverty rate, for instance, was 27.2 percent, and the Hispanic poverty rate was 23.5 percent, while the white poverty rate was 9.6 percent. The poverty rate for children under age 18 fell to 19.9 percent. More than one-third of African American children—37.7 percent—lived in poverty in 2013, compared with 30.4 percent of Hispanic children and 10.7 percent of white children.
12. Household debt is still high. Household debt equaled 102.5 percent of after-tax income in September 2014, down from a peak of 129.7 percent in December 2007. A return to debt growth outpacing income growth, which was the case prior to the start of the Great Recession in 2007, from already-high debt levels could eventually slow economic growth again. This would be especially true if interest rates also rise from historically low levels due to a change in the Federal Reserve’s policies. Consumers would have to pay more for their debt, and they would have less money available for consumption and saving.
Christian E. Weller is a Senior Fellow at the Center for American Progress and a professor in the Department of Public Policy and Public Affairs at the McCormack Graduate School of Policy and Global Studies at the University of Massachusetts, Boston. Jackie Odum is a Research Assistant for the Economic Policy team at the Center.