This issue brief contains corrections.
The nation’s Social Security system has long been a bedrock of economic security, protecting nearly all American workers and their families in case of retirement, disability, or the death of a primary breadwinner. Some 239 million workers ages 20 and older are insured under the program. In 2013, Social Security provided benefits to 58 million people, including 41 million retirees and dependents of retirees, 6 million survivors of deceased workers, and 11 million disabled workers and dependents of disabled workers.
Social Security has become a core component of retirement security in the United States: Nearly two-thirds of seniors rely on the program’s benefits for most of their income. Similarly, more than 8 in 10 disabled worker beneficiaries rely on Social Security as their main source of income. For 3 in 10 of those workers, Social Security is the only source of income. Social Security also serves as the largest income security program for children, providing vital benefits to 3.4 million children and their families. Year after year, Social Security serves as our nation’s most effective anti-poverty program; in 2012, it kept more than 22 million Americans out of poverty.
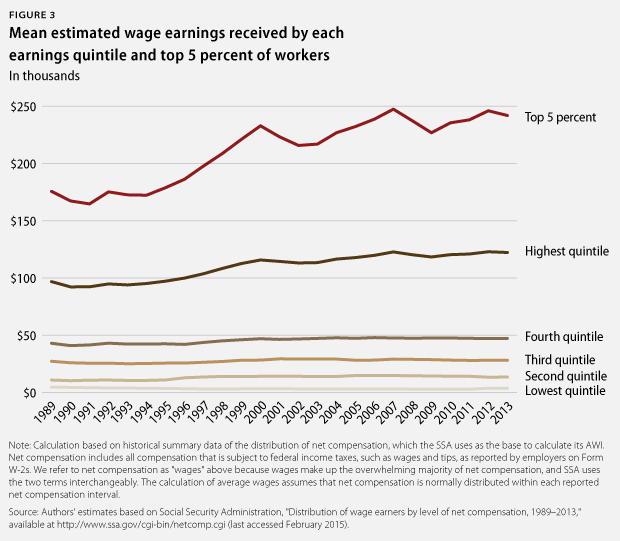
Over the past three decades, however, rising inequality has increasingly threatened the notion of shared economic security. Those at the top of the income spectrum have seen tremendous gains, while most Americans have watched their wages decline or stagnate amid rising costs. In the wake of the Great Recession, the top 1 percent of households captured roughly 76 percent of inflation-adjusted income gains between 2009 and 2013.
Much of the leap made by the very rich is attributable to nonwage forms of income such as capital gains, but huge disparities also persist when looking only at wages, which form the basis for Social Security tax revenues because payroll taxes only apply to wage income. In 2013, for example, the top 1 percent of earners took home about 12.9 percent of the nation’s total wage income in 2013—nearly as much as the share received by the entire bottom half of workers, who captured approximately 13.7 percent of wage income. This growing divide in wages—combined with the fact that wages in excess of the taxable maximum are exempt from payroll taxes—means that millionaire and billionaire earners stop contributing to Social Security early in the year, while the average worker contributes all year long. In 2015, individuals with wage incomes of $1,000,000 stop contributing on February 12; those with higher incomes stop contributing sooner.
Meanwhile, although productivity growth for American workers has more than doubled over the past two decades, incomes for the bottom 50 percent of workers have barely increased in inflation-adjusted terms, and they have actually declined for the bottom 20 percent. In short, most American workers have seen their wages decline or remain stagnant, while they have become twice as good at doing their jobs. At the same time, the costs of goods and services that support a middle-class lifestyle have risen significantly.
This issue brief explores how rising wage inequality has affected the financial outlook of Social Security. We first provide a brief overview of Social Security’s funding structure and its current financial outlook based on the Social Security Administration’s, or SSA’s, most recent projections. Next, we highlight relevant wage trends that have impacted the trust funds’ solvency. Finally, we provide two simulations that highlight the impact that rising income inequality has had on Social Security’s finances over the past three decades.
The first simulation shows what the assets of the combined Social Security trust funds would be today if the average worker’s wages had kept pace with productivity growth between 1983—the year when the last round of major legislative reforms to the program was enacted—and 2013. We find that this wage growth would have increased the trust funds’ assets by $753.8 billion. The second simulation demonstrates what the trust funds would look like today if the maximum taxable wage base had remained fixed at 90 percent of earnings over the same time period. In this case, the trust funds would have at least an additional $1.1 trillion.
In their annual report, the Social Security trustees answer a related question about the future rather than the past: How would raising the cap to cover 90 percent of earnings—starting in 2015—affect the trust funds’ shortfall? They find that this change alone would close more than one-quarter of the expected 75-year shortfall in the combined trust funds.
The two simulations in this brief illustrate how recent trends in workers’ wages have eroded the finances of our Social Security system and put American families at risk. Yet while we cannot undo the past, it is not too late for policymakers to take appropriate steps to strengthen Social Security for current and future generations.
Making connections: Income inequality and Social Security
The Social Security system is financed through payroll taxes called Federal Insurance Contributions Act, or FICA, taxes. Revenue from these taxes is deposited into two trust funds—the Old Age and Survivors Insurance, or OASI, Trust Fund and the Disability Insurance, or DI, Trust Fund—and then used to cover benefits and administrative expenses. Combined, the two trust funds are often referred to as the OASDI trust funds.
Social Security’s benefit levels are modest, and the program’s benefit structure is progressive, meaning that benefits replace a greater share of wages for lower-income workers than for higher-income workers. For a middle-income worker reaching retirement age in 2015, Social Security can be expected to replace about 40 percent of career-average earnings.
The amount of a worker’s annual earnings subject to payroll taxes is capped at a level referred to as the “maximum taxable wage base.” In 2015, payroll taxes are assessed on the first $118,500 of an individual’s earnings. The cap amount is tied to average wage growth from year to year. Specifically, the SSA determines the maximum taxable earnings each year using the National Average Wage Index, or AWI.
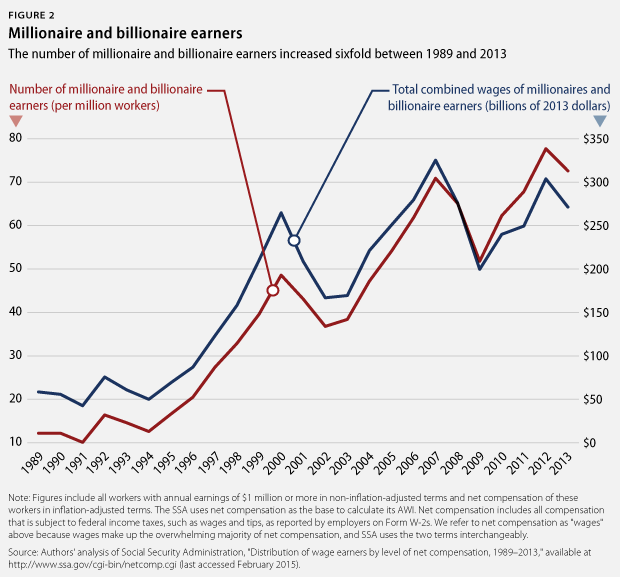
The wages that escape taxation—in 2015, all wage earnings past $118,500—accrue to high earners and increasingly, in a world of rising income inequality, to very high earners. For example, the number of millionaire and billionaire earners—all of whom will have finished paying Social Security taxes on their wages by February 12—has grown sixfold over the past two and a half decades.
In years in which payroll tax revenues exceed benefits paid, the excess funds have been invested in interest-bearing U.S. Treasury securities. This practice was introduced following the recommendation of the National Commission on Social Security Reform—convened by former President Ronald Reagan in 1983 and commonly referred to as the Greenspan Commission—in order to offset some of the anticipated funding shortfall when the Baby Boomer generation reached retirement age.
Each year, the SSA releases the “Annual Report of the Board of Trustees of the Federal Old-Age and Survivors Insurance and Federal Disability Insurance Trust Funds,” which documents the program’s fiscal outlook over a 75-year planning period. In 2014, the trustees projected that without congressional action, the combined trust funds would exhaust their reserves in 2033. The depletion of the trust funds will be largely due to the aging of the population as Baby Boomers continue to retire. After 2033, the trustees anticipate that Social Security will be able to pay 75 percent of scheduled benefits using continuing tax revenues.
Rising income inequality poses a direct threat to Social Security’s financial health. By virtue of the capped payroll tax, Social Security’s funding is directly tied to the full wages that low- and middle-income workers earn—but not to the full wages that higher-earning workers receive. Upward redistribution of income in the United States has meant that income has shifted away from workers whose full earnings are taxed and toward high-income workers whose additional dollars are exempt. At the same time, low-income workers whose wages remain stagnant contribute less in payroll taxes than they would if their wages were rising, while their benefits rise faster than their payroll tax revenue due to the progressive structure of Social Security’s benefits formula.
Recent trends in income inequality have contributed to the challenges in Social Security’s financing for three primary reasons:
- Productivity has been rising faster than wages. Between 1948 and 1973, positive trends in employment compensation mirrored those in worker productivity. In 1973, however, the two trend lines began to diverge slightly. This divergence became more pronounced during the information technology revolution of the 1990s, when productivity growth began to accelerate faster than wage growth. In the years since, productivity has continued to rise, but the majority of American workers have seen their incomes stagnate or even decline.
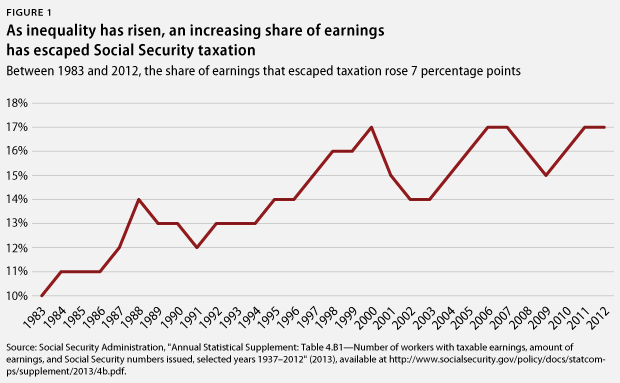
- More earnings are concentrated above the cap on taxable earnings. The cap on taxable earnings is adjusted each year according to average wage growth. In recent decades, wage growth for top earners has far outpaced wage growth for the majority of workers. Consequently, an increasing share of total earnings has escaped the payroll tax in each year after 1983. In the three subsequent decades, the share of covered earnings subject to the payroll tax has decreased from 90 percent to 83 percent.
- Earnings below the cap are becoming more unequal. Because low-wage workers have seen even fewer wage gains than middle-income workers, the earnings distribution below the cap has become more unequal. As noted above, Social Security benefits replace a greater share of wages for lower-income workers than for higher-income workers. Rising earnings inequality below the cap has meant faster benefit growth relative to payroll tax revenue than would have been the case with stable earnings inequality, increasing the pressure on the trust funds.
In the following section, we conduct two separate simulations to estimate the effects of the first two trends in income inequality—rapid growth in income above the cap and average wage growth lagging behind increases in productivity below the cap—on Social Security’s financial outlook. We cannot model the impact of rising earnings inequality below the cap on Social Security’s finances and therefore only focus on the first two trends for the purposes of this issue brief.
Methodology and analysis
Simulation 1: What if wages had grown at the same long-term rate as productivity?
Between 1983 and 2013, workers’ productivity—measured in terms of inflation-adjusted output per hour—rose faster than inflation-adjusted wages. If the long-term trend in wages had matched this trend in productivity, wage growth would have been approximately 0.34 percentage points greater during each year. Assuming that this faster wage growth was experienced by all earners across the wage distribution, leaving the wage distribution otherwise unaffected,payroll tax revenues to the combined Social Security trust funds would have been greater by this factor in each year as well.
In this simulation, we also model benefit changes. Social Security benefits are linked to earnings; earnings are averaged over a number of years and decades, depending on the type of benefit. If wages during individuals’ working lives had risen faster than they actually did, these individuals’ benefits would have increased as well. Benefits reflect an average of past wages rather than any single year’s wages, and people work for some time before they receive any Social Security benefits. Accordingly, we create a five-year moving average of past tax payments, which we then relate to existing benefit payments. We phase in the full benefit impact from higher wages over a period of 40 years.
Specifically, we calculate the average ratio of new—hypothetical—tax revenues to old—actual—tax revenues over the five years leading up to and including the current year. We then multiply this average ratio of new tax revenues with the old benefits in the current year. This calculation assumes that the new wages have the same lifetime distribution as the old wages and that the replacement rate of benefits to lifetime earnings is unaffected by the additional wage growth.
Next, we assume that these full benefits will be phased in over the subsequent 40 years, at an effective rate of 2.5 percent per year. Using the Social Security Administration’s projections as a guide,we assume that there will be no increase in benefits paid as a result of the higher wages for the first five years, reflecting the fact that it takes some years of tax payments before an individual becomes eligible for benefits.
We then use our hypothetical tax revenue and benefit-payment calculations to compute a hypothetical balance for the combined trust funds. We add the difference between tax revenue and benefit payments to the trust funds and let the difference grow at the historical compounded interest rate earned on the trust funds. Between 1983 and 2013, additional assets in the combined trust funds resulting from faster wage growth would have totaled $753.8 billion. The Old Age and Survivors Insurance Trust Fund and the Disability Insurance Trust Fund have an expected shortfall of $11.1 trillion in present-value terms over the next 75 years. We find that if wages had grown at the long-term rate of productivity, the increase in net assets would have reduced the trust funds’ shortfall by about 6.8 percent.
Simulation 2: What if 90 percent of covered earnings had remained subject to payroll taxes since 1983?
At the time of the last major Social Security reform in 1983, Social Security received revenues from payroll taxes imposed on 90 percent of all earnings from workers covered by Social Security. In that year, the cap on taxable earnings was $35,700, or about $80,000 in inflation-adjusted terms.* In 2015, this cap is $118,500. The cap, as noted above, is presently tied to average wage growth. Due to this structure, an ever-larger share of total wages has escaped taxation since 1983 as earnings inequality has increased and as high earners have continued to pull away from average earners. Consequently, payroll tax revenues have grown more slowly than expected over the past several decades.
If the taxable wage base had instead remained fixed at 90 percent of covered earnings, payroll tax revenues would have been greater in every year since 1983. In 2013 alone, payroll tax revenue would have been greater by $63.4 billion. We can similarly compute the additional revenue that would have been collected in each year back to 1983 if 90 percent of covered earnings had been taxed.
This scenario would have led not only to greater revenues but also to greater benefits payments over time. We capture changes in Social Security’s benefits using a method equivalent to the one described above—modeling the level of benefits and the phase-in period—with one exception: We now need to account for the fact that all new contributions come from high earners—those whose earnings are close to the maximum taxable wage. Due to Social Security’s progressive benefit formula, these earners can expect to receive a lower replacement ratio of their benefits to their lifetime earnings than average earners. We assume that additional benefit payments would be made to individuals who are already past the so-called 15 percent bend point. For each additional dollar of annual wages on which payroll taxes are assessed, these individuals’ annual retirement benefits will increase by only 15 cents. In comparison, we assume that Social Security benefits for earnings below the cap are equal to 40 percent of lifetime earnings.
We again calculate the average ratio of new tax revenues to old tax revenues over five years, up to and including the current year. We then multiply this average by the actual benefit payment in the current year. We refer to the resulting figure as the benefit base. To account for the fact that new benefits go to high-income earners, we assume a replacement rate of 15 percent relative to the average earner’s 40 percent and thus multiply the benefit base by 0.375, which is equal to 15 percent divided by 40 percent. As in the first simulation, we assume that these benefit payments phase in over a 40-year period.
Applying historical interest rates to additional revenues—net of additional benefit payments—in each year after 1983, we compute the total increase in combined trust fund assets over the period from 1983 to 2013. Had 90 percent of covered wages been taxed from 1983 to 2013, the OASDI trust funds would have been $1.1 trillion larger by 2013, shrinking the 75-year expected shortfall by 10.1 percent.
The simulation that we have modeled is retrospective; it addresses what would have happened had 90 percent of wages been taxed since 1983. In their annual report, the Social Security trustees answer a similar, but prospective, question: How would raising the cap to cover 90 percent of earnings starting in 2015 affect the trust funds’ shortfall? The trustees find that over the 75-year period, this change would close about 27 percent of the expected shortfall in the trust funds.
Conclusion
Our analysis demonstrates that the rise in earnings inequality, which has led to an upward redistribution of income, has taken a significant toll on our nation’s Social Security system. If wage increases had kept pace with workers’ productivity gains over the past three decades, the OASDI trust funds would be $753.8 billion larger today, which would have reduced the expected 75-year shortfall by 6.8 percent.** If policymakers had acted to freeze the cap on taxable earnings at 90 percent of covered wages after 1983, the trust funds would be $1.1 trillion larger today, and the shortfall would be smaller by 10.1 percent. Looking ahead, that one action would on its own close more than one-quarter of the projected 75-year shortfall. While policymakers cannot undo the past, they can take action to improve Social Security’s fiscal outlook by implementing policies that boost wages, combat rising inequality, and modernize the program’s revenue structure to reflect today’s economy.
Rebecca Vallas is the Director of Policy for the Poverty to Prosperity Program at the Center for American Progress. Christian E. Weller is a Senior Fellow at the Center and a professor of public policy at the University of Massachusetts Boston. Rachel West is a Senior Policy Analyst with the Poverty to Prosperity Program at the Center. Jackie Odum is a Research Assistant for Economic Policy at the Center.
The authors wish to thank Marc Jarsulic, Keith Miller, and Harry Stein for helpful comments on an earlier draft.
* Correction, February 10, 2015: This issue brief incorrectly stated the cap on taxable earnings in 1983. The actual cap was $35,700.
** Correction, February 11, 2015: The conclusion of this issue brief incorrectly stated the increase in the OASDI trust funds if wage increases had kept pace with workers’ productivity gains over the past three decades. The actual figure is $753.8 billion.