Introduction and summary
The first-day-at-a-new-school jitters are real. Student mobility—especially changing schools midyear or outside of common promotions, for example, from elementary to middle school—is a challenge for all involved. It affects schools, families, and, particularly, the student. Making new friends, connecting with new teachers, filling in gaps when curricula aren’t perfectly aligned, and being assessed to receive necessary interventions and supports can all contribute to the challenges students face when switching schools. Moreover, the stresses related to those challenges can occur on top of the stress a student may be dealing with outside of school. In fact, some of those external stresses—such as job losses in a family; eviction, housing insecurity, or homelessness; academic or behavioral problems at a prior school; and parental separation or divorce—could have led to the school change in the first place.
Backfilling seats—allowing new students to enroll in a school in the middle of the year when there are available seats—is common practice for school districts. However, many charter schools are not bound by the same backfill rules as their traditional public school counterparts and can opt not to accept new students midyear. In communities where charters make up a significant portion of the public school system, this could create challenges if all schools see similar numbers of student departures, but only some schools fill those empty seats. Midyear school changes are associated with negative effects for the students who switch schools and their new classmates. As a result, backfill should only be limited in individual schools that have strong programmatic reasons for doing so such as not accepting nonspeakers into the upper grades of language immersion programs.
Effects of student mobility
Given the aforementioned factors surrounding student mobility, it is unsurprising that many studies have shown the negative effects on mobile students’ success in school. Research from Baltimore and Chicago showed an estimated “reduction in achievement test scores of approximately one-tenth of a standard deviation for each move a child makes, after other factors are accounted for.”1 In the Baltimore study, this would mean the equivalent of scoring 5.62 points lower on a standardized reading test or 2.62 points lower on the math test with each move.2 A meta-analysis from 2009 showed that each additional move increased the mean rate of school dropout by 8.4 percentage points.3 Many of these studies also find that students from families with low incomes as well as Black and Latinx students are more likely to attend schools with high mobility rates and are more negatively affected by mobility.4
Not all studies have shown negative effects from mobility, but according to a National Education Policy Center report, among those showing mixed effects, “there were more consistent findings that students who made three or more non-promotional moves were more likely to experience negative effects.”5 A 2009 workshop hosted by the National Research Council and Institute of Medicine of the National Academies of Sciences, Engineering, and Medicine to review research on student mobility identified patterns in the research, including findings indicating that moves within the same school district and that take place during the school year are associated with more negative effects than other types of moves.6
It is not just the student changing schools who can be effected by this mobility. Teachers invest time and energy to develop classroom norms and routines and build positive relationships with students at the beginning of a school year. Introducing new students to the mix later in the school year is bound to create challenges for everyone involved. A study from Texas highlighted that student turnover, and particularly students entering schools during the school year, negatively affected student achievement throughout the entire school, with the largest negative effects for students from families with low incomes and Black and Latinx students.7 Another study from Boston that examined student mobility linked to residential moves also found that a higher level of mobility “imposes negative achievement externalities on students.”8
The challenge of developing equitable backfill policies
Given the challenges that student mobility can pose for all students, it is important that policymakers consider opportunities to reduce student mobility and handle mobility equitably across schools. Federal law has long recognized the need to maintain stability for homeless students,9 and the recent Every Student Succeeds Act (ESSA) created guidance and regulations to do the same for students in foster care. Before enrollment changes are finalized, districts should consider policies such as counseling opportunities, transportation commitments, and connections to social services to help students at risk of instability for reasons other than those that federal regulations cover.
Given the range of reasons parents may have for changing their child’s school, even the best policies will not eliminate student mobility. That means policy questions about how to handle these cases will persist. For instance: Does every school have to accept students in every grade? Do schools have to accept students midyear to backfill open seats? Who is responsible and accountable for students’ performance when they change schools?
While this report focuses on the first two backfill-related questions, ESSA includes a provision related to the third question. Specifically, if a student has not attended their current school for at least half the year, their scores are not used in the school’s accountability determination. The student’s data are included in state and local educational agency report cards, but they do not affect the school’s accountability determinations.10
Many communities include a wide variety of types of public schools—neighborhood-zoned schools, open enrollment schools with no fixed enrollment zones, and magnet schools, all with admissions criteria managed by public school districts—in addition to independently managed public charter schools. These different types of schools with unique missions, admissions requirements, and governance structures make coherent and equitable policies around backfill complicated to develop and implement. Part of the construct of charter school laws is that the schools are granted autonomy from many rules and regulations in return for accountability to meet the performance standards and other terms of their charter. And that autonomy usually includes the decision of whether or not to backfill open seats when students leave during the year or when open seats become available outside of traditional entry grades (e.g. open seats in third grade at a K-5 school). Public school districts are required to accept new students no matter when they enroll or switch schools, but the district may decide that those transfers and new students do not have to be placed in every district school. Open enrollment schools—for example, a Montessori program with no attendance zone—and district-run magnet programs may not have the same requirements to backfill vacancies as neighborhood-zoned schools even though they all are managed by the same school districts.
Charter schools and backfill
This report is focused on backfill policies in charter schools in part because the authors recognize the need for more good seats for students in all public schools and believe that if successful charter schools have open seats, they should fill them. In addition, it is important for policymakers and advocates supporting charter schools to consider—and, when reasonable and appropriate, address—critiques of the charter sector. Inconsistent practices and policies around backfill have raised questions about equity across school sectors and the comparability of data within and across those sectors.
Debates about backfill policies in charter schools have frequently arisen over the years and can even divide proponents and operators of charter schools. A 2015 report from Democracy Builders, an advocacy organization in New York City launched by the founder of Democracy Prep charter schools, estimated at the time that there were at least 2,500 empty seats in third through eighth grade in the city’s charter schools that were not backfilled. Seth Andrew, founder of Democracy Prep and Democracy Builders, argued that “all charters have a ‘moral obligation’ to backfill seats in order to fulfill their ostensible goals of serving New York’s neediest children.”11
On the other side are arguments that charters’ autonomy is a powerful contributor to their success and something that should be protected—even if that means they decide not to backfill. Proponents of this idea argue that if successful charters devote significant time to building strong cultures and advancing students rapidly, those schools should not be forced to introduce and remediate new students every year and risk their success with current students.12 However, these claims do not take into account that district schools may also emphasize culture-building and rapid advancement. Those who are more critical of charter schools highlight that a “one-way” path of mobility out of charter schools would lead to a student body that “will have fewer students living in poverty, fewer high needs students, and fewer students who score more poorly on standardized exams.”13 These critiques of charter schools’ backfill policies are often part of a wider assertion that charter schools “cream-skim” or “cherry-pick” students by putting up hurdles to enrollment or pushing out students who are struggling or more difficult to serve.14 These claims are contentious, however, as other research finds “very little evidence of systematic ‘cream-skimming’ or ‘push-out’ in US charter schools.”15
Only four states with charter school laws—Connecticut, Georgia, Idaho, and Massachusetts—have implemented policies that place guidelines on charter schools requiring them to backfill some vacancies.16 In Massachusetts, for example, charters are required to backfill vacancies through February 15th during the school year, and if vacancies occur after that point, the school is required to fill those seats when the next school year begins. These requirements must be followed in at least the first half of grades served by the school—for example, in kindergarten through second grade in a K-5 school. The state encourages schools to go beyond these minimum requirements and may make that a condition of requests to amend charters such as for expansion requests.17
In New Orleans, where nearly all students are enrolled in charter schools, charter schools’ autonomy to set their own backfill policies would run headfirst into the challenge that charters essentially are the system. New and transferring students must be able to enroll in a school somewhere in the city both during the year and outside of traditional entry grades. In order to address these challenges, the district, which is the charter authorizer, requires all schools to maintain cohort sizes across grade levels and fill seats as they become open throughout the year.18 The district also maintains a centralized process to oversee enrollment, and all charter schools participate or will participate in the unified enrollment system. This includes a lottery to allocate seats at the beginning of the school year and processes to handle new students and requested transfers during the school year. There is one process to handle requested transfers early in the year and a separate process to consider hardship transfer requests after October 1. Schools are required to accept transferring students if they have a seat available in the student’s grade.19
In 2016, the National Alliance for Public Charter Schools published a policy brief to examine the backfill issue examining the arguments surrounding backfill policies. The brief concluded with a series of recommendations to address concerns about backfill in charter schools, including:
- Gather data on enrollment trends such as beginning- and end-of-year enrollment to understand what backfill policies are in place
- Require transparency of enrollment data at multiple points throughout the year, which could create pressure on charters to backfill
- Create financial incentives to backfill by funding schools based on actual enrollment at multiple points throughout the year 20
Charters and backfill in Washington, D.C.
While comprehensive data on how charters, magnets, and other district schools of choice handle backfill decisions are not readily available in many places, Washington, D.C.’s state educational agency overseeing both the District of Columbia Public Schools (DCPS) and the city’s charter schools, the Office of the State Superintendent of Education (OSSE), publishes detailed data that include information such as enrollment by grade, achievement data on assessments, student growth measures, attendance, and cumulative student mobility data by month for every school in the city.21 DCPS and charter schools have cooperated with the OSSE to publish this mobility data for a number of years, which enabled the authors to analyze the differences between DCPS schools and charter schools in student mobility—both exits from a particular school and entry or backfill into that school—throughout the year. The analysis excluded both DCPS and charter schools in the OSSE’s data that were labeled as “alternative” so that their high student mobility would not distort the data for other schools. The authors are not aware of other state or local educational agencies publishing similar data to enable comparisons across schools and sectors.
There are approximately 93,000 students enrolled in Washington, D.C.’s public schools, with 47 percent of students, or just less than 44,000 students, attending the city’s charter schools and approximately 49,000 attending DCPS schools.22 Most funding in Washington, D.C., is allocated to DCPS and charter schools through the Uniform Per Student Funding Formula (USPFF) and is based on an enrollment count that occurs every October.23 That enrollment count is subsequently audited but is not adjusted further if enrollment changes after October.24 This means that neither DCPS’ nor charters’ funding will be reduced if departing students are not backfilled during the year and that funding will not increase if additional students are enrolled during the year.
A 2015 Washington Post report about enrollment and backfill policies in Washington, D.C., charter schools stated that 85 percent of charters accepted applications for enrollment in all grades the previous year, but many charter operators such as KIPP DC opted to backfill “in the least-disruptive way possible” by enrolling students only at the beginning of the school year.25 Using the OSSE’s data, the authors were able to explore these claims, along with other backfill activity in D.C. schools, in more detail.
Comparison of exit rates
In the OSSE’s data, any student who withdraws from a school at any point after the annual enrollment audit count day counts as an exit, and the exit rate is equal to the number of exits divided by the number of enrolled students on the count day.26 The mean cumulative exit rate by May for all nonalternative schools in the city was 5.3 percent, meaning that by the end of the school year schools averaged just more than 1 in 20 students transfering out at some point. The average exit rate for DCPS schools was 6.06 percent, while the average exit rate for charter schools was 4.53 percent. This difference was statistically significant at the 0.01 level. (see Figure 1)
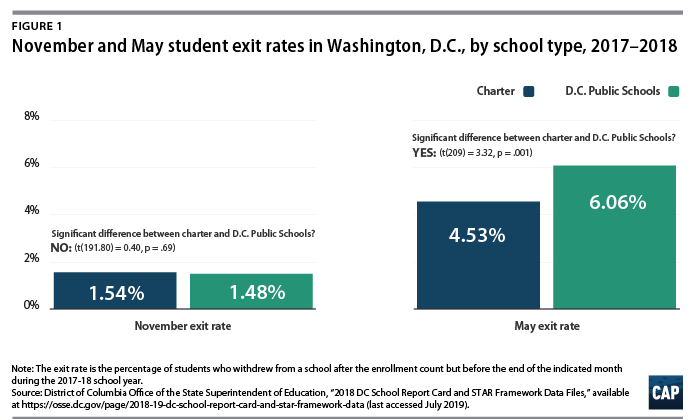
The average exit rates through November in DCPS schools (1.48 percent) and charters (1.54 percent) are not statistically different from each other, suggesting that there is not evidence that charter schools are systematically pushing students out of their schools and seeing higher exit rates than DCPS schools after the enrollment count date in October. The lower cumulative May exit rate for charter schools compared with DCPS schools is further suggestive evidence that D.C.’s charter schools are not more likely to push students out of schools than DCPS schools.
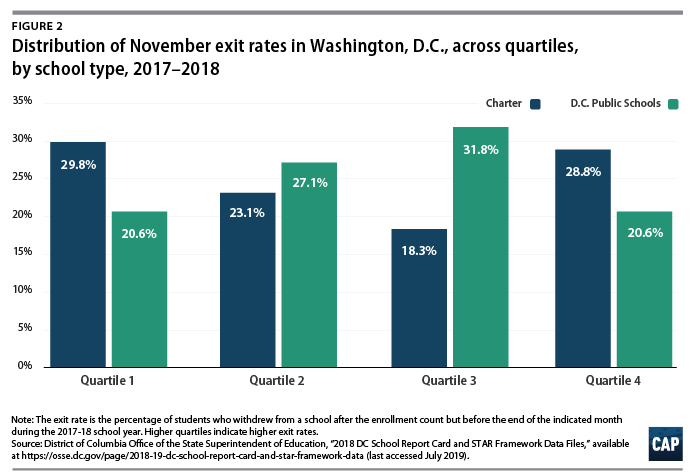
In order to see if the statistically equivalent mean exit rates masked variation within each sector, the authors split all November exit rates into quartiles and then examined the distribution of DCPS schools versus charter schools within those quartiles. The distribution of November exit rates for charter schools shows that there is substantial variation in the November exit rates among charter schools. There is a large number of charter schools among the quartile with the fewest exits, but also a large number in the quartile with the highest exit rates. This may be worthy of additional analysis from the charter authorizer to understand if this is random variation or if any individual charter schools are encouraging student exits after the October enrollment count.
Comparison of entry rates
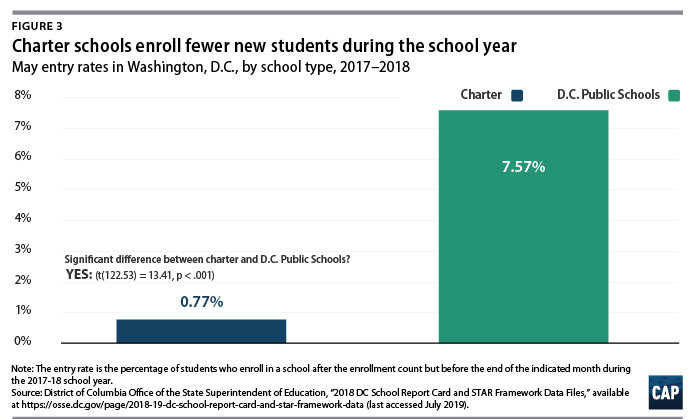
In the OSSE’s data, any student who enrolls in a school at any point after the annual enrollment audit count day is considered an entry, and the entry rate is equal to the number of entries divided by the number of enrolled students on the count day.27 The mean entry rate through May for all nonalternative schools in the city was 4.2 percent, meaning that by the end of the school year schools averaged adding slightly more than 1 in 25 students. The average entry rate for DCPS schools was 7.57 percent, which was much higher than the 0.77 percent rate for charter schools and statistically significant at the .001 level. In other words, a DCPS school with 500 students added an average of 38 students over the course of the school year, while a charter school of the same size would have added an average of only four students. These differences suggest that despite having exit rates similar to those of DCPS schools, few charter schools are opting to accept students and backfill vacancies during the school year.
Analysis of DCPS schools without enrollment boundaries
The authors also separately examined exit and entry rates at DCPS citywide elementary and middle schools with no enrollment boundaries as well as the selective enrollment high schools. As seen in Table 1, these schools had average May exit rates of 3.17 percent, a figure lower than the average May exit rates at both charter schools and DCPS schools as a whole, meaning relatively few students transferred out of these programs. The average May entry rate for these schools was 1.56 percent, however, suggesting that these schools behave more like the city’s charter schools than DCPS schools overall when it comes to backfilling vacant seats.

Analysis of charter school enrollment in nontraditional entry grades
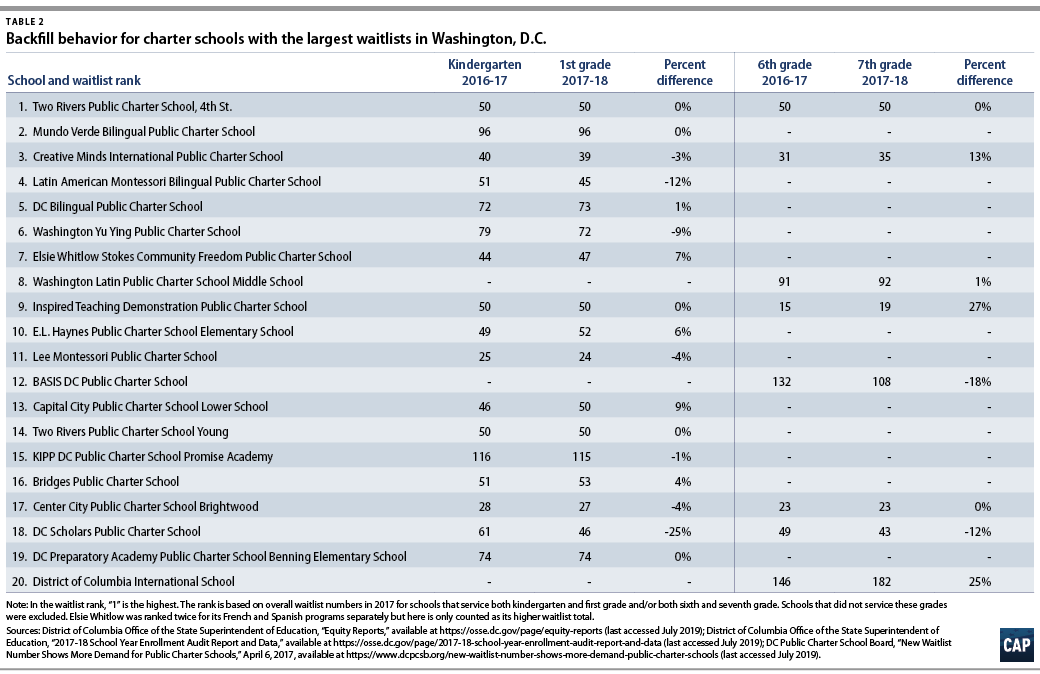
In addition to exploring student transfer patterns throughout the year, the authors were interested in finding evidence to support the 2015 assertion that most D.C. charter schools backfill available seats at the beginning of the school year in nontraditional entry grades—that is to say, for grades that are not the first grade served in the school. Because accepting applications during the lottery does not necessarily mean that schools admit and enroll new students, the authors examined the difference in enrollment numbers between kindergarten in the 2016-17 school year and first grade in the 2017-18 school year as well as between sixth and seventh grade for the same time periods.
Given that decreases in enrollment could be the result of not backfilling vacancies or a lack of demand for vacant seats, the authors’ analysis focused on schools with long waitlists where seats in nontraditional entry grades were most likely to be in demand. As can be seen in Table 2 below, across the 20 charter elementary and middle schools with the largest waitlists, two-thirds of the kindergarten classes stayed the same size or gained students as they moved into first grade. The same was true of the sixth grade classes; only two of these charter schools lost any students in the transition into seventh grade. This suggests that most of the schools with significant waitlists were either not seeing student exits or were willing to backfill vacancies at the beginning of nontraditional entry grades.
Recommendations
This report’s analysis of student exit and entry data from Washington, D.C., suggests that the city’s charter schools are not seeing students exit at higher rates than the traditional school district, but they are backfilling vacancies midyear at much lower rates. These findings may not apply to other communities, but the recommendations below would enable policymakers to reduce mobility when possible, better understand policies and practices around mobility, and encourage equitable approaches to backfill across all public schools.
- Policymakers should work to reduce situations where midyear school transfers occur by maximizing coordination between school districts, charter authorizers and schools, and other social service agencies to support families. States should encourage the development of coordinated systems such as the one in New Orleans to centrally manage enrollment processes and include elements such as transportation support; pretransfer counseling to identify and mitigate challenges in current schools; and connecting families with available social services to prevent eviction or homelessness.
- States should create funding models that include incentives to backfill by funding based on enrollment at multiple points throughout the school year. Many states use mechanisms such as multiple count dates throughout the year or average daily membership to allocate funding to school districts and charter schools. These can capture midyear enrollment changes and create an incentive to backfill to maintain funding. Charters could even be allowed to marginally increase their enrollment midyear if they choose to accept new or transferring students before any corresponding exits occur at their own schools.
- States should require transparency from school districts, charter authorizers, and charter schools about what each school’s policies are for accepting students during the school year as well as after initial grades of entry for the school. States should also make school-level student mobility data publicly available so that advocates, charter authorizers, school districts, and schools can better understand and respond to which schools are adding or losing students throughout the year.
- States, especially those with large charter school sectors, should consider policies similar to Massachusetts’ that require charter schools to backfill during the year and in multiple grades throughout their grade spans. These policies should include only limited programmatic exceptions. There should be flexibility for specialized charters such as language immersion programs not to accept beginning students in later years, but most programs should backfill.
Conclusion
Student mobility is a challenge for students, families, and schools, with research suggesting that midyear transfers within the same school system are most likely to be associated with negative outcomes for children. As charter schools have grown to educate significant portions of students in many communities, it is important to consider issues of student mobility and backfill in an equitable manner—so that mobile students have access to good seats in both district and charter schools and so that policymakers do not create advantages for one sector over another.
About the authors
Neil Campbell is the director of innovation for K-12 Education at the Center. He was a special assistant and, later, a chief of staff in the Office of Planning, Evaluation and Policy Development at the U.S. Department of Education. Campbell previously worked at Education Elements and the Boston Consulting Group. He earned a bachelor’s degree in economics and political science from Case Western Reserve University and a master’s in business administration from Vanderbilt University.
Abby Quirk is a research associate for K-12 Education at the Center. She previously worked as a research coordinator at the University of Pennsylvania and helped to connect innovative schools with leading scientists through the Character Lab Research Network. Quirk received her bachelor’s degree in psychology with minors in education and religious studies from Hamilton College, and also holds a master’s degree in education policy from the University of Pennsylvania.
Acknowledgments
The authors wish to acknowledge several people who helped with this report. Scott Sargrad, vice president for K-12 Education at the Center, and Khalilah Harris, managing director for K-12 Education at the Center, provided valuable feedback throughout the process. Jessica Yin, research assistant for K-12 Education at the Center, reviewed the data analysis. Scott Pearson from the District of Columbia Public Charter School Board, Alden Toiv from District of Columbia Public Schools, Thomas Lambert from the Orleans Parish School Board, and Lee DeLorenzo from the Massachusetts Department of Elementary and Secondary Education provided feedback on draft sections of the report. Any errors or omissions are the authors alone.