Introduction and summary
In the past four decades, the United States has undergone significant demographic changes.1 Immigration patterns have altered our racial composition, medical advances have aged our population by prolonging our lives, and economic forces have driven us to educate ourselves at unprecedented levels. Transformations of this magnitude will shape this century’s social and political landscape as well as test many of society’s institutions.
Among these tests, perhaps the most important will be representational in nature. To represent people, as Hanna Pitkin was wont to point out, is to make them present again. It is injecting the people’s voices and perspectives into our public policy process. It is speaking and advocating for their interests. It is the countless symbolic and substantive acts that contribute toward their inclusion in society.
Historically, our political institutions have struggled to represent a society that is demographically different than its electorate. The systematic disenfranchisement of women and communities of color, for example, contributed to a public policy process that ignored and underserved large portions of the population. Functionally, they created what we will refer to as representation gaps—the difference between the percentage of voters who belong to a given group and the percentage of the whole population that belong to that same group. While an electorate that resembles the general population is no guarantee of a representative polity, we believe it creates conditions favorable to one.
Representational gaps such as these persist in modern America politics. They are obviously different in size and arise as the result of different processes, but the problems they induce are similar. Given their continued existence, the goal of this report is as follows:
- Document the representation gaps we have observed along age, education, gender, and race lines over the last several decades.
- Predict what those gaps might look like going into the future using the best available demographic projections and turnout data.
- Facilitate a conversation about the representational challenges the United States is likely to face in the coming decades and what solutions might work best to confront them.
Our analysis finds the white overrepresentation and minority underrepresentation has been a defining feature of American politics for decades. In fact, we may currently be at peak levels of both overrepresentation and underrepresentation. We also find that white overrepresentation is likely to decline in the future, as underrepresentation of Latinos and Asians declines significantly due to projected increases in citizenship among these groups. This trend will be especially noticeable in states that currently have the highest white representation gaps, such as Arizona, California, and Texas. By 2060, we expect the states with the highest white representation gaps to be interior states, such as Kansas, Utah, and Wyoming.
Note: For full set of figures, please see PDF.
However, while representation gaps will likely decline in future decades, they will by no means be eliminated. Significant white overrepresentation and Latino and Asian/other underrepresentation will likely remain, primarily because of participation gaps reflecting the relatively low registration and turnout rates of the latter groups. Simulations indicate that the most successful route for minimizing future representation gaps lies in equalizing registration and turnout rates across races, perhaps due to some combination of registration reform and changes in mobilization practices. Progress in this direction would leave only a small representation gap due to the younger age structure among Latinos and Asians/others. It would also tend to equalize representation gaps across presidential and congressional elections in contrast to the current situation where gaps in congressional representation are much larger.
The contours of demographic change, 1980–2060
We will begin by reviewing the basic demographic landscape of the American population and how it is likely to change in the coming decades. The vast majority of early American immigrants were of European descent. This resulted in a 20th century populace that was mostly white—about 80 percent of the whole population in 1980.
However, newer immigrants have been coming from different places—mainly Asia and Central and South America. In addition, we have seen rates of interracial marriage increase, going from about 7 percent of all new marriages in 1980 to 15 percent in 2010.2 These concurrent and interrelated trends have resulted in a modern U.S. population that is significantly more diverse, with about 61 percent identifying as white3. If current trends persist, this number will fall below 50 percent sometime in the mid-2040s, and by 2060, we project that white Americans will constitute less than 44 percent of the population.
This 36-point drop over 80 years has been and will mainly be the result of growing Hispanic and Asian/other4 racial communities, each growing about 22.5 points and 12.5 points, respectively. African Americans5 have held and will largely hold steady, growing only 1 point over this time period.
An important feature of these racial changes is that they have not and will not be evenly distributed—places and age groups are shifting at different rates. Looking at Figure 1, we can see that states along the coasts and the southern border have diversified at a much faster pace, with New Mexico, California, and Texas becoming so-called majority-minority states between 1980 and 2016. In contrast, the Midwest, Plains, Rocky Mountain, and upper New England states generally started off less diverse and shifted more slowly. As we go forward, this same general geographic patterns holds, with 18 more states becoming majority-minority over the next 44 years.
The nation’s diversification can also be described as bottom-up, with younger cohorts changing at a faster rate than older age groups. Those age groups below 30 will become more than 50 percent nonwhite in the 2020s, 30- to 44-year-olds joining them in the mid-2030s, and 45- to 64-years-olds flipping in late 2040s.
Accompanying this racial diversification has been the aging of the population. As shown in Figure 3, the two age groups that compose those younger than 30 both drop as a percentage of the whole population dramatically between 1980 and 2060—15 points collectively. Over this same time period, we see the oldest age groups increase in size as life-expectancy gains trickle up and the large Baby Boom generation ages. Those aged 45 to 64 and 65 and up go from 20 percent to 24 percent and 11 percent to 23 percent of the whole population, respectively.
Finally, we have also the seen the U.S. population become more educated. From 1980 to 2014, the percent of the voting age population with a college degree has roughly doubled—going from 15 percent to 30 percent—with two-thirds of that growth coming from an increase in the number of college-educated whites.
Among whites, this has coincided with an incredible 25-point decline in adult noncollege whites among the voting age population, going from 69 percent to 44 percent. The black noncollege population has also shrunk but only by less than a point. On the other hand, noncollege Hispanics and Asians/others have actually increased as a percentage of the overall voting age population—8 points and 3 points, respectively. This is happening despite rising educational levels among all races because these groups are, more generally, growing quickly.
Representation gaps by race, gender, age, and education, 1980–2060
Taken together, these trends constitute a level of change that can only be described as transformative. In some ways, we are just beginning to come to grips with the ways these changes have already altered our society—and many of the largest changes are yet to come. There is no doubt that they will challenge the country’s policies, institutions, and people.
Among these challenges, perhaps the most important will be representational in nature. How well have different groups in the United States been represented in the electorate, and how will that change going into the future?
To tackle these questions, we rely on what we refer to as total representation gaps—a measure that captures the level of overrepresentation or underrepresentation experienced by a demographic group in the electorate. Functionally, it is calculated by taking the difference between the percent of the whole population that belongs to a given group and the percent of voters who belong to that group. Positive values indicate overrepresentation among voters while negative values indicate underrepresentation.6
Race gaps
White overrepresentation has been one of the defining features of American politics over the past several decades. With the exception of blacks in the 2012 election, communities of color have been consistently underrepresented in the electorate. Beginning in 1980, the levels of underrepresentation we witnessed among these groups were driven in roughly equal measure by the older age distribution, higher citizenship rate, and higher political engagement levels of whites. In the past three decades, the immigration-based growth of the Hispanic, Asian, and other race populations has lowered the citizenship rates of these groups and increased the overrepresentation of whites in the electorate. As we move forward into the future, we can expect some of this white overrepresentation and Hispanic underrepresentation to taper off. As growth from Hispanics, Asians, and those of other races comes increasingly from native births, political participation deficits in the form of registration and turnout gaps will come to be the key drivers of underrepresentation between racial groups.
Here is how these broad trends will evolve. Start with how well different racial groups—whites, blacks, Hispanics, and Asians/others—have been represented in the electorate. As we can see in Figure 4, whites have been consistently overrepresented among voters in both presidential and midterm elections for past 36 years. Even as their share of the population has declined, their overrepresentation has actually increased, going from a 7-point gap in the 1980 and 1982 elections to a 10- and 14-point gap in 2012 and 2014. This is notable because we generally expect representation gaps to grow as a population grows and to shrink as a population shrinks.
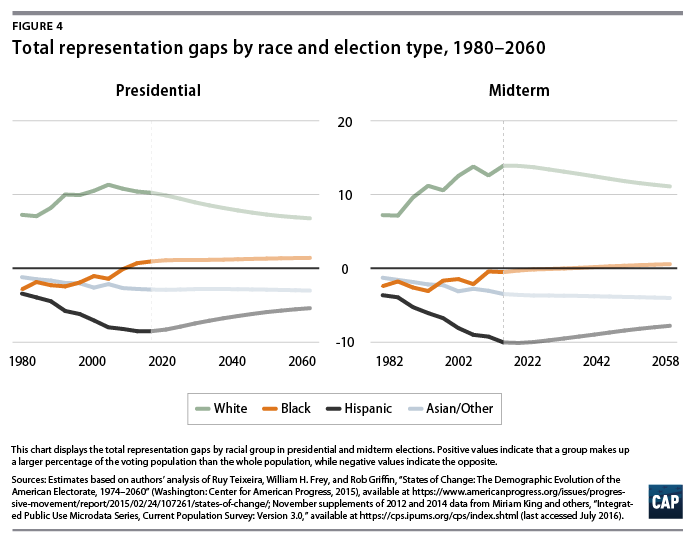
The steady overrepresentation of whites during these years was mirrored by the underrepresentation of communities of color. For blacks, the underrepresentation gaps in presidential and midterm elections hovered around -2 points between 1980 and 1994. However, after 1996, these gaps began to shrink, especially for presidential elections. During the election and re-election of America’s first black president, Barack Obama, we saw underrepresentation reduced to essentially zero in 2008 and actually flip to a slight overrepresentation in 2012. There’s been a similar movement in the past two midterm elections, where we saw black representation gaps move above -1 for the very first time.
In contrast to whites and blacks, Hispanics’ representational fortunes have moved in the opposite direction. In 1980 and 1982, there were representation gaps of -3 and -4 points, respectively; by 2012 and 2014, these gaps had grown to -8 and -10 points. This makes Hispanics the racial group that is most underrepresented as well as the group that has seen the largest increase in their underrepresentation over time.
A similar pattern of underrepresentation has occurred for Asians and those of other races. There has been an increase in the level of underrepresentation, going from about -1 point in 1980 and 1982 to just about -3 points in 2012 and 2014.
Using the data created in the first two years of the States of Change project, we can also project these gaps forward into the future, indicated in Figure 4 by the dotted lines going out to 2060. These projections assume that the underlying demographic features of the U.S. population continue to change but that the political behavior of various demographic groups remains the same. In this case, the same means that relatively fine-grained demographic groups7 register and turnout at rates identical to those from the most recent election for which we have data—2012 for presidential elections and 2014 for midterm elections.
These are not predictions nor should they be considered in that light. Rather, they are thought experiments that we can use as a baseline for understanding what the future might hold for the country’s representational challenges.
All of that said, these projections suggest that representation gaps will shrink substantially in the future but remain with us well into the 21st century. For whites, we project that underlying demographic shifts by 2060 could push their overrepresentation gap down about 3 points for both presidential and midterm elections. Specifically, they would drop to 7- and 11-point gaps by 2060 and 2058. For presidential elections, this brings overrepresentation roughly back to its 1980 levels.
For blacks, we project demographic changes to increase their level of overrepresentation in presidential elections only slightly, going up about a point over this 44-year period to about 1.4 points. In midterms, we project a gradual reduction of black underrepresentation in these elections until slight underrepresentation flips to slight overrepresentation by the 2030 election.
For Hispanics, underrepresentation will continue but there will also be significant strides toward a more representative electorate. These changes will not be overwhelming—a 3-point improvement in presidential elections and a 2-point shift in midterms over the next 44 years—but these changes occur even as their population share is projected to grow by about 11 points. All things equal, we would normally expect an increase in population size to result in a larger representation gap. That we actually see the opposite occurring suggests some rather favorable trends for Hispanics over the next 44 years.
In contrast, our projections for Asians/others indicate that we should expect a steady level of underrepresentation as we move into the middle of the 21st century. Once again, this number can be somewhat deceptive if we do not take population growth into account: Stability in this representation measure, even as the group grows about 7 points as a share of the population, suggests relatively favorable demographic changes.
Race gaps: Decomposition
An additional feature of the data we have built is that we can decompose these total representation gaps into their constituent parts. Both underrepresentation and overrepresentation occur for a variety of demographic and behavioral reasons. This analysis allows us to pinpoint these sources and see how they fluctuated over time and between different types of elections. These constituent parts are roughly divided into demographically oriented pieces—the age and citizenship gaps—and behaviorally oriented pieces—the registration and turnout gaps. See text box for a full description of these concepts.
The four parts of the total representation gap
The age gap represents that portion of the total representation gap attributable to unequal age distributions between groups. For example, compared to whites, Hispanics and Asians/others have a larger portion of their population under the age of 18. Thus, part of the total representation gaps for these two groups is due to a relatively large share of their population being too young to vote. Functionally, it is calculated by subtracting the percent of the whole population that belongs to a given group from their percentage of the voting age population—those 18 years of age and older.
The citizenship, or eligibility, gap represents that portion of the total representation gap attributable to unequal levels of citizenship between groups. Hispanics and Asians/others are groups with relatively high immigrant populations and, as a result, lower citizenship rates. Therefore, a lower percentage of their population are eligible to vote. Functionally, it is calculated by subtracting the percent of the voting age population that belongs to a group from their percentage of the citizen population—those 18 years of age and older who are also citizens.
The registration gap represents that portion of the total representation gap attributable to unequal levels of voter registration between groups. Functionally, it is calculated by subtracting the percent of the eligible population that belongs to a group from their percentage of the registered population—those who are registered to vote.
The turnout gap represents that portion of the total representation gap attributable to unequal levels of registrant turnout between groups. Functionally, it is calculated by subtracting the percent of the registered population that belongs to a group from their percentage of the voting population—those who actually voted in a given election in a given year.
Together, the total representation gap equals the sum of these components—the age gap, the citizenship gap, the registration gap, and the turnout gap.
Taking these in turn, Figure 5 displays our four racial groups’ age gaps—the portion of the total representation gap that exists due to unequal age distributions between different groups. Since 1980, whites have had a far lower percentage of their population in the zero to 17 age category, and this has resulted in a positive age gap for them and a negative gap for all other racial groups. While demographic shifts have caused blacks to become less underrepresented during this time period, Hispanics and Asians/others have seen relatively large increases in their age gaps. As we project out into the future, this trend should reverse course as blacks and Hispanics have larger and larger portions of their population age into the voting age population. Asians/others will continue to see their age gap increase, but the change will be less dramatic than what we’ve seen in the last three decades.
Next, we will examine the citizenship gap—the portion of the total representation gap that exists because of unequal levels of American citizenship between groups—which is displayed for our groups in Figure 6. Although there are a number of stories to tell here, the most consequential is about the rising Hispanic population. High levels of immigration in the decades after 1980 resulted in a rapidly growing population—but also one that had relatively low levels of citizenship. During this time period, the citizenship gap for Hispanics more than doubled, going from -1.5 points in 1980 to about -3.5 points in 2016. This underrepresentation growth was mirrored with a roughly identical growth in overrepresentation among whites.
According to our projections, these two large deviations from representational equality will shrink substantially over the next 44 years, especially the citizenship gap. The reason for this is that the majority of the growth among Hispanics will come from native births rather than immigration. As more native-born Hispanics enter the voting age population, they will start to bring their citizenship rate into alignment with that of whites and blacks. Accompanying this will be a similar trend among Asians/others, who will see a smaller but still substantial drop in their underrepresentation levels due to citizenship issues. Even absent any legislative action, we expect the citizenship gaps of both Hispanics and Asians/others to return to their 1980 levels in the 2030s and 2020s, respectively. By the 2050s, both these groups will have effectively zeroed out their eligibility issues.
Before presenting the remaining measures—registration and turnout gaps—it is worthwhile to give them a little context. For the purposes of this report, we felt it necessary to separate them into distinct parts of the total representation gap, given that they do, technically, represent different steps of political participation. Furthermore, there is a value in determining how much of the underrepresentation and overrepresentation gaps we see among groups is attributable to the difference between the eligible population and the registered population—the registration gap—versus the difference between the registered population and the voting population—the turnout gap.
That said, we do not wish to be misleading in regard to what these measures might mean. Hypothetically, say that the registration and turnout gaps for a given group collectively constituted a large portion of the total representation gap but that the former was significantly bigger than the latter. For those interested in reducing representation gaps, a common but likely mistaken interpretation of this data might be something akin to, “If we can just get X group registered to vote, then we can close most of the gap.”
The reason this interpretation is suspect is that these two gaps are part and parcel of the same behavioral characteristic—political engagement. Individuals who register to vote and then vote have a higher level of engagement than those who do not register to vote and, subsequently, do not vote. Closing a part of the registration gap—say, by making registration easier—would not necessarily produce individuals who turn out to vote at the same rate. In fact, we would almost certainly expect these individuals—who are less politically engaged than individuals who were able to register themselves previously—to turn out at a lower rate. Instead of being entirely eliminated, a significant portion of the total representation gap you might close through higher registration could simply manifest itself as a higher turnout gap.
All of this is to say the following: While we do present the registration and turnout gaps separately, there is considerable value in thinking about them as highly interrelated measures that cannot be divorced from one another easily.
That throat clearing aside, we can see the past and projected registrations gaps for presidential and midterm elections in Figure 7. For most of the presidential elections after 1980, we saw whites systematically overrepresented among registered voters as a result of their higher registration rates. While the white registration gap in presidential elections has moved from a low of 1.4 in 1984 to 2.5 in 2012, we have seen the registration gaps of Hispanics and Asians/others increase by about a point each due, mainly, to population growth.
In contrast, the black registration gap that hovered between -1 and -0.5 between 1980 and 2004 essentially zeroed out in 2008 and flipped from underrepresentation to overrepresentation by 2012. Spurred on by the election of America’s first black president, the relative registration rates of this group rose dramatically and contributed to one of the few flips we see anywhere in our data.
The story for midterm registration gaps is very similar for the elections between 1982 and 2014 except that all the gaps tend to be slightly larger than their presidential counterparts. Whites were overrepresented while Hispanics and Asians/others were underrepresented. Each of those groups has seen their representation gaps grow larger and move away from zero. Blacks have been underrepresented at relatively low levels in midterms and have seen smaller gaps in the last several election cycles, but unlike in presidential elections, these improvements have not yet resulted in a positive representation gap.
Projecting out to 2060, what can we expect if registration rates are identical to the ones we observed in 2012 and 2014? Unlike the more demographically oriented pieces of the total representation gap, registration issues will generally make racial registration gaps larger as we move forward.
One reason for this is that there is a strong relationship between age and registration—with younger Americans tending to register at a lower rate than older Americans. However, not all racial groups are aging at an equal rate. With their bottom-up growth driven primarily by relatively high fertility rates, Hispanics and Asians/others will age more slowly as a group than whites and blacks. Additionally, as eligibility gaps close during this time period, that now-larger eligible voter population will register at a lower rate than whites and blacks. In this way, diminishing eligibility gaps can turn, in part, into increasing registration gaps.
We expect that white registration gaps will go up from 2.8 and 4.1 points in 2016 and 2018 to 3.9 and 5.1 points in 2060 and 2058. Similarly, blacks will continue to increase their positive registration gaps, although these changes will be much smaller at 0.4 and 0.1 to 1.0 and 0.6 during the same timespan. Mirroring the growth of those two groups’ gaps, the projections indicate that we should anticipate larger, negative registration gaps for Hispanics—from -2.2 and -2.7 to -3.2 and -3.6—and Asians/others—from -1.1 and -1.4 to -1.6 and -2.0.
Finally, we’ve displayed the turnout gaps for presidential elections and midterm elections in Figure 8. For whites, we have observed two markedly different trends since 1980—a modestly declining level of turnout overrepresentation in presidential elections and a substantially increasing level in midterms. In 1980 and 1982, the presidential and midterm gaps were nearly identical at 0.7 and 0.5, but by 2012 and 2014, they had become quite distinct at 0.1 and 2.6. Interestingly, 2012 and 2014 represent both the lowest—presidential—and highest—congressional—turnout gaps we have observed in the past 36 years.
For blacks, the story varies somewhat depending on the start year one uses, but it is clear that negative turnout gaps have been the norm since 1980. However, since the late 1980s to early 1990s, those gaps have been shrinking significantly as black turnout has increased. The midterm turnout gap for blacks actually turned positive in 2010, though it slipped back to very slightly negative in 2014. The presidential turnout gap for blacks went from negative to positive starting in 2008 and, strikingly, was actually larger than the white registrant turnout gap in both 2008 and 2012.
In contrast, Hispanics started with negative turnout gaps and have seen those gaps grow larger over the last 36 years. Their presidential and midterm turnout gaps were essentially equal in 1980 and 1982—hovering around -0.2—but changed at notably different rates over time. As of the 2012 and 2014 elections, these gaps stood at -0.5 and -1.7. We can tell a nearly identical story for Asians/others from the roughly similar negative gaps in 1980 and 1982—both were below -0.1—to the divergent rates of change leading up to 2012 and 2014—in which the gaps stood at -0.2 and -0.6.
Assuming that the turnout rates of registered voters remains the same, we see relative stability in the turnout gaps for presidential elections and larger changes afoot for midterms. By 2060 whites, blacks, Hispanics, and Asians/others are expected to shift 0.4, 0.2, -0.4, and -0.2 from their presidential baselines in 2016, respectively. In midterms, we would anticipate changes rough twice that size at 0.8, 0.5, -1.0, and -0.3 from 2014 to 2058.
Taking a step back, we might ask about the relative impact of each of these factors over time and how they might change in the future as the American population shifts. To assess this, let us take the single racial group that is consistently overrepresented during our analysis—whites—and see how each of the gaps contributes to their overrepresentation in a given year. Figure 9 displays those composition values for every presidential and midterm election between 1980 and 2060.
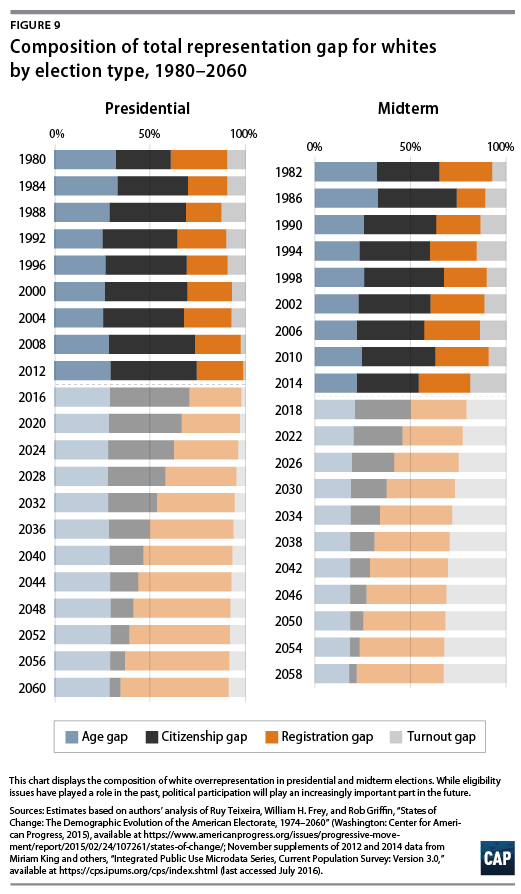
In general, the early 1980s were a time when age, citizenship, and participation—registration plus turnout gaps combined—played roughly equal roles in explaining the overrepresentation of whites. In presidential races, the citizenship gap grew larger between 1980 and 2012 as a result of immigration-driven growth among Hispanics and Asians/others, going from roughly 30 percent of the total representation gap to 45 percent. At the same time, the impact of the participatory gaps—registration and turnout—collectively shrunk by a roughly equal amount.
In contrast, the participatory gaps made up a larger percentage of the total representation gaps in midterm elections over this time period. Given that age and citizenship gaps are roughly the same size during midterm and presidential elections, this increase suggests that registration and turnout gaps grew substantially—enough to overwhelm an increasingly large citizenship gap. Between 1982 and 2014, the combined impact of the participatory gaps in midterms went from 35 percent of the total representation gap to 46 percent.
As we project forward, the increasingly native-born Hispanic and Asian/other communities will have higher citizenship rates. As this occurs, the impact of the citizenship gap will also decline and participatory issues will go from explaining 29 percent and 50 percent of their representation gaps in 2016 and 2018 to 65 percent and 78 percent in 2060 and 2058.
In sum, while eligibility issues have played an increasingly prominent role in explaining racial representation gaps in presidential elections to date, participatory elements will explain the lion’s share of future gaps.
Age gaps
If we break the American population down by age, we find that the youngest age groups are generally underrepresented while the oldest are overrepresented. Given the incredibly strong relationship between age and political participation, this should come as little surprise. While the past three decades have seen middle-aged Americans become increasingly underrepresented and seniors increasingly overrepresented, the coming demographic changes will likely shift the population slightly back toward more equal levels of representation.
Understanding these general age gap trends starts with understanding the specific and substantial differences between how well different age groups are represented. These differences are displayed in Figure 10 for our four age groups—those ages 18 to 29, 30 to 44, 45 to 64, and 65 and older.
As we might expect given the important part age plays in predicting the likelihood of voting, younger age groups are generally underrepresented while older age groups are overrepresented. Starting with the 18- to 29-year-olds, we can see that they have been systematically underrepresented among voters and that this representation gap is notably worse in midterm elections. Both midterm and presidential gaps for this group showed significant improvement after 2004 and shrunk to their smallest level in 2008 and 2010 at -4.8 and -9.5 points, respectively. However, these gaps grew in subsequent elections, sliding back to -6.0 and -11.2 points in 2012 and 2014.
For 30- to 44-year-olds, there has been a clear trend over time toward underrepresentation. In 1980 and 1982, this group was overrepresented by a little over 1.3 points and .4 points, respectively. This flipped to underrepresentation by the elections of 1994 and 1996, with these gaps growing to around -2.5 and -5.2 points by 2012 and 2014. This change is due in part to the shifting racial composition of this group but, more importantly, due to a decline in turnout among 30- to 44-year-old whites since the 1980s.
The older age ranges have been consistently overrepresented in federal elections for the last 36 years. As one would expect, overrepresentation of these age groups is generally higher in midterm than in presidential years.
The 45- to 64-year-old age group saw relatively little change between 1980 and 2014. Levels of overrepresentation during presidential elections have remained fairly constant, hovering between 3.5 and 5. Midterms have varied a bit more—still centered about 7 or so—but there has not really been a discernable trend. In contrast, those in the 65 and up age group have seen rising levels of overrepresentation in both presidential and midterm elections. In 1980 and 1982, this group’s representation gaps were 1.5 and 3.6, respectively. These grew to 4.1 and 9.3 by 2012 and 2014.
Looking at projected representation gaps for age groups, we see far less change over time than we did for racial groups. Holding registration and turnout rates constant over this time period, we expect representation gaps for all age groups to decline somewhat between 2016 and 2060, with underrepresented age groups becoming less underrepresented and overrepresented age groups becoming less overrepresented. This indicates there will be some small return toward a more age-representative electorate in the future simply as a function of changing demographics.
Compared to their 2016 and 2018 baselines, we expect the representation gaps of 18- to 29-years-olds to shift 0.7 and 1.3 points, 30- to 44-years olds to shift 1.1 and 0.4 points, 45- to 64-years-olds to shift -1.8 and -2.4 points, and those 65 and older to shift -0.03 and -0.7 points.
Education and gender gaps
Over the past three decades, we have observed representational divides between those with and without college educations. With strikingly higher levels of participation, college-educated voters have been consistently over-represented in the electorate in both midterms and presidential elections. However, two groups have driven a significant portion of this overrepresentation and underrepresentation: college-educated whites and Hispanics without a degree. Equally interesting are the gender divides among those without college degrees. Among whites and blacks in our most recent elections, we actually see overrepresentation across the board except for one group—men without college degrees.
Looking ahead several decades, future demographic trends suggest a more equitable future where Hispanics, Asians, and those of other races without college degrees are still underrepresented but at a much lower relative rate.
To illustrate this broad story, we will start with the basic representation trends for Americans with and without college degrees. As shown in Figure 11, college-educated Americans have been consistently overrepresented among the voting population, and the size of that gap has grown over time, particularly in midterms. The total representation gap for college graduates has gone from around 5 and 6 points in 1980 and 1982 to 8 and 11 points in 2012 and 2014. Most of this growth has been due to the steady increase in the size of the college-educated population.
Among Americans without college degrees, we see the opposite trend—a growing underrepresentation gap, even as the population itself has shrunk over time. In 1980 and 1982, noncollege Americans were underrepresented by -5 and -6 points, gaps which grew to -8 and -11 by 2012 and 2014.
However, if we also break these data down by race, we can see that this original cut of the data actually hides a tremendous amount of variance. Looking at Figure 12, which displays the total representation gap by college education and race for presidential elections, we can see that the vast majority of overrepresentation and underrepresentation is actually coming from just two racial groups—whites and Hispanics.
In 2012, white college graduates had a representation gap that was larger than the collective overrepresentation gap of college graduates alone. Notable here is that, despite being college educated, nonwhite groups do not have an apparent representational advantage. In fact, Hispanic as well Asian/other college graduates are actually underrepresented among voters, mainly as a result of low citizenship rates.
Similarly, noncollege Hispanics alone had a representation gap that accounts for 82 percent of the total underrepresentation of all noncollege Americans, a function of both their low citizenship and participation—registration and turnout—rates. Interestingly, the former is actually why noncollege whites experience a representation gap that hovers around zero despite having low participation rates: The ineligibility of the Hispanic and Asian and other noncollege population floats the white and black population.
Finally, we can also break down the data by gender, once again revealing some subgroup variance hidden in the larger groups we have analyzed above. In addition, we can project these groups out into the future. While these projections are less defensible than the ones used in the rest of this report, they still constitute a very good estimate of the future populations of the country might look like.8 In Figure 13, we display the total representation gaps broken down by gender and for whites, blacks, and Hispanics.
There are several stories to unpack within this new cut of the education data, but perhaps the most interesting is the difference between white noncollege men and women from 1980 to 2012. As previously noted, the overall representation gap for noncollege whites tended to hover around zero in this period as a function of both positive citizenship gaps and negative participation gaps. What we can see in these data is that this balance varies by gender, with white noncollege men underrepresented due to very low participation rates and white noncollege women overrepresented due to relatively higher rates. Notably, the participation gaps of these women are still negative but not negative enough to outweigh their eligibility advantages.
There is a similar story to be told about black noncollege men and women. As we have noted several times in this report, the flip among blacks from underrepresentation to overrepresentation is one of the most interesting stories we have in regard to political behavior in the past 30 years. What our data reveal is that this overrepresentation was not evenly distributed across education and gender. While college-educated blacks and black noncollege women were all overrepresented among voters, black men without college degrees were still underrepresented.
As we project into the future, one of our original expectations was that the shrinking eligibility gap among Hispanics would eventually make white noncollege men and women less represented among voters. The logic here was that if the eligibility gap was one of the only things floating these populations, then its disappearance would cause their total representation gaps to diminish considerably.
However, our own projections surprised us. While this does hold true for white women without college degrees—their representation gap declines from 0.5 to .01 between 2016 and 2060—we see the opposite trend amongst men. Their representation gap goes from -1.0 to -0.4 during that same time period. This is because the aging of the white male noncollege population more than offsets its shrinking eligibility gap.
Among whites with college degrees, we project declines in their representation gaps, going from 3.8 to 3.1 for men and 3.9 to 3.0 for women between 2016 and 2060. This occurs because their shrinking citizenship gap is not counterbalanced by increases in their registration and turnout gaps during this time period.
Among blacks, we see a universal positive movement in their representation gaps. Notably, black men without college degrees will see enough of an increase to go from underrepresented to overrepresented by 2052. We see a similar movement among college-educated Hispanic men and women, both of whom should see enough change in their representation gaps to become overrepresented by 2020.
Interestingly, our projections indicate a roughly flat trajectory for noncollege Hispanics despite the dramatic increases in citizenship we expect to occur over this time period. Again, it is important to consider these gaps in the context of their population size. If not for the projected decline in the citizenship gap, increasing population size would drive the total representation gap for this group up substantially. So maintaining stability in the face of rapid growth should be viewed positively.
Representation gaps, demographic change, and alternative scenarios
In the last section, we laid out the effects of projected changes in the demographic composition of the population on total representation gaps. That is, using our baseline assumptions, we assessed, for example, what the difference in the representation of Latinos among the population as a whole versus their representation among actual voters would be in 2060, given our projections of demographic change in United States.
Our baseline assumptions were based on the most recent data available for us from the American Community Survey and Current Population Survey Voting and Registration Supplement, including eligibility, registration, and turnout rates from the 2008 to 2014 elections. A given baseline only uses registration and turnout rates from one election; we could not use 2016 as a baseline because Census data are not yet available. But we did not take into account policy changes such as immigration and registration reform that might alter those rates in a systematic way and therefore produce different representation gap outcomes.
This is, of course, of considerable interest, so in this section, we simulate what the effects of these policy changes might be. We cannot know in advance exactly how these policy changes would affect underlying eligibility, registration, and turnout rates, so instead we make different assumptions about how these rates might change, including what would appear to be the maximum and minimum effects of these policies. Based on these different assumptions, we are able to give a sense of the range of effects on representation we might see if the country did move down the path of registration and/or immigration reform.
The basic scenarios we investigated, and the assumptions they entailed, are outlined below.
- Immigration reform I: Full eligibility
In this scenario, all groups are assumed to have full eligibility—that is, all voting age members of a given group are assumed to be citizens and therefore eligible to vote. Turnout and registration rates by state, race, age, and gender are held constant. This represents an ideally effective implementation of immigration reform since all voting age noncitizens become citizens and these newly enfranchised noncitizens register and vote at the same rate as their already enfranchised peers.
- Immigration reform II: Full eligibility, half current registration rates
Here, again, all groups are assumed to have full eligibility, so all voting age noncitizens become citizens. But in this scenario, we do not assume that these newly enfranchised citizens will register at the same rate as currently enfranchised citizens. Instead, we assume that the registration rate of the newly eligible is only half that of the old eligible population by state, race, age, and gender group. Finally, we assume that the turnout rates of newly enfranchised citizens, once registered, match those of currently enfranchised citizens.
- Registration reform I: Registration equalized over race
In this scenario, all racial groups have their registration rate set equal to the highest rate of registration in their state for their age group and gender. For example, for 18- to 29-year-old men in California, if white male 18- to 29-year-olds have a higher registration rate than black male 18- to 29-year-olds, Latino male 18- to 29-year-olds, and Asian and other male 18- to 29-year-olds, we set the registration rate for all these 18- to 29-year-old male groups equal to the white 18- to 29-year-old male rate. Turnout rates by state, race, age, and gender are held constant. This represents an upper bound of effectiveness for registration reform implementation since we are assuming that differences in racial registration rates will disappear among eligible voters within a given age/gender category and that newly registered voters will turn out at the same rate as their already registered peers.
- Registration reform II: Registration equalized over race, half current turnout rates
Here, again, all racial groups have their registration rate set equal to the highest rate of registration in their state for their age group and gender. But in this scenario, we do not assume that newly registered voters will turn out at the same rate as currently registered voters. Instead, we assume that the turnout rate of the newly registered is only half that of the old registered population by state/race/age/gender group.
- Mobilization reform: Turnout equalized over race
In this scenario, all racial groups have their turnout rate—among registered voters—set equal to the highest rate of turnout in their state for their age group and gender. For example, for 18- to 29-year-old men in California, if white male 18- to 29-year-old registrants have a higher turnout rate than black male 18- to 29-year-olds, Latino male 18- to 29-year-olds, and Asian/other male 18- to 29-year-olds, we set the turnout rate for all these 18- to 29-year-old male registrant groups equal to the white 18- to 29-year-old male registrant rate. Registration rates by state/race/age/gender are held constant.
- Mobilization plus registration reform: Turnout and registration rates equalized over race
In this scenario, all racial groups have both their turnout and registration rates set equal to the highest rates of turnout and registration in their state for their age group and gender. This scenario represents the holy grail for election reformers, since it eliminates racial disparities that currently affect both the registration process and voter mobilization process—disparities that, together, drive the widely noted participation gaps between eligible voters of different races.
Immigration reform I: Full eligibility
What would happen to projected representation gaps if immigration reform were implemented and was suddenly and wildly successful, transforming voting age noncitizens into voting age citizens, and therefore eligible voters, en masse. This scenario allows us to answer that question.
The first thing to note is that this change produces an immediate decline in the level of white overrepresentation in presidential elections, relative to our 2012 baseline. (For clarity of exposition, we concentrate here on presidential elections; congressional elections show the same pattern of decline, just from a higher initial level.) In 2020, overrepresentation drops from 10 points under the baseline to less than 7 points. The reason the gap does not disappear entirely is because there are still gaps due to superior white turnout of registrants, more substantially from an older age structure of whites and, most substantially, from considerably higher registration rates among whites.
The flip side of this outcome is largely about Latinos.9 Their underrepresentation drops immediately from -8 points in 2020 to -5 points in 2060. For the opposite reasons to whites, the gap does not completely disappear: lower turnout of registrants, a younger age structure and, especially, lower registration rates.
The second thing to note is the full eligibility scenario does not have much effect on projected representation gaps toward the end of our projection period. In 2060, white overrepresentation in this scenario is projected to be 6.4 points. Under our baseline, it is 6.8 points. Similarly, Latino underrepresentation under this scenario is -5.3 points in 2060, identical to the baseline figure for that year.
This is because the Latino and Asian voting age population is projected to become overwhelmingly citizen based—over 90 percent—in the coming decades. Therefore, most of the all-at-once effects on eligibility we have simulated in this full eligibility scenario should happen gradually to these populations anyway, with representation gaps winding up at roughly the same level under both our baseline and the scenario.
By 2060, the most salient part of representation gaps under this scenario will be registration gaps: 3.8 of the 6.4 points for white overrepresentation and -3.2 of -5.3 points for Latino underrepresentation. For Latino underrepresentation, the rest of the representation gap will be accounted for about equally between an age gap—Latinos will be still be younger—and a registrant turnout gap—we assume Latino registrant turnout rates remain relatively low.
Immigration reform II: Full eligibility, half current registration rates
As noted, the assumption that all newly eligible voters would register at the same rate as currently eligible voters is probably unrealistic. So, in this scenario, we still assume that immigration reform will be hugely successful at turning voting age noncitizens into citizens but set these new citizens’ registration rate at only half the current rate for their state, race, age, and gender group, reflecting their relative disconnection from the political system.
Compared to the previous scenario, this scenario has a significantly smaller immediate effect on representation gaps, because, while it eliminates the eligibility gap, it sharply increases the registration gap due to the lower registration rate of new eligibles. Thus, the scenario only produces half of the immediate 3-point decline in white overrepresentation seen in the earlier scenario. And, while the previous scenario brought projected Latino overrepresentation down from -8 to -5 points in 2020, this scenario only brings it down to -7 points by 2020.
However, these relatively high representation gaps should shrink over time as the number of voting age noncitizens declines and eventually arrive in roughly the same place as the first immigration reform scenario. And, as before, the key driver of future representation gaps in this scenario will be registration gaps, reflecting the assumption that Latinos and Asians, whether affected by immigration reform or not, will continue to register at lower levels than whites. Continuing age and registrant turnout gaps will be of considerably less importance.
Registration reform I: Registration equalized over race
This scenario allows us to estimate the effects of registration reform on future representation gaps if reform fully succeeded in eliminating racial disparities in registration rates. The contrast with the first immigration reform scenario is instructive. In this, our first registration reform scenario, the immediate effect on representation gaps in the 2020 election is not as large: White overrepresentation comes down 2 points, from 10 points in the baseline to 8 points, and Latino underrepresentation improves by 2 points, from -8 points to -6 points. These are solid improvements, but in the first immigration reform scenario, the respective figures were 3 points in each case.
But the most interesting contrast is that, unlike the immigration reform scenario, registration reform produces representation gap improvements that, relative to the baseline, persist—in fact, widen—all the way to 2060. By that time, this registration reform scenario reduces white overrepresentation to just under 4 points, Latino underrepresentation to just under -3 points, and cuts Asian/other underrepresentation in half to -1.5 points. What drives what is left of representation gaps at this point are, first, that the Latino and Asian populations are still younger than the white population and, second, that their registrant turnout rates are still assumed to be lower than white rates.
As noted earlier, this represents an upper bound of effectiveness on racial disparities for registration reform since we assumed both that differences in racial registration rates will disappear among eligible voters within a given age/gender category and that newly registered voters will turn out at the same rate as their already registered peers.
Registration reform II: Registration equalized over race, half current turnout rates
The assumption that all newly registered voters would turn out at the same rate as currently registered voters is probably very unrealistic. Those who have registered without benefit of reform are likely more motivated and attuned to politics than those who have not and, therefore, are more likely to actually cast a ballot than those who are newly registered due to a reform process.
This view is supported by recent results from Oregon’s new system of “opt-out” voter registration, where those who interact with the state’s Department of Motor Vehicles are automatically registered and then have to actively respond to a postcard notification to opt out of being registered. If they do nothing, they remain registered. In 2016, those registered by this method in Oregon turned out at a rate that was roughly half of those registered by conventional means.10
So, in this scenario, we still assume that registration reform will be hugely successful at elevating and equalizing registration rates, but we also assume that these new registrants will turn out at only half the current rate for registrants in their state, race, age, and gender group. Compared to the first registration reform scenario, this scenario, as we would expect, has a significantly smaller immediate effect on representation gaps, reducing it by just a percentage point in 2020, relative to our baseline. And, while this registration reform scenario does produce representation gap improvements that, relative to the baseline, continue and widen slightly to 2060, the overall effect is quite a bit smaller than the first registration reform scenario.
In the year 2060, in this simulation, white overrepresentation is still about 5 points and Latino underrepresentation is about -4 points. What drives representation gaps at that point is primarily a significant registrant turnout gap point with an ongoing age gap being of secondary importance.
This scenario can be taken as the probable effect of an extremely successful registration reform if turnout of the newly registered under reform continues to lag turnout of the already registered.
Mobilization reform: Turnout equalized over race
The previous scenario raises the issue of what would happen if we could eliminate differences in the turnout of registrants by race, say, through technical improvements in mobilization practices and perhaps enhanced interparty competition for these voters.
However, this turns out to the least effective intervention in terms of reducing representation gaps if it occurs in the absence of any reduction in registration differences across race and age groups. Initially—looking at 2020—it has very little effect, reducing white overrepresentation by only one-tenth of percentage point and Latino underrepresentation by half a point relative to our baseline. Over time, the effect becomes somewhat larger, reducing projected white overrepresentation by .5 points and Latino underrepresentation by .8 points in 2060.
These modest results reflect the continued salience of registration gaps, which, in this scenario, are not touched by equalizing the turnout of registrants. Obviously, solving the problem of racial disparities in turning out registered voters, while making a contribution to reducing representation gaps, will be of limited value in the absence of practices that also narrow continuing registration gaps.
Mobilization plus registration reform: Turnout and registration rates equalized over race
Our final scenario eliminates racial disparities that currently affect both the registration process and the voter mobilization process—disparities that, together, drive observed participation gaps between eligible voters of different races. This would be the result if both registration reform and new mobilization practices were highly effective and, in that sense, the scenario represents an upper bound for the effects of reforming participation processes, as opposed to eligibility for participation, covered in the first two scenarios.
The immediate—in this case, 2020—effect on representation gaps is substantial. White overrepresentation relative to the baseline drops by almost 3 points to 7 points and Latino underrepresentation drops by 2 points to -6 points. These changes are substantial, but they are still less than the immediate narrowing of representation gaps we saw with the first, full eligibility scenario.
Unlike with the full eligibility scenario, however, the narrowing of representation gaps under this scenario continues to 2060 and, in fact, intensifies. By 2060, projected representation gaps are down to 3 points—overrepresentation—for whites and just -1.6 points and -1.1 points—underrepresentation—for Latinos and Asians/others, respectively. The driver of what remains of representation gaps at this point will be the age gap: Whites are likely to still have an older age structure that will give them a slight representation advantage, given the propensity of older voters to register and turn out at higher rates.
It is also worth noting that this scenario comes close to eliminating the representation gap differences between presidential and congressional elections. The white representation gap in the latter elections would be down to 4 points—not far off the projected 3-point gap in presidential elections.
Thus, eliminating participation disparities by race through better election practices and reforms could come very close to solving the representation gap problem in the future, leaving only a small residual attributable to differing race-ethnic age structures. This is a potential—and highly desirable—outcome worth serious consideration by policy makers and politicians.
Demographic change and representation gaps in the states
The voter representation gaps for the nation as a whole provide an overall benchmark of how changing demographics, along with registration and voting behavior, have affected and will affect various groups’ representation among voters on Election Day. However, these demographic and behavioral shifts differ sharply across states, particularly in light of the broad dispersal of minorities from coastal melting pot areas for Hispanics and Asians to interior parts of the country, and the continued migration of African Americans toward prosperous Southern states.
Trends in white representation gaps across states
These demographic shifts across states, when accompanied by delayed patterns of voter eligibility—and distinctive patterns of registration and turnout among Hispanics and Asians—bring about changes in the geography of overrepresentation and underrepresentation by racial groups. This is illustrated in the map shown in Figure 20, which depicts white total representation gaps among states for 1980, 2016, and 2060
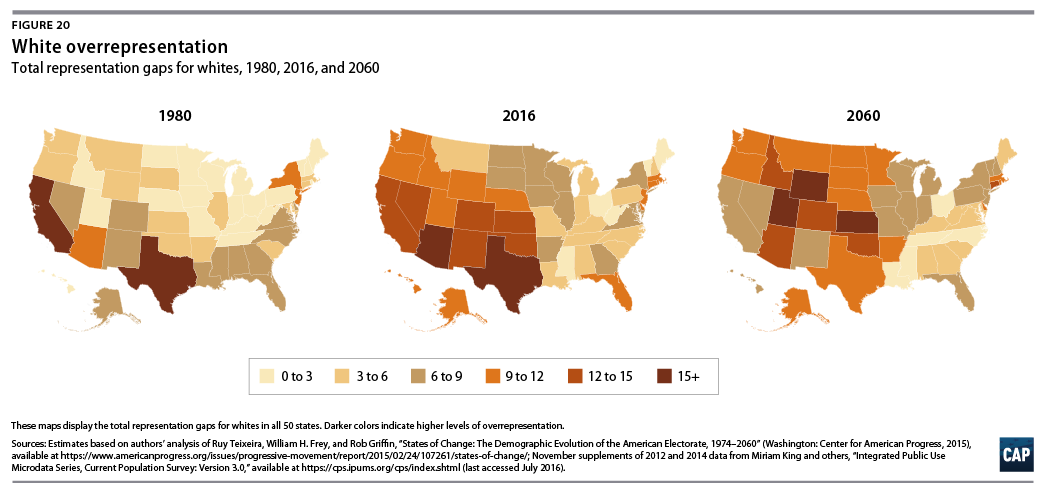
Not unexpectedly, the highest positive white representation in 1980 was evident in states that had large minority, especially Hispanic, populations, led by California, Texas, and Arizona, with white overrepresentation gaps of 17, 15, and 11 points, respectively. The District of Columbia, with a large black population, had a gap of 16 points. The only other states that had a larger white representation gap than the nation as a whole, at 7 points, were New Jersey, New York, Alaska, North Carolina, and Nevada—a mix of states where minorities were primarily black, such as New Jersey, New York, and North Carolina; Hispanic, such as Nevada; and Asian and other races, such as Alaska. Seven states had positive white representation gaps equal to that of the United States, and in 36 of the 50 states, the white representation gap between voters and their resident populations was less than for the nation as a whole
Because in 1980, racial minority populations, particularly new minorities—Hispanics and Asians—were heavily concentrated in just a few states, only those states tended to have high white voter representation gaps. Yet, in subsequent decades, this began to change as minorities started to disperse. By 2016, the national white representation gap had increased to 10 points and, fully, 21 states showed gaps at that level or higher. Arizona rose to number one, with a representation gap of 18 points for whites. Also rising to the top echelon were New Mexico, Colorado, Kansas, Utah, Washington, Connecticut, and Oregon. All told, 39 states registered increases in white representation gaps between 1980 and 2016. In 20 of those, the increases exceeded 5 points.
Moving to 2060, a different story emerges as racial minorities take on a larger presence in so-called interior new destination states, while the racial profiles of voters in more established melting pot states come more to resemble the overall population. By 2060, the nationwide white representation gap is projected to decline to 7 points, and just 16 states, as well as the District of Columbia, should have lower values than the nation as a whole.
The spreading out of the representation gap across more states is evident in the fact that 31 states showed gains in that gap between 2016 and 2060, while 19 states and the District of Columbia showed declines. States with the largest declines in this gap are the long standing melting pot states of California, Nevada, and Texas. California and Texas ranked first and second among states in 1980 on the white voter-resident population representation gap. In 2060, they will rank 27th and 16th, respectively, as their voting populations more closely represent their resident populations.
At the other extreme are states that are projected to rank highest in this gap by 2060: Utah, Wyoming, and Kansas with values of 18, 16, and 16 points, respectively. While these states’ populations will still be less racially diverse than those of other parts of the country, by then, they will have developed significant minority populations that, unless current patterns change, will still encounter gaps in eligibility, registration, and turnout.
Finally, it is worth mentioning that one politically consequential state in presidential elections displayed a low and relatively unchanged white representation gap over the entire period. Ohio’s positive white representation gap began at just 1 percent in 1980 and rose modestly to 2 points in 2016. This small change results from the fact that its population is largely white and its minority population continues to be primarily black, a population which tends to show relatively high registration and turnout. The subsequent, very slight rise in the white representation gap to 3 points in 2060 is attributable to the gradual increase in the size and delayed voter participation of this state’s much smaller Hispanic and Asian populations.
Representation gap trends for selected states
To dig deeper into how these representation gaps affected groups other than whites, this section focuses on four racially diversified states in the Sun Belt South and West regions of the country and four somewhat more white states in the Snow Belt Northeast and Midwest regions.
Sun Belt states
The Sun Belt states focused on here are Arizona, Texas, Florida, and Georgia. The populations of each of these states become decidedly more diverse over the course of the 1980 to 2060 period. This is especially the case for Arizona, whose white population drops from 83 percent in 1980 to 31 percent in 2060. Over these years, Hispanics become a plurality of the state’s population, rising from 13 percent to 48 percent.
Texas was already racially diverse in 1980 at 66 percent white, 21 percent Hispanic, and 12 percent black. By 2060, the Lone Star state’s white population is projected to dip to 25 percent, while its Hispanic and black populations should comprise 55 percent and 11 percent shares, respectively.
Florida also shows a decline in its white population from 75 percent to 35 percent over the 1980 to 2060 period. Both the Hispanic and Asian/other population should rise from 7 percent and 1 percent to 40 percent and 8 percent, respectively. Finally, of this group of states, Georgia’s minority profile is dominated by blacks who should rise from 27 percent in 1980 to 38 percent in 2060; at the same time, its Hispanic share is projected to rise from 1 percent to 17 percent. Over this period, the Peach State’s white share should be cut in half, from 72 percent to 36 percent.
These racial shifts provide the backdrop for examining past and projected trends in race-specific representation gaps in these states, shown in Figure 21. As discussed in the previous section, Arizona’s positive white representation gap has always been in the highest echelon across states, but it reached a peak with a value of 21 points in 2008, after which it should consistently fall to a value of 14 points in 2060, when it should still rank fourth among all states.
This pattern of rise and fall in positive white representation closely mirrors the negative representation gap for Hispanics in the state. As Hispanics became a larger share of the state’s population, and many of its members stayed below voting age, the negative Hispanic representation gap grew from a value of -7 in 1980 to -20 in 2008. While remaining negative throughout the projected period, the Hispanic gap should close somewhat, a result, largely, of more Hispanics reaching voting age and becoming eligible to vote.
Both Asians/others as well as blacks, which comprise much smaller parts of Arizona’s population throughout the period examined, register tiny representation gaps. The Asian/other gap is negative throughout, ranging between -1 to -3 points; the black gap ranges between 0 and -1 points until 2012, when it turns positive at levels below 1 through the remainder of the projection period to 2060.
Texas’s positive white representation gap started as one of the largest in the nation, but, after peaking at 18 points in 2008, started declining and should decline through 2060. These trends mirror the negative representation gap for Hispanics in the state, which also reached a low of -20 in 2008 and should become steadily more modest over time for the same reasons that Arizona’s negative Hispanic gap is projected to diminish.
Texas’s black population showed modest negative representation gaps until after 2000, when it began to register positive gaps that got as high as 4 points in some years. This small rise reflects blacks’ comparatively greater representation among voters than Hispanics, as the latter population swelled over time. As compared with blacks, Asians/others in Texas had even smaller representation gaps, always negative, ranging between 0 and -2.
Florida’s positive white representation gap pattern follows the general trend shown for Arizona and Texas but remains at generally lower levels. Its peak value of 13 points occurred in 2004, and like the two previous states, mirrors the negative representation gap of the sizeable Hispanic population in the state. The relative magnitude of these negative Hispanic gaps are more modest in Florida than in Arizona or Texas, with a lowest value of -9 points in 2004 and a projected change to just -3 points in 2060.
Florida’s black population registers negative representation gaps throughout the entire time span examined but shifts from levels in the -3 to -6 points range through 2004 and is projected to diminish to below -2 after 2032. Florida’s Asian/other population also shows modest negative representation gaps throughout the time span examined. However, unlike for blacks, the negative values become slightly larger over time.
Georgia, with its substantial black minority population, exhibits a somewhat different pattern than the states just reviewed. Its positive white representation gap is lower overall, though still shows a peak of 10 points in 2004 before declining thereafter. Black representation starts out as negative with a value of -7 in 1980 but becomes positive at low levels from 2008 through 2060, coinciding with the rise of the Hispanic population, which shows an increasingly negative representation gap. The much smaller Asian/other population registers a small but continuously negative representation gap, which shifts downward from less than -1 point in 1980 to a projected -2 points in 2060.
Overall, these Sun Belt states indicate that white overrepresentation is heavily affected by the changing racial demographic makeups of each state over time. States with heavily Hispanic populations start out with relatively high white overrepresentation that declines as their Hispanic populations become more eligible to vote. This dynamic is less pronounced in Georgia, where the primary minority population is black, and in Florida, where the relative representation of whites is affected by both the Hispanic and black populations.
Snow Belt states
The Snow Belt states focused on here are Wisconsin, Pennsylvania, Michigan, and Ohio. Each of these states was politically consequential in recent presidential elections and also significant because of their low levels of racial diversity.
As with the other Snow Belt states, Wisconsin remains relatively white over the examination period, though it becomes more racially diverse over time, from 95 percent white in 1980 to 67 percent white in 2060. Over this timeframe, Wisconsin’s Hispanic population rises from less than 1 percent to 15 percent. An over the same period, its black population should rise from 4 percent to 8 percent.
Pennsylvania should show the greatest rise in diversity of these four states, with its white share declining from 90 percent in 1980 to a projected 59 percent in 2060. Already 9 percent in 1980, its black population should rise very gradually to just 13 percent in 2060. In contrast, the Keystone state’s Hispanic population should rise sharply from less than 1 percent to 18 percent over the same period, while the Asian/other population should rise from 1 percent to 10 percent.
Michigan starts out less white than the other Snow Belt states, at 85 percent in 1980, a share that should decrease to 59 percent by 2060. Over this period, its black population remains its largest racial minority, rising from 13 percent to 17 percent, while its Hispanic population should increase from 1 percent to 12 percent. Michigan’s Asian/other population should also rise sharply, increasing from 1 percent in 1980 to 13 percent in 2060.
Ohio is whiter than Michigan, with its white share shifting from 90 percent in 1980 to a projected 65 percent in 2060. Like Michigan, Ohio’s minority population is predominantly black, with its black share shifting from 9 percent to 16 percent, its Hispanic population from 1 percent to 10 percent, and its Asian/other population trending from less than 1 percent to 10 percent over the 1980 to 2060 time period.
As indicated earlier, whiter states like Wisconsin, Pennsylvania, Michigan, and Ohio tend to have smaller positive white representation gaps. This is because the white representation in the total populations of these states will be much closer to their voting age populations than is the case in states with large populations of minorities—especially Hispanics and Asians, groups who are less represented in the eligible voting age population and are somewhat less likely to register and turn out to vote than whites.
These relative small white representation gaps are depicted in Figure 22 for the four states.
Similar representation trends are shown for Wisconsin and Pennsylvania. Both states show positive white representation gaps which increase over time—a contrast with the patterns shown in the Sun Belt states discussed above, where white representation began to decline after the 2004 to 2008 period. Also, unlike in the Sun Belt, the negative representation gaps of Hispanics become more negative over time. This can be explained by the fact that Hispanic populations in these states are newly emerging and represent a delay in entering into eligible voter status that spans the entire projection period to 2060. Thus, while both white positive gaps and Hispanic negative gaps show different trajectories than they did in states like Arizona and Texas, they do show patterns which mirror each other, just as they did in those two states.
Blacks as well as Asians/others, as smaller sized populations in these states, register relatively small representation gaps. Blacks trend from small negative representation to modest positive representation. Asians’/others’ representation remains negative in both states throughout the examination period but falls from miniscule levels in 1980 to a projected -3 points in 2060 in both states.
Michigan, like the prior two states, shows gains over time in its positive representation gap for whites. It differs, however, in that the negative representation gap for its small Hispanic population is modest throughout the period—as should be its mostly negative black representation gap. Larger negative representation gaps are indicated for Michigan’s modest Asian/other population, which should grow from -1 points in 1980 to -5 points in 2060.
Ohio stands out among these states with its much smaller white representation gap. As noted in an earlier section, Ohio has shown the most consistently low white overrepresentation of all states over the observation period, with its very modest increase over time to a value of 3 points in 2060. Similarly, Ohio’s black population shows low gaps in representation, shifting from slightly negative to slightly positive in 2008, and rising to only 2 points by 2060. The state’s small Hispanic and Asian/other populations both show small negative representation gaps over the whole 1980 to 2060 period, ending up at values of -3 and -2 points, respectively.
In sum, although these whiter Snow Belt states show relatively low gaps in voter representation, there are clear differences. States that are showing significant rises in their Hispanic populations—Wisconsin and Pennsylvania—bring with them continued increases in their white representation gaps, since their Hispanic residents tend to have sharp differences from whites in their age structure and voter eligibility. Other states, where blacks are the predominant racial minority—Michigan and Ohio—should register more modest changes in white overrepresentation.
Components of voter representation gaps
The earlier analysis of voter representation gap components does not necessarily represent how these components—age, eligibility, registration and turnout—play out in individual states. To provide a sense of state variation, two states with very different demographic profiles are examined: Arizona and Ohio.
As indicated above, the rapidly diversifying state of Arizona showed upturns, then downturns, in its positive white representation gap, mirroring changes in the negative representation for Hispanics. The underlying components, shown in Figure 23, provide an explanation.
As the figure indicates, the overall pattern reflects countervailing forces. First, eligibility—citizenship—components drive strong mirror image trends among whites and Hispanics: A sharp positive representation peak for whites and negative peak for Hispanics around 2004, which quickly diminish over time as more Hispanics of voting age become eligible to vote. This general pattern is also reinforced by a more modest pattern of representation gain and loss associated with the age component as a larger share of Hispanic residents become of voting age over time. Together these two effects—eligibility and age—affect both the overall upward/downward positive representation gap for whites and the overall downward/upward negative representation gap for Hispanics.
Yet, countering this pattern somewhat are the registration and turnout components, which increase their impact over the projection period. Together, they contribute to a continued increase in white overrepresentation and Hispanic underrepresentation over time. This is because even as Hispanics become of age and eligible to vote, they are projected to still show lower rates of registration and turnout than whites.
These countervailing patterns of age and eligibility as well as registration and turnout contribute to the overall patterns reviewed above and shown in Figure 21. While the patterns for blacks and Asians do contribute, the primary dynamic in Arizona is associated with the Hispanic components of voter representation and their impact on whites.
For Ohio, the story is different for two reasons. First, Ohio’s white representation gap is tiny compared with most other states. Second, Ohio is a much whiter state, and blacks, rather than Hispanics, make up a larger part of its population.
Figure 24 presents the components associated with Ohio’s representation gaps for whites and blacks. What these data indicate is that the rising white representation gap in Ohio is largely due to the aging and eligibility components—the result of the state’s small Hispanic and Asian populations getting larger over time.
Somewhat surprisingly, the components of registration and turnout serve to depress the positive white representation gap. This is due to the effect of greater turnout and representation among Ohio’s black population. This means that the tiny overall white representation gap for Ohio is being damped down by the trend toward greater voter participation of African Americans. Nonetheless, it should be borne in mind that Ohio’s white representation gap remains and should remain among the lowest in the country.
Education, gender, and race representation gaps
The representation gaps shown earlier for education, gender, and race nationally also take different forms across states. Again, it is useful to see how these play out in Arizona and Ohio, given their different demographic profiles. This analysis focuses on the years 1980 to 2012.
The picture for Arizona is shown in Figure 25. A broad overview indicates that there are only two racial groups that show wide variations in representation by education—whites and Hispanics. For whites, in each year, all whites except white noncollege men show positive representation gaps with white college men and white college women generally registering the highest gaps. There are fluctuations for white noncollege women showing the highest representation gaps in 1996 and 2004 and the lowest gaps in 1980 through 1988. Noncollege white men show modest negative representation gaps for most years, except for 1992 and 2012, when they registered modest positive representation gaps.
These patterns are countered for Hispanics, which show only two groups with noticeable representation gaps: Hispanic noncollege men and women. Both show negative gaps ranging from -4 to -8 points, with the lowest in 2008. Thus, these two groups contribute heavily to the overall negative Hispanic representation gaps observed earlier.
African Americans as well as Asians/others in Arizona register extremely modest representation gaps. Thus, the main representation differences in Arizona are across white education groups and for less educated Hispanics.
Ohio’s very modest representation gaps, overall, do show some clear divergences within the white population. (see Figure 26) White college men and white college women consistently show positive representation gaps, whereas, among noncollege whites, men consistently show the strongest negative representation gaps and women more modestly negative gaps.
Conclusion
This report documents the complex evolution of representation gaps in the United States, starting in 1980 to the present day—where representation gaps are likely of peak magnitude—followed by a projected period of decline to 2060, where they will still be significant but diminished from current levels. Our data indicate that eligibility issues should become progressively less important in the future to representation gaps, with issues of participation—registration and turnout—becoming progressively more important.
Simulations conducted for this report suggest that eliminating participation disparities by race through better election practices and reforms could come very close to solving the representation gap problem in the future—both in presidential and congressional elections—leaving only a small residual attributable to differing race-ethnic age structures. This is a potential—and highly desirable—outcome worth serious consideration by policymakers and politicians.
About the authors
Robert Griffin is a Senior Policy Analyst at the Center for American Progress, focusing on demographic change and American political behavior. He also teaches courses on research methodology, statistics, and public opinion at The George Washington University.
William H. Frey is an internationally regarded demographer, known for his research on urban populations, migration, immigration, race, aging, and political demographics, as well as his expertise on the U.S. census. He is a senior fellow at the Brookings Institution, a research professor in population studies at the University of Michigan, and a co-director of the States of Change project. His new book is Diversity Explosion: How New Racial Demographics are Remaking America.
Ruy Teixeira specializes in the study of demographic change, voting behavior, and public opinion. He is a Senior Fellow at both The Century Foundation and the Center for American Progress and a co-director of the States of Change project. His forthcoming book is The Optimistic Leftist: Why the 21st Century Will Be Better Than You Think. His other books include The Disappearing American Voter; America’s Forgotten Majority: Why the White Working Class Still Matters; The Emerging Democratic Majority; and Red, Blue, and Purple America: The Future of Election Demographics.