Introduction and summary
By the early 1960s, Congress knew that building a more balanced, equitable, and context-sensitive transportation system in urban areas meant that U.S. transportation planning needed a significant overhaul. Urban areas required a stronger voice if the nation was to move away from the top-down, highway-only planning that state highway departments had carried out in the 1940s and 1950s.
The result was the Federal-Aid Highway Act of 1962. Section 9 of this slim, five-page piece of legislation established new planning rules for urban areas. Specifically, the secretary of transportation was no longer permitted to approve any program of transportation projects in urban areas home to 50,000 or more residents, unless the list had been developed through a “continuing comprehensive transportation planning process carried on cooperatively by States and local communities.”1 These cooperative regional transportation planning bodies would be known as metropolitan planning organizations (MPOs). With their establishment, the modern era of transportation planning was born.
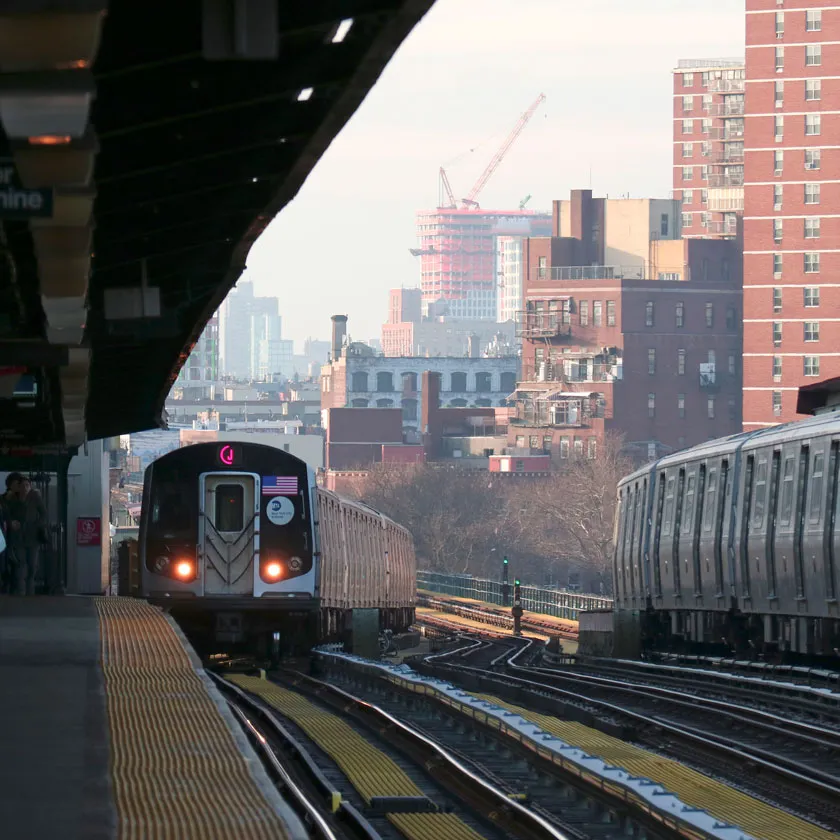
![A subway train pulls into the Flushing Avenue station in Brooklyn.]()
Yet the creation of MPOs has not produced the balanced and sustainable transportation and land use system that Congress envisioned. This is due, in part, to the disproportionate representation of suburban and exurban elected officials on MPOs’ governing boards. The lack of proportional representation for central cities and counties contributes to the fact that transportation dollars still flow overwhelmingly to highway expansion projects instead of public transportation, biking, and walking projects. As a result, the largest metropolitan areas suffer from increasing road and highway congestion, and residents within them are too reliant on single-occupant vehicle travel—especially for commuting trips.
To achieve a truly sustainable, efficient, and equitable surface transportation system, Congress should require MPO board representation to be proportional to the geographic distribution of regional populations. This policy change would substantially increase the number of elected officials from central cities and counties on MPO policy boards. The increased political representation of urban areas would then increase the share of transportation funds flowing to transit, biking, and walking projects.
To achieve a truly sustainable, efficient, and equitable surface transportation system, Congress should require MPO board representation to be proportional to the geographic distribution of regional populations.
Recently, the long-standing geographic imbalance affecting MPO governance has taken on an important degree of political urgency. In November 2023, voters in the city of Houston adopted a ballot measure calling on the MPO to redistribute board seats based on population. If the MPO fails to do so, the measure requires the city to withdraw from the organization and undertake its own transportation planning efforts. To understand how voters in Houston came to support board reform and how the region compares with other metropolitan areas in Texas, this report discusses the history of MPOs and then profiles the MPO board composition and transportation spending plans in Houston, Austin, Dallas-Fort Worth, and San Antonio. These case studies exemplify how disproportionate suburban and exurban representation can skew project priorities in favor of highway expansion over public transportation, biking, and walking. Of the four MPO boards profiled, San Antonio’s has both the highest central city representation and the highest share of transportation expenditures planned for transit. This suggests that board reform could achieve a more balanced and equitable transportation system if adopted in Houston and the rest of the country.
Historical context of MPOs
The change in how transportation planning is conducted came about for several reasons. First, there was growing public anger in cities over losing neighborhoods and businesses to highway construction. This was especially true for low-income communities and communities of color—in particular, Black neighborhoods and business districts—which state officials often targeted for the location of new highways.2
Compared with the wrecking ball of urban renewal, which began with the Housing Act of 1949, the highway construction era was less damaging to affected communities.3 However, this distinction was of little practical political importance. What residents saw was a jarring one-two punch of land clearing financed by federal expenditures, first for renewal projects and then for highways. The harsh results of these efforts eroded public support coming out of World War II for modernizing urban areas seen as shabby, antiquated relics of the 19th century.4
Second, there were federal government officials stretching back to the earliest days of highway planning who understood the need for urban regions to have a strong voice in transportation decisions. In particular, John S. Bragdon, who served as a public works adviser to President Dwight D. Eisenhower, argued that the United States needed “special metropolitan governments” engaged in comprehensive public works planning, including but not limited to transportation.5 The public discontent over urban renewal and highway construction provided an opening for Bragdon and others to push for change. In 1961, the House Committee on Public Works hired Bragdon to assist in developing the planning provisions for what became the Federal-Aid Highway Act of 1962.6
This act was, therefore, an attempt to find a new equilibrium that allowed for expansion and modernization of the nation’s transportation facilities while offering a greater degree of respect and deference to the integrity of the urban fabric. In a message to Congress on April 5, 1962, President John F. Kennedy laid out a vision for future transportation investments that made a clear reference to the need for greater community preservation: “To conserve and enhance values in existing urban areas is essential.”7 Additionally, he asserted that the transportation system needed to provide residents with options beyond driving. President Kennedy stated, “Our national welfare therefore requires the provision of good urban transportation, with the properly balanced use of private vehicles and modern mass transport to help shape as well as serve urban growth.”
These big ideas would find their way into the Federal-Aid Highway Act’s section on metropolitan planning. In the stilted language of federal legislation, MPOs would ensure that transportation plans accounted for their “probable effect on the future development of urban areas.”8 This broad statement was intended to capture the essential connection between transportation facilities and land uses—both commercial and residential. With this design, Congress hoped the boards would have a stronger and better understanding of exactly how future investments would affect local communities and economies.
It is important to recognize the underlying theory of change embedded in Section 9 of the Federal-Aid Highway Act of 1962. With the creation of MPOs, Congress was attempting to alter the political balance of power over transportation planning. Stated differently, Congress wanted future transportation planning to involve greater urban political representation. The formation of MPOs was intended to give elected officials representing urban areas—both within central cities and the surrounding communities—more control over transportation investment decisions. Moreover, the reformed planning process would be continuous, cooperative, and comprehensive, meaning transportation investments would align with economic and industrial development plans rather than running at cross-purposes with them.
Congress wanted future transportation planning to involve greater urban political representation.
Unfortunately, however, the modern era of transportation planning looked similar to the premodern era. First of all, simply creating MPOs did not alter the structure of the federal-aid highway program. The federal government was still very much focused on giving states billions of dollars to complete construction of the interstate highway system. This focus on highways and advancing automobility resulted in steep drops in transit ridership, pushing private service providers—streetcar lines and early bus companies—into bankruptcy. In response, cities took over responsibility for providing transit service, but with transit infrastructure that was often in poor condition, cities faced major capital and operating expenses. They looked to the federal government for assistance; however, there were no federal programs to support transit until the 1960s. It was not until the passage of the Urban Mass Transportation Act in 1964 that the federal government began to provide meaningful transit capital grants.9 And then, as now, the federal expenditures on transit were much smaller than on highways.
One way to think about the Federal-Aid Highway Act of 1962 and the Urban Mass Transportation Act of 1964 is that these reforms were necessary but not sufficient to bend the nation’s massive transportation system in a more balanced, efficient, and context-sensitive direction. The new money available for transit required cities to compete for federal funds for major transit capital projects. And while local political opposition to certain highway segments resulted in a few design changes, overall, the momentum behind completing the interstate system as it was originally designed was simply too great for any locality to alter the system. Although MPOs shifted some influence from states to cities, they still overrepresented the interests of exurban representatives and real estate developers.
Metropolitan planning in the post-interstate era
The next big attempt at reforming transportation planning in metropolitan areas came about through the Intermodal Surface Transportation Efficiency Act of 1991 (ISTEA). By that year, the interstate system had been substantially completed and Congress needed to set new goals that would guide federal investment for the next several decades. Section 1024 of ISTEA made reforms to metropolitan planning with a heavy emphasis on air quality, asset maintenance, and a greater role for transit. Specifically, the act called for MPOs to develop plans that would “minimize transportation-related fuel consumption and air pollution.”10 Congress also wanted MPOs to prioritize projects that would “function as an intermodal transportation system for the State, the metropolitan areas, and the Nation.” 11
Additionally, the act required MPOs to consider 15 planning factors in their decisions—including strategies for the preservation of existing facilities; congestion relief; the connection between transportation and land use; expanding transit; and the “overall social, economic, energy, and environmental effects of transportation decisions.” These planning factors clearly demonstrate a deepening concern for sustainability, social equity, and the share of trips occurring on public transit.
The last major element of ISTEA was its requirement that MPOs serving a population of at least 200,000 residents develop a system to manage congestion. This provision is notable because it states that the strategy should include the “use of travel demand reduction and operational management strategies,”12 reflecting the realization that investment alone would never be sufficient to eliminate congestion. Planners are required to actively try to reduce travel demand—especially during the morning and evening peak commuting periods.
Since the passage of ISTEA, concerns over equity; sustainability—including habitat protection, criteria pollutants under the Clean Air Act, and greenhouse gas emissions; and the reduction of vehicle dependence and driving overall have only increased. For instance, the Infrastructure Investment and Jobs Act of 2021 (IIJA) includes new programs dedicated to emissions reduction and equity, including remediating the harms of the interstate construction era. Moreover, multiple provisions of the IIJA expand the authority of states and metropolitan regions to charge congestion pricing to reduce transportation demand.13 The act also provides record funding to expand intercity passenger rail; improvements to rail made principally for intercity service often substantially improve regional commuter rail service as well.14
Understanding the gaps between the goals and realities of metropolitan transportation systems
Taken together, federal surface transportation legislation, beginning with the Federal-Aid Highway Act of 1962 and extending into the present day, has increasingly sought to create a more balanced metropolitan transportation system. All too often, however, the results have come up woefully short. States and metropolitan regions continue to greenlight multibillion-dollar highway expansions that destroy housing and businesses, increase emissions from mobile sources such as vehicles, and support low-density sprawl and automobile dependence.
This raises an essential question: Why is there such a stark disconnect between the goals Congress set for metropolitan areas and the reality on the ground? The answer is complex since the geography, economy, and history of every region is different. No single policy fix will place metro areas on a guaranteed path to sustainability and equitable, inclusive prosperity. Yet even with this substantial caveat, it’s still worth asking why the gap between stated federal policy goals and metropolitan transportation systems is so large.
Two factors can explain a substantial portion of the disconnect. First, Congress continues to deliver huge amounts of unrestricted highway dollars that may be used for economically unproductive and damaging highway expansion projects. For instance, the IIJA includes $148 billion over five years for the National Highway Performance Program.15 While this level of funding represents a win, the lack of progressive policy strings on these dollars is a problem, as the money may be put toward highway expansion projects.
Second, the policy boards that control MPO planning and project prioritization decisions are typically skewed toward suburban and exurban elected officials. This means that the geographic composition of the board overweighs low-density areas within the metropolitan region—and members from low-density areas are more likely to support auto-centric projects, including major highway expansions, as seen in the examples below.
To better understand why this imbalance is such a problem, it helps to return to the original theory of change that underpinned the 1962 Federal-Aid Highway Act. The creation of MPOs was inherently about politics and making metro regions more of a peer to state departments of transportation (DOTs), rather than just a passive recipient of state investment decisions. In addition, MPOs were intended to allow for much stronger coordination across the many, often competing, municipal jurisdictions that make up a region. The technical planning capacity of MPO staff is therefore an important feature of these regional bodies. However, analytical sophistication is not their essential characteristic or value. What matters more than the ability to conduct advanced traffic modeling or land use analysis is the political makeup of the board that governs the MPO itself. The technical work that MPO staff undertake is directed by the local elected officials who sit on the MPO board. These board members choose the MPO’s executive director and set the direction of its work. When it comes time to compete for state transportation dollars, the project lists that the MPO develops represent the collective priorities of the board members. Therefore, it’s worthwhile to look at the geographic composition of MPO boards to determine if they fairly represent their regions.
MPOs in the 4 largest metropolitan areas of Texas
As of 2023, there are 450 MPOs in the United States.16 Because a review of every MPO is not possible, this report analyzes the geographic distribution of board members for the four largest metro areas in Texas as well as the ratio of highway-to-transit expenditures. The tables showing the distribution of MPO board seats for each region only include those seats that are tied to a specific geography. Board members representing the state DOT, a transit provider, or school district remain unallocated. The report focuses on Texas because the state has an aggressive highway expansion program, including two of the most contentious highway expansion projects in the country.17 The North Houston Highway Improvement Project (NHHIP) would substantially expand Interstate 45 in Houston, and the Interstate 35 Capital Express Central project would expand I-35 in the heart of Austin.
Houston: North Houston Highway Improvement Project
The Texas Department of Transportation (TxDOT) will spend at least $10 billion to construct the NHHIP. This megaproject will expand I-45 from Beltway 8 to Interstate 10 north of central Houston. In addition, it will reroute I-45 through downtown Houston and make improvements to I-10 and U.S. 59/Interstate 69.18
According to the environmental documents TxDOT prepared under the National Environmental Policy Act (NEPA), the NHHIP will cause significant damage to the local community, economy, and environment. Construction of the project will result in the loss of affordable housing, businesses, and schools, among other structures, and numerous structures will be demolished, including 160 single-family residences; 433 multifamily residential units; 486 public and low-income housing units; 344 businesses; five places of worship; two schools/universities; five parking businesses; and 11 other structures.19
![A map of the proposed improvements to I-45 in northern Houston, Texas.]()
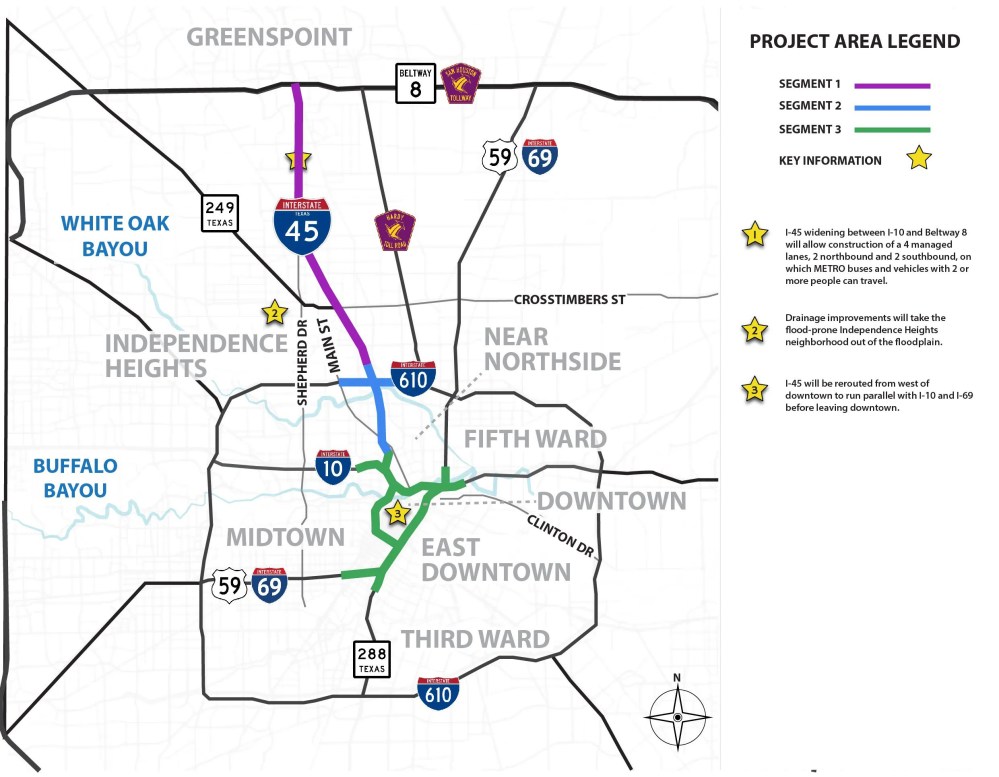 This map shows the location of the NHHIP project, which will widen I-45 in multiple locations to facilitate vehicle trips that will substantially benefit the northern suburban and exurban areas of Houston. Courtesy of the Texas Department of Transportation. Source: Texas Department of Transportation, “NHHIP: Project map,” available at https://www.txdot.gov/nhhip/project-segments/project-map.html (last accessed February 2024).
The NHHIP will worsen air quality within the Houston air shed, causing acute harm to public health within the communities located closest to the expanded facility and the corridors that funnel traffic onto I-45. The public health harms from I-45 will not be evenly distributed. According to research undertaken by Air Alliance Houston, “The expansion design would widen the highway width by as much as 70% in some areas and add several more lanes, bringing at least 26 existing school and daycare campuses within 500 feet of the highway.”20 The expansion project will also displace “medical offices that serve low-income and high-minority communities.”21 Because of the NHHIP and numerous other highway expansion projects within the region, TxDOT expects weekday vehicle miles of travel (VMT) to increase from 170 million VMT to 285 million VMT in the Houston area by 2040.22
While damaging the community near the location of the expansion, the NHHIP will substantially benefit suburban and exurban communities located north of the city of Houston. This is counterintuitive given that almost all the project elements are located within the city itself.
To understand why this megaproject will serve lower-density areas outside the city, it helps to envision a funnel. As new housing and businesses are added on the metropolitan periphery, they generate additional vehicle trips—many of which will occur on I-45 since the highway provides direct access to central Houston. Upstream development around the metropolitan periphery—the wide part of the funnel at the top—causes downstream congestion on arterial highways such as I-45. The local streets, collectors, and arterial signalized roadways gather vehicles and then aggregate them onto limited-access highways such as I-45. As a result, the congestion effects caused by new low-density development occur on legacy facilities that tend to be surrounded by dense housing and business development. This leads to a stark disjuncture between the parts of the region that will lose homes and businesses and suffer dirtier air (central Houston) and those that will see increased economic development (Houston’s exurban periphery). In other words, central Houston will pay for suburban Houston’s housing and business growth.
A review of the elected officials who sit on the Houston-Galveston Area Council (H-GAC), which serves as Houston’s MPO, reveals a stark geographic imbalance that overweighs the metropolitan periphery. The H-GAC covers 13 counties in southeastern Texas with a total population of 7.5 million.23 The city of Houston sits within Harris County, which represents the urban core of the region: According to U.S. census data, Harris County has 4.7 million residents, or 64 percent of the MPO’s total population. Yet the county only accounts for 26 percent of current H-GAC board seats. The remaining 12 counties, meanwhile, contain only 36 percent of the region’s population but control 74 percent of board seats.
MPOs are responsible for producing two major planning products. The first is a long-range transportation plan, which sets goals and lays out an overarching vision for what the regional transportation system should look like in the coming decades. The H-GAC’s long-range plan is called the 2045 Regional Transportation Plan.24 The second planning product is a list of projects for construction in the coming four or five years. This is known as the transportation improvement program (TIP). The TIP for the Houston MPO is heavily skewed toward highway investments. For example, the TIP that covers fiscal year 2023 through fiscal year 2026 includes projects with a total cost of $9.8 billion, with $8.7 billion (88.5 percent) dedicated to highways and only $1.13 billion (11.5 percent) dedicated to transit.25
In 2023, residents of Houston voted in favor of amending the city’s charter in an effort to rectify this immense imbalance. The measure, known as Proposition B, will add language to the city’s charter prohibiting Houston from belonging to an MPO with board representation that is not proportional to the region’s population.26 Proposition B states:
The City may accept or maintain membership in a Council of Government or Metropolitan Planning Organization only if votes on the governing board are apportioned proportionally on the basis of population notwithstanding statutory voting members. However, members representing local governments shall have at least 90% of total votes.27
If the H-GAC does not rework its board to accommodate this demand, the city shall “withdraw its membership from the body if the voting system is not corrected within 60 days.”28
Proposition B passed with 65 percent of the vote.29 This result shows there is deep frustration on the part of city residents with the unequal status quo. Yet whether the city of Houston can legally carry out this charter amendment under federal law is unclear. Moreover, withdrawing from the H-GAC would come with an uncertain but significant financial cost, since the city would need to recreate much of the technical planning capacity embedded in the H-GAC. These challenges point to the need for a national mandate that board seats be distributed proportionally to the regional population.
Austin: I-35 Capital Express Central project
TxDOT will spend at least $4.5 billion to add two nontolled high-occupancy vehicle lanes to 8 miles of I-35 that run through the heart of Austin. According to TxDOT, the existing highway “does not adequately accommodate current and future travel demand.”30 Once the additions are completed, some sections of the highway and parallel frontage roads will span more than 540 feet, carving an even larger gash through the middle of the city than currently exists.
Just as with I-45 in Houston, the expansion of I-35 in Austin is in actuality much more about serving the travel demand created by low-density growth on the metropolitan fringe. Since 2000, the population of the Austin metro area has nearly doubled to 2.4 million people31—and the region is expected to add another 1.2 million residents by 2040.32 In addition to the 8 miles within the center of Austin, TxDOT is also expanding 11 miles of I-35 to the north and 12 miles to the south. In total, the state is widening this arterial highway over a 31-mile stretch due to rapid regional population growth.33
![A diagram showing an overhead view of the proposed additions of high-occupancy vehicle lanes to I-35 in Austin, Texas.]()
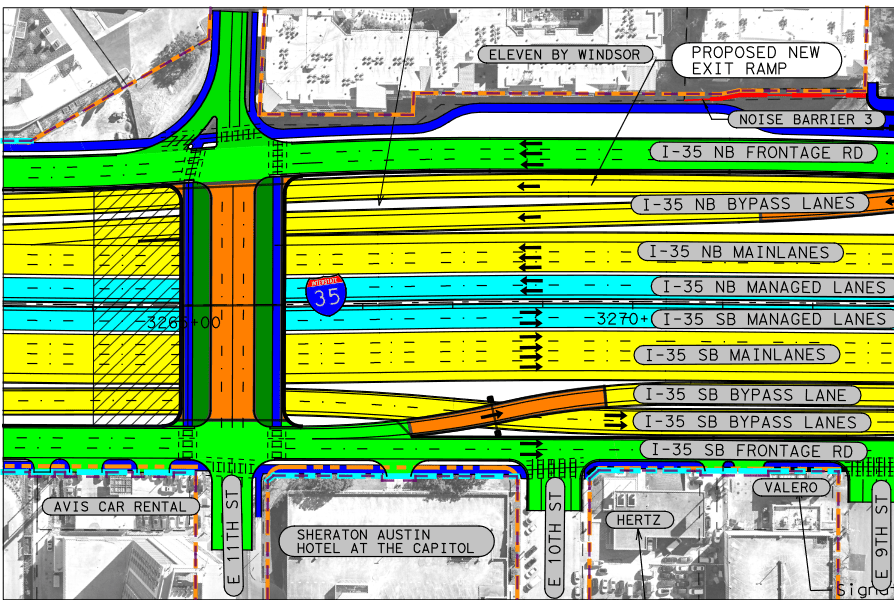 This overhead view shows what I-35 will look like once high-occupancy vehicle lanes are added. The project will deepen automobile dependence, increase emissions, and ultimately undermine the city of Austin’s goal of shifting more commuter trips to biking, walking, and transit. Courtesy of the Texas Department of Transportation. Source: Texas Department of Transportation, “Appendix C: Typical Sections” (Austin, TX: 2023), available at https://my35capex.com/wp-content/uploads/2023/08/APPROVED-FEIS-ROD_Appendix-C-Typical-Sections_2023-08-14.pdf.
This expansion undermines the city’s ability to shift its mobility balance from automobile dominance to a more sustainable mix. In 2019, the city of Austin adopted a strategic mobility plan that sought to increase the share of commuting trips made by public transportation, biking, and walking. A central goal of this plan was to substantially reduce “dependence on driving alone” for commuting trips.34 To achieve this vision, the city put forward several “transit-intensive pathways.”35 Yet a review of this TIP reveals a stark modal imbalance, with highways garnering nearly the entire budget. In fact, highway projects in the Austin area are slated to receive 92 percent of all spending while transit projects will receive just 8 percent.36While the geographic imbalance in the Austin area is not as pronounced as in Houston, the modal imbalance is equally jarring.
Consider the geographic makeup of the Capital Area Metropolitan Planning Organization (CAMPO) policy board, however, and the strong regional support for the widening begins to make sense. Austin sits within Travis County, which is the heart of the metro region. The county holds 54 percent of the total population and has a density that is more than four times greater than the rest of the area the MPO covers; however, representatives from its communities hold only 45 percent of the board seats. By comparison, the area outside Travis County contains 46 percent of the total population, and elected officials from that area hold 55 percent of the board seats. Improving the geographic balance of the MPO board would likely improve the modal balance for capital expenditures between highways and transit, biking, and walking to bring the city closer to the vision set forth in its strategic mobility plan.
Dallas-Fort Worth: Southeast Connector project
TxDOT will spend at least $2.1 billion in the Dallas-Fort Worth area to construct a series of functionally connected widening projects known as the Southeast Connector.37 This project involves expanding portions of Interstate 20, Interstate 820, and U.S. 287 in the portion of the metro area where Fort Worth, Arlington, Forest Hill, and Kennedale come together. According to TxDOT, “This project is needed because (a) the capacity of I-20, I-820, and US 287 within the project limits is inadequate to meet current and future traffic volumes, resulting in congestion, reduced mobility, and an unacceptable Level of Service.”38
![A map showing proposed highway improvements in the Dallas-Forth Worth area.]()
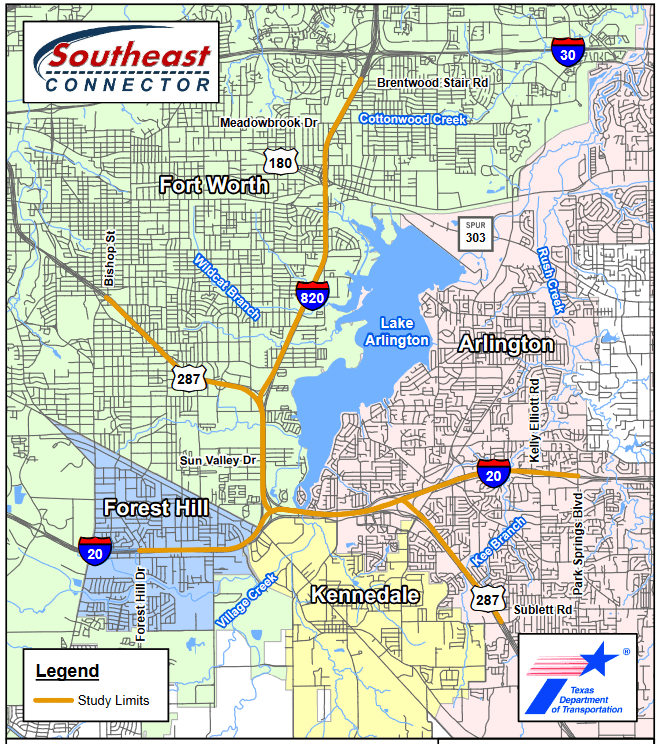 This map shows the Southeast Connector, which includes a series of functionally connected widening projects at the intersection of I-20, I-820, and U.S. 287 that will deepen automobile dependence. Courtesy of the Texas Department of Transportation. Source: Texas Department of Transportation, “Final Environmental Assessment Southeast Connector, Fort Worth District” (Austin, TX: 2020), available at https://ftp.txdot.gov/pub/txdot/get-involved/ftw/southeast-connector/090320-final-ea.pdf.
What is notable about this statement is that TxDOT presents it as though the only solution to congestion and vehicle delay is expansion. Additionally, TxDOT did not consider transit and more sustainable land use alternatives. The environmental assessment states, “Automobile travel is the most common mode of transportation that community members use within the project area.” There is no doubt that this is true—but building the Southeast Connecter will ensure that driving remains the dominant mode of transportation for decades to come. The assessment also notes that construction will result in the loss of 23 residential homes and 18 commercial properties, in addition to other adverse impacts, including additional air pollution from increased driving.39
Similar to in Austin, the geographic balance of the North Central Texas Council of Governments (NCTCOG) governing board favors low-density portions of the region. The city of Dallas sits within Dallas County, while Fort Worth sits within Tarrant County. Taken together, these two anchor counties hold 58 percent of the regional population yet control only 47 percent of the NCTCOG board seats. And in the coming years, the Dallas-Fort Worth area is planning to spend 92 percent of its funding on highways and only 8 percent on transit.40
San Antonio: Zarzamora Street project
San Antonio is the only major metropolitan area in Texas that plans to spend more than a single-digit percentage of its TIP budget on transit, biking, and walking projects. According to its current TIP, the Alamo Area Metropolitan Planning Organization (AAMPO) will spend 26 percent of its total budget on public transportation projects. One example worth highlighting is the Zarzamora Street project, which is focused on improving pedestrian and cycling access and safety along North Zarzamora Street from Fredericksburg Road to Southwest Military Drive near I-35. Critically, the project includes a road diet: AAMPO states the project involves: “Pedestrian safety improvements, including sidewalks and signal upgrades, bicycle lanes, and multimodal enhancements for buses throughout the corridor” that will reduce “from 6 lanes with CLTL to 4 lanes with CLTL from Nogalitos St to Loop 13.”41
Two characteristics of the AAMPO governing board are worth noting. First, Bexar County, which includes San Antonio, holds a strong majority of the total board seats, at 69 percent. Second, Bexar County contains 83 percent of the AAMPO’s total population. This means that the highest-density portion of the metropolitan area dominates decision-making. While not dispositive, the fact that the central urban area has control over the San Antonio MPO seems strongly correlated with the fact that the region has the highest planned expenditure on transit of Texas’ large urban areas.
The fact that the central urban area has control over the San Antonio MPO seems strongly correlated with the fact that the region has the highest planned expenditure on transit of Texas’ large urban areas.
Conclusion
The establishment of MPOs with the passage of the Federal-Aid Highway Act of 1962 was intended to provide elected officials representing urban areas a greater voice and control over decisions regarding transportation planning and project prioritization. Over time, federal legislators have placed increasing importance on the creation of a balanced and sustainable transportation and land use system—especially within large metropolitan areas. Yet actual results have been mixed due, in part, to the outsize power of suburban and exurban elected officials in the governance of MPOs. It’s time for Congress to reform metropolitan transportation planning so that board seats are distributed proportionally to area populations. Central cities and counties should have board representation that matches their share of the total regional population. Data from the largest metropolitan regions in Texas show that achieving greater geographic balance should push expenditures in a more sustainable direction.