Introduction and summary
The goal of the U.S. transportation system is to safely, sustainably, and cost-effectively facilitate the movement of people and goods. When done right, infrastructure investments produce broad-based prosperity for American workers and firms. Conversely, poor project selection can increase local pollution burdens, create barriers to opportunity, and produce unproductive assets that serve as a drag on economic growth. In short, simply increasing federal spending is not sufficient. New federal dollars must be paired with policy reforms to ensure that funding from Washington yields the greatest social, environmental, and economic return on investment.
Unfortunately, federal infrastructure policy and programs have not modernized to meet the five major challenges facing the U.S. transportation system: major injuries and fatalities, climate change, congestion, unequal economic opportunity, and crumbling facilities. Running through each of these five areas is the need to ensure that federal transportation policy promotes inclusive prosperity and social equity. This means accounting for the discriminatory legacy of past investments that resulted in geographic dislocation, reduced economic opportunity, and poor community health. To remediate these harms, the U.S. Department of Transportation (DOT) should target funding to those communities facing the greatest need. Moreover, rules that govern state and local planning as well as environmental review should promote transparent decision-making and robust community involvement to the greatest extent possible.
Continuing with a business-as-usual approach will not result in progress on these pressing challenges. First, the surface transportation system is remarkably dangerous. In 2018, accidents involving motor vehicles killed 36,560 people. The risks are especially high for pedestrians and cyclists. In the past 10 years, pedestrian and cyclist fatalities have increased by 50 percent,1 while over this same time, all other motor vehicle fatalities have increased by less than 1 percent.2 Moreover, pedestrian fatality rates differ substantially by race and ethnicity. According to research from the Centers for Disease Control and Prevention, from 2001 to 2010, pedestrian fatality rates for Black and Hispanic men were more than twice the rate for white men.3
Accident trends for commercial vehicles are also on the rise. Since 2009, fatalities from accidents involving large trucks and buses have increased by 38 percent.4 According to research by the National Highway Traffic Safety Administration, fatalities, injuries, and property damage from motor vehicle accidents cost the economy $242 billion in 2010 alone.5 Improving safety will require regulatory reform, system design changes, and the prioritization of safety over vehicle speed.
Second, transportation is the largest source of greenhouse gas (GHG) emissions in the United States.6 Beyond GHGs, motor vehicles emit toxic chemicals that cause “cancer, birth defects, neurological damage, damage to the body’s natural defense system, and diseases that lead to death.”7 According to the Fourth National Climate Assessment, “More than 100 million people in the United States live in communities where air pollution exceeds health-based air quality standards.”8 To improve community health and avoid the most severe effects of global warming, the United States must achieve net-zero emissions by 2050. This will mean adopting GHG reduction as a national policy goal and structuring federal programs and regulations to reward states that decouple mobility from fossil fuels, encourage sustainable land use, and provide residents with safe and affordable transportation options beyond driving.
Third, growing roadway congestion costs the economy more than $165 billion each year in lost productivity and wasted fuel.9 Since the 1950s, transportation planning has overwhelmingly focused on expanding highways to move more and more—typically single-occupant—vehicles. Not surprisingly, a system built to facilitate driving requires most people to drive to meet their daily needs. Today, driving alone accounts for 76 percent of all commuting trips.10 This approach to land use and mobility is not only deeply unsustainable and inequitable but also cost ineffective. Expensive new highway capacity—typically added to the exurban fringe of growing metropolitan regions—locks in more driving and provides only modest travel-time savings that quickly disappear. Reducing congestion will require providing residents with affordable and accessible transportation options, including transit, biking, and walking as well as more roadway pricing and travel demand management.
Fourth, economic growth since the end of the Great Recession has been highly uneven, with many regions facing persistent economic challenges. And within more dynamic regions, pockets of persistent hardship remain. The onset of the coronavirus pandemic has only exacerbated these regional differences and increased the urgency of using sustained, robust infrastructure spending to create inclusive prosperity. However, spurring local economic growth is stymied, in part, by rules that make it hard to hire locally as well as the fact that most federal funds flow to state DOTs. This means that local and regional officials have little control over investment decisions.
Fifth, many infrastructure assets—from major highways to public transit and passenger rail systems—have come to the end of their useful life and need to be repaired, reconstructed, or replaced. For instance, transit agencies around the county have a $98 billion deferred maintenance backlog.11 The maintenance backlog for highways is estimated at $441 billion.12 Yet federal funds flow to states as a loosely structured block grant, with little accountability for ensuring critical assets remain in a state of good repair. Additionally, the political incentive for elected officials is to prioritize the construction of new facilities rather than repair existing assets. Focusing on new construction can also undermine social equity since legacy assets in need of serious repairs or reconstruction are often located in communities with stagnant or declining economic activity and population. The need to address growth can become a self-defeating rationale, as struggling areas fall further and further behind in the absence of adequate maintenance.
The coronavirus pandemic has heightened the need for major federal investments in infrastructure to spur long-term economic growth. This report provides regulatory and policy proposals to address each of the five major challenges. In addition, the report offers proposals to ensure that every private sector employer that receives federal infrastructure funding pays a decent wage, provides quality benefits, and respects workers’ right to join a union. Taken together, these reforms will leverage the authority and funding that flows through DOT to advance inclusive, equitable, and sustainable prosperity.
Ensuring safety across modes of transportation
Ensuring the safe movement of people and goods is a core mission of the Department of Transportation. And improving safety for vulnerable users is an essential component of transportation equity because accidents and fatalities are not evenly distributed.13 Research shows that poverty is a significant risk factor for pedestrian fatalities.14 Nonmotorized transportation is often seen as something for children or merely a weekend recreational activity. This view misses the reality that more than 10.3 million households, or 8.5 percent of occupied housing units, lack access to a vehicle, and another 39 million have only one vehicle.15 For these households, biking, walking, and public transportation—which requires people to walk at the start and end of every journey—are essential means of commuting to work and meeting other daily needs. Yet the transportation system all too often fails these users either by design or by neglect. According to research by the Federal Highway Administration:
[D]esigning streets with these users in mind—sidewalks, raised medians, turning access controls, better bus stop placement, better lighting, traffic calming measures, accessible sidewalks, curb cut outs, accessible signage for sensory and cognitive disabilities, and other advances for travelers with disabilities—improves pedestrian, bicyclist, and motorist safety.16
In short, DOT should prioritize improving safety for the most vulnerable roadway users, including pedestrians, cyclists, the elderly, and people with disabilities. Additionally, the department has broad authority to improve: 1) infrastructure facility design and operations; 2) vehicle design, including advanced onboard safety technology; and 3) commercial carrier operations. The following are specific steps that DOT leadership should take to improve safety as well as new policy proposals.
Existing rules, guidance, and directives
- Eighty-fifth percentile rule: Speeding is the primary cause of roughly one-third of all motor vehicle fatalities and a contributing factor in many more.17 Lowering vehicle speed reduces both the frequency and severity of crashes and injuries.18 The Federal Highway Administration provides technical standards and guidance on how to design and control vehicle movements with the Manual on Uniform Traffic Control Devices for Streets and Highways (MUTCD), which is incorporated by reference with U.S. Code Title 23, Section 109(d), Code of Federal Regulations, Part 655.603. While states retain the final authority to set speeds, the MUTCD is a foundational text for the civil engineering profession. The MUTCD provides states with the following speed limit guidance: “When a speed limit within a speed zone is posted, it should be within 5 mph of the 85th-percentile speed of free-flowing traffic.”19 Importantly, this guidance is based on driver preference as opposed to safety and roadway context. According to the Texas DOT, the 85th percentile rule responds to drivers’ “desire to reach their destination in the shortest possible time.”20 Yet the fact that most drivers will hit a certain speed is not a sound basis for setting speed limits. The 85th percentile rule is especially dangerous in areas with pedestrians, cyclists, and other nonmotorized users. The Federal Highway Administration should amend the MUTCD to strike the 85th percentile rule and replace it with guidance that prioritizes roadway user safety with a special focus on nonmotorized users over the travel-time desire of drivers.
- Level of service: Under U.S. Code Title 23, Section 109, the secretary of transportation has incorporated by reference the American Association of State Highway and Transportation Officials’ “A Policy on Geometric Design of Highways and Streets.” The guide prioritizes designing roadways around a “level of service,” which is a qualitative and subjective design concept that “characterizes the operating conditions on the facility in terms of traffic performance measures related to speed and travel time, freedom to maneuver, traffic interruptions, and comfort and convenience.”21 The guide states that “designers should strive to provide the highest level of service practical.”22 The goal of transportation investments cannot simply be to increase vehicle speeds. The design choices that maximize vehicle level of service undermine nonmotorized access and safety. To the greatest extent possible, surface transportation performance should measure people—not vehicles. For instance, person throughput is a much more accurate and valuable measure of roadway productivity than vehicle counts or vehicle level of service. This distinction is especially important in metropolitan regions. A facility designed to support all users will increase person throughput while slightly decreasing vehicle speeds. The result is increased roadway safety and productivity. The secretary should adopt guidance that clarifies that planners should prioritize designing facilities around people.
- Hours of service (RIN 2126-AC19): The Federal Motor Carrier Safety Administration proposes to provide commercial drivers “greater flexibility” with federal hours-of-service (HOS) requirements. The federal government regulates commercial vehicle operations and rest periods to promote roadway safety. Research shows that driver fatigue results in slower response times, attention failures, and poor decision-making.23 The proposed rule would weaken HOS standards, increasing the likelihood of dangerous driver fatigue. For instance, it would extend the maximum duty period for certain commercial drivers from 12 hours to 14 hours.24 This and other changes are being promoted under the banner of “efficiency”—not safety or sound science. The HOS changes should be repealed.
- Speed limiting devices (RIN 2126-AB63): The proposed rule would require vehicles with a gross vehicle weight of more than 26,000 pounds to be equipped with a speed limiting device. According to research by the federal government, each year, there are more than 1,000 fatalities from crashes involving heavy-duty vehicles with a gross vehicle weight of more than 26,000 pounds. The proposed rule would decrease annual fatalities involving heavy-duty trucks by more than 200 and major injuries by more than 4,600.25 All heavy trucks have these devices installed, but they are not necessarily activated. The proposed rule has been published and the comment period completed. The speed limiting rules should be promulgated.
- Passenger locomotive recorders (RIN 2130-AC5): The Fixing America’s Surface Transportation (FAST) Act requires the Federal Railroad Administration (FRA) to promulgate a rule to require all intercity and commuter rail providers to install one inward and one outward video-recording device in each locomotive. The recorders would provide invaluable data to support crash investigations and best practices for rail operations. The FRA published a notice of proposed rule-making in November 2018 but has not completed a final rule. The locomotive recorder rule should be promulgated.
- Positive train control: This technology prevents “train-to-train collisions, overspeed derailments, incursions into established work zone limits, and movements of trains through switches in the wrong position.”26 Originally, Congress mandated all freight and passenger railroads implement this technology by December 31, 2015. The current deadline is December 31, 2020. This should not be extended—even given work disruptions due to the coronavirus. Fully implementing positive train control would save carriers an estimated $4 billion and result in roughly 40 fewer significant accidents involving freight or passenger railroads each year.27
New rules and guidance
- Vehicle standards: Rapid technological advancements in computer processing and sensors, combined with falling prices, have allowed automobile manufacturers to incorporate more safety features on new models. New vehicle safety technologies can reduce vehicle accidents, including with pedestrians and other nonmotorized users. Unfortunately, according to research by the Government Accountability Office (GAO), only “60 percent of the model year 2019 vehicles offered in the United States by 13 automakers had pedestrian crash avoidance technologies as standard or optional equipment.”28 To date, the National Highway Traffic Safety Administration has not incorporated pedestrian safety tests into its New Car Assessment Program. This is unacceptable; as the GAO notes, “On average, 17 pedestrians a day died in motor vehicle crashes in 2018, up from 12 a day in 2008.”29
The secretary of transportation should include pedestrian safety tests as part of the New Car Assessment Program. Additionally, the secretary should promulgate a rule requiring that all new vehicles include both passive pedestrian crash-severity-reduction design features and active crash avoidance technology with very low failure rates.
- Complete streets: The “Urban Street Design Guide” published by the National Association of City Transportation Officials (NACTO) provides dozens of excellent roadway and intersection design templates to safely accommodate and support pedestrians, cyclists, and other nonmotorized users of all ages and ability levels.30 Section 109 of U.S. Code Title 23 sets standards for roadway design. For the design of roadways included in the National Highway System (NHS), U.S. Code Title 23, Section 109(c)(D) provides the secretary of transportation the authority to incorporate by reference “any other material that the Secretary determines to be appropriate.” The secretary should adopt and promote the NACTO design guide as an authorized standard for roadway and intersection design.
New policy
The surface transportation authorization bill FAST Act is set to expire on September 30, 2020. The next authorization bill should include the following policy provisions:
- Amend U.S. Code Title 23, Section 150 to add a new performance measure to track, by functional classification, the share of housing units and roadways that have dedicated nonmotorized infrastructure facilities, including, but not limited to, sidewalks, crosswalks, bike lanes, and crossings that comply with Americans with Disabilities Act (ADA) guidance.
- Amend U.S. Code Title 23, Section 150(c)(4) to include a specific performance measure for nonmotorized users. Additionally, states and regions should be prohibited from setting negative performance targets. At a minimum, states and regions should be required to set level or improving performance for serious injuries and fatalities.
- Establish a competitive pilot program that would fund data collection, planning, capital costs, and enforcement for innovative strategies aimed at traffic calming as well as Vision Zero programs to improve pedestrian safety.
- Authorize the collection of a 1 1/2 pennies-per-gallon excise tax on diesel fuel used by Class I freight railroads to increase funding for rail-highway crossing safety projects. The tax would yield roughly $51 million annually.31
- Oppose any increase in the truck size and weight limitations set by U.S. Code Title 23, Section 127. Research shows that heavier trucks result in more rapid deterioration of highways since heavier axle loading has an exponentially negative effect on roadway conditions. In fact, “[A]n increase in axle weight of 10 percent will increase pavement damage by about 46 percent.”32
- Ensure reviewability. Federal law requires states and metropolitan regions to develop long-term transportation plans that consider 10 planning factors, including the “safety of the transportation system for motorized and nonmotorized users.”33 Yet the “failure to consider any factor specified in paragraphs (1) and (2) shall not be reviewable by any court under this title.”34 This provision should be amended so that failure to adequately consider the safety of motorized and nonmotorized users is subject to legal review.
Every day, Americans take more than 1.1 billion trips, traveling roughly 11 billion miles.35 Making sure everyone—especially the most vulnerable user—is safe is an essential mission of DOT. The department should leverage its full legal authority and funding allocations to ensure that the design and operations of transportation systems are safe and accessible for everyone, regardless of age or ability level.
Reducing emissions and adapting to climate change
In the United States, aircrafts and on-road vehicles emit more than 1.73 billion metric tons of carbon dioxide equivalent each year.36 If these planes and vehicles were a country, they would be the fourth-largest emitter on Earth.37 Achieving substantial emissions reductions in the coming years, the Department of Transportation must push for a combination of emissions-control regulations and changes to the built environment that reduce the need to drive. Contrary to historical logic, vehicle miles traveled (VMT) growth is not necessary to sustain robust and inclusive gross domestic product growth. In fact, data from the U.S. Department of Energy shows that economic growth began to decouple from driving around the year 2000.38 To avoid the worst effects of climate change, the United States must adopt aggressive policies to achieve net-zero carbon emissions from the mobile sector by 2050. The following steps would help put the U.S. transportation sector on this path.
Existing rules, guidance, and directives
- CAFE standards: In August 2012, the Obama administration finalized a historic agreement to increase vehicle fuel efficiency standards to 54 1/2 miles per gallon by model year 2025.39 In March 2020, however, the Trump administration promulgated a new rule that substantially weakens light-duty vehicle emissions standards, known as the corporate average fuel economy (CAFE) standard.40 The new rule would reduce fuel efficiency by 27 percent, resulting in more than 80 billion additional gallons of gasoline consumed by the vehicles produced during the period covered by the rule.41 This rule should be repealed and a new CAFE standard set, based on climate science and the rapid pace of technological advancement in the light-duty vehicle sector.
- Climate preparedness: Executive order 13653, “Preparing the United States for the Impacts of Climate Change,” should be reinstated, along with Federal Highway Administration order 5520. Taken together, these orders would help to “to develop, prioritize, implement and evaluate risk-based and cost-effective strategies to minimize climate and extreme weather risks and protect critical infrastructure using the best available science, technology and information.”42
New rules
- Greenhouse gas: The surface transportation bill Moving Ahead for Progress in the 21st Century Act (MAP-21) established a performance management framework that authorizes DOT to create a performance measure for mobile-source emissions, including GHGs. Specifically, U.S. Code Title 23, Section 150(c)(5)(B) authorizes a measure for “on-road mobile source emissions.”43 This statutory language—combined with the Environmental Protection Agency’s (EPA) 2009 endangerment finding44 and the U.S. Supreme Court’s 2007 ruling that “greenhouse gases are air pollutants covered by the Clean Air Act”—provides DOT with the authority to promulgate a rule requiring states and metropolitan regions to track and set performance targets for GHGs and other harmful emissions from the mobile sector.45 Furthermore, states should be required to set targets that make accelerating progress toward net-zero mobile-source emissions by 2050. The pace of statewide GHG reductions from the mobile sector should reflect both expectations of technological advancement and population growth, provided that all state emissions-reduction schedules achieve the net-zero mandate by 2050.
- Climate risk assessment: Rising sea levels, increased wildfire severity and frequency, and increased temperatures due to global climate change threaten the property functioning of the transportation system. States and regions should be required to identify those facilities that face the greatest risk from climate change. There is ample statutory authority to require such an assessment. For instance, U.S. Code Title 23, Section 109 mandates that highway projects be designed and constructed to “preserve and extend the service life of highways and enhance highway safety.”46 Additionally, U.S. Code Title 23, Section 116 allows federal funds to support activities that the secretary of transportation determines offer a “cost-effective means of extending the useful life of a Federal-aid highway.”47 Identifying at-risk facilities is a necessary first step to reconstructing and maintaining the transportation system in response to the stresses of climate change-induced extreme weather.
New policy
- Highway new starts: Federal law currently allows states to plan and construct highway capacity expansion projects without considering their long-term effects on GHG emissions and climate change. States should be required to model the estimated total GHG emissions from new highway capacity over a 30-year period and then develop a plan to fully offset those emissions. The offsets could come from mobile or stationary sources as well as natural carbon offsets, including greenfield preservation and reforestation, among others.
- Emissions-reduction bonus: The distribution of federal-aid highway funding continues to reward states based on certain system factors, including the number of lane miles of interstate and other federal-aid highways as well as VMT, among others.48 States continue to receive highway funding for making project selection decisions that encourage highway expansion and more driving. This approach to distributing federal funding is antithetical to avoiding the worst effects of climate change. States should be rewarded for decoupling economic production from driving and GHG emissions. For this reason, the federal-aid highway program should be amended to establish a GHG-reduction bonus program. The program would reward states that meet or exceed their mobile-source GHG-reduction target by redistributing a portion of National Highway Performance Program funds from states that have failed to meet their target.
- Scenario planning: Require every state and metropolitan planning organization covering a region of more than 250,000 in population size to undertake scenario planning as part of its long-range transportation planning process.
- Transit New Starts funding and selection: Set a minimum federal share of eligible project costs at 60 percent and a maximum share of 80 percent for projects that include state funding participation and up to 85 percent for projects that lack state participation. In addition, the project evaluation and rating process for new fixed guideway transit capital projects includes a score for land use. Currently, land use accounts for 16.7 percent of the project justification score. This share should be increased to 30 percent.
- Electric vehicle charging: Establish a robust program to fund the construction of electric vehicle charging points. Additionally, U.S. Code Title 23, Section 111 should be amended to permit states to install or contract for the installation and operation of commercial charging stations at public rest areas on the interstate system and other federal-aid highways. This allowance should also extend to charge points at park-and-ride lots located within interstate right of way.
- Transit vehicles: Increase funding for the Low or No Emission Vehicle program at the Federal Transit Administration to $500 million a year. Furthermore, beginning in 2025, any buses purchased or leased with federal funds should be zero-emissions vehicles. Transit service providers should be allowed to petition the Federal Transit Administration for a limited waiver if they can demonstrate through technical analysis that a service component or route cannot be served with zero-emissions technology.
- Airport revenues and emissions: The passenger facility charge (PFC), which is a tax levied by airports on each enplaning passenger and a substantial source of airport revenue, should be raised to $8 and indexed to inflation. In 2019, airports collected a total of $3.6 billion in PFC revenues.49 All ancillary revenues, including baggage fees, cancellation fees, food service, and other passenger charges should be subject to the 7.5 percent ticket tax rate. In 2018, airlines collected more than $15.9 billion in ancillary revenues.50 If these revenues were subject to the ticket tax rate, the Airport and Airway Trust Fund (AATF) would receive approximately $1.2 billion in additional revenue each year.51 These additional revenues should be used, in part, to help airports achieve net-zero GHG emissions by 2050.
- Aviation emissions transparency: Commercial air carriers should be required to provide every passenger with an estimate of the total GHG emissions for their flight. This transparency would allow individuals to make informed decisions about the length and frequency of air travel as well as how much in carbon offsets they would need to purchase to cancel out the GHG effects of their air travel.
- Air carrier emissions: Beginning in 2025, all air carriers should be required to offset the carbon emissions from their domestic flights. DOT should work with the EPA to develop an accurate and transparent method for carbon offset validation and accounting. Additionally, Congress should establish a renewable fuels mandate for the aviation industry. The mandate would require carriers to use a fuel with a 15 percent renewable blend by 2025. The renewable share would rise to 100 percent by 2050. A portion of the additional AATF revenues raised by taxing ancillary passenger charges could be used to reimburse carriers for some of the cost of renewable fuels during the early years of the mandate. Finally, Congress should establish a joint Federal Aviation Administration and Department of Energy credit facility to provide low-cost loans or loan guarantees to companies engaged in the production, transfer, storage, and delivery of renewable aviation fuels.
- Reviewability: Federal law requires states and metropolitan regions to develop long-term transportation plans that consider 10 planning factors. Yet states and regions are not required to consider how their plans will affect mobile-source GHG emissions. Moreover, “The failure to consider any factor specified in paragraphs (1) and (2) shall not be reviewable by any court under this title.”52 Statewide and metropolitan planning should be amended to include GHG emissions as a planning factor. Failure to consider GHG emissions should be subject to legal review.
Climate change is a social, economic, and environmental emergency. The United States must achieve net-zero carbon emissions by 2050. Given that the transportation sector is now the leading source of GHG emissions in the United States, DOT must make reducing emissions an essential priority in the coming years.
Alleviating congestion
The early days of interstate construction unleashed large transportation efficiency gains—especially for trips between regions and for farm-to-market access. Yet continuing to add highway capacity to the current system is both expensive and a poor investment. Decades of research has shown that the phenomenon of induced demand means that new capacity provides temporary travel-time savings that are quickly washed away as drivers fill the space until delay returns to pre-construction levels.53
Furthermore, ride-hailing and the emerging technology of autonomous vehicles will not solve the problem. Research shows that ride-hailing increases total VMT and congestion while reducing transit trips. Ride-hailing service drivers must deadhead, or travel without passengers, between fares, adding to regional VMT.54 Moreover, the same density that gives rise to transit demand is a rich source of customers, leading to a high volume of ride-hailing vehicles and short wait times. One study of New York City found that in 2016 alone, ride-hailing added 600 million miles of driving.55
Autonomous vehicles will provide some operational improvements, including running at higher speeds with shorter clearance distances between vehicles. This improvement will provide a one-time bump, not an ever-increasing benefit. The vehicle throughput improvements on signalized roadways will be minimal. As stated in a previous Center for American Progress report:
Even if autonomous vehicles could safely travel at 60 miles per hour on a signalized arterial, such an operational change would lead to jarring incongruity with the surrounding residential and commercial land uses. This would likely lead to speed limits on AVs [autonomous vehicles] that largely mirror current speed limits in cities, meaning that the capacity bump on signalized arterials is likely to be modest. And limited-access highways and signalized arterials are connected. No matter how many AVs a limited-access highway may be able to carry, those vehicles must eventually exit onto surface roadways.56
When considering the potential of any new technology to alleviate congestion, it’s important to remember this maxim by transit consultant Jarrett Walker: “Technology never changes geometry.”57 Trying to push ever larger numbers of rolling metal boxes through constrained urban space is a losing proposition. Roadway pricing and providing people with affordable, safe, and sustainable alternatives to driving is the best approach to keep dynamic regions moving and growing.
In aviation, only a handful of airports are capacity constrained. According to the Federal Aviation Administration, there are 519 commercial-service airports with at least 2,500 passenger enplanements each year. Only 15 airports are capacity constrained, which is defined as sustained passenger demand at 85 percent or greater of airport capacity.58 In 2018, these 15 airports accounted for 92 percent of all passenger enplanements.59 Thus, aviation congestion is a problem affecting only a handful of major hub airports.
Existing rules and guidance
- Congestion performance measure: The current congestion performance measure for the Congestion Mitigation and Air Quality Improvement program is based on peak-hour excessive vehicle delay. The focus on vehicle delay is problematic because it treats the delay faced by a bus full of riders as equivalent to a single-occupant vehicle. States and regions should focus on making investments that increase the person throughput and productivity of arterial roadways. For this reason, the congestion measure should weight transit vehicle delay more heavily than light-duty vehicles. For instance, states and regions should be rewarded and encouraged to replace on-street parking—which is, essentially, private property storage in an otherwise active public right of way—with dedicated bus lanes to improve the efficiency and productivity of the surface system.
New policy
- Roadway pricing: States and regions have broad authority to toll federal-aid highways as part of construction projects, provided that the number of toll-free lanes “is not less than the number of toll-free non-HOV lanes, excluding auxiliary lanes, before such construction.”60 U.S. Code Title 23, Section 129(a)(3)(v) allows states to use surplus toll revenues for “any other purpose for which Federal funds may be obligated by a State under this title,” provided that the tolled facility is adequately maintained and all contractual obligations have been met in the case of a public-private partnership (P3). Subsection (v) should be eliminated and replaced with a requirement that a state use any surplus toll revenues to provide affordable transit service on or along the corridor, including park-and-ride lots, commuter bus service, or other local transit service. This requirement should apply to highway tolling projects or portions of a larger project that lies within the metropolitan statistical area boundary for any region more than 200,000 in size. In short, a state should not be permitted to use surplus toll revenues for general programmatic funding until residents who live in proximity to the newly tolled facility have been provided with an affordable and equitable transportation alternative to driving. An excellent example of this approach to highway finance is the park-and-ride and commuter bus component of the Interstate 66 P3 in northern Virginia.
- Performance measures: The following three performance measures would all guide states and regions to make project selection decisions that increase transportation choice and reduce roadway congestion:
- Roadway productivity: Establish a performance measure that shows the person throughput—both motorized and nonmotorized—on roadways classified as principal arterials.
- Transit accessibility: Establish a performance measure that shows the share of households, jobs, and other essential destinations that are accessible by public transportation within a given time frame—typically 45 minutes. This could also include the average household distance to a transit stop and the average frequency of service.
- Per capita VMT: Establish a performance measures that shows annual per capita VMT. States and regions should be required to set performance targets that either hold per capita VMT constant or decrease it.
- Passenger rail: Establish a passenger rail account within the Highway Trust Fund with $8 billion annually to support capital and operations for Amtrak as well as capital expansion grants for high-speed intercity service. Additionally, states should be allowed to use their National Highway Performance Program funds for intercity passenger rail capital projects.
- Letters of interest: Aviation congestion is limited to a small number of larger hub commercial-service airports. These airports face both airside and landside constraints. To remedy this congestion, the Federal Aviation Administration needs to expand discretionary grant-making for capacity projects through the letter of intent program.
The United States is at a fundamentally different stage of its transportation system development than in the past. The old solution of adding more unpriced pavement—especially within growing metropolitan regions—simply will not result in meaningful congestion improvements. Federal and state investments must focus on increasing transportation options and using pricing to expand transit service and encourage people to drive less.
Expanding economic opportunity
State departments of transportation overwhelmingly focus their attention and resources on maintaining and expanding the state highway network. Stated another way, state DOTs tend to care about the assets they own and not the ones they don’t. Yet this narrow focus often leads to project selection decisions that have marginal value for those regions facing the greatest economic hardship. State project selection decisions often diverge from the types of improvements that local leaders would prioritize if they had access to more transportation dollars. Increasing local control over project selection decisions involving federal funds is one important element of creating more equitable economic growth and opportunity.
In addition, increased local control over project planning and selection is critical to address the harmful and discriminatory history of transportation infrastructure. The interstate construction era is rife with examples of communities of color being leveled to make way for highways intended to reduce the travel times of largely white, middle-class suburban commuters.
For example, DOT sits roughly a half-mile from Interstate 695, which is more commonly known as the Southeast/Southwest Freeway, in Washington, D.C. Prior to construction, the surrounding neighborhood had roughly 24,000 residents, of which approximately 80 percent were Black.61 In order to make way for the modern residential housing and the highway facility, local and federal planners declared the long-standing neighborhood blighted and bulldozed numerous houses and businesses beginning in the 1950s.62 The resulting hardship on dislocated residents was lost as planners and elected officials engaged in self-congratulatory declarations of success. There are too many similar examples from the interstate era to count. Policy reform—including but not limited to more devolution of federal dollars to local authorities— is needed to redress these historic harms as well as to prevent future discriminatory project selection decisions.
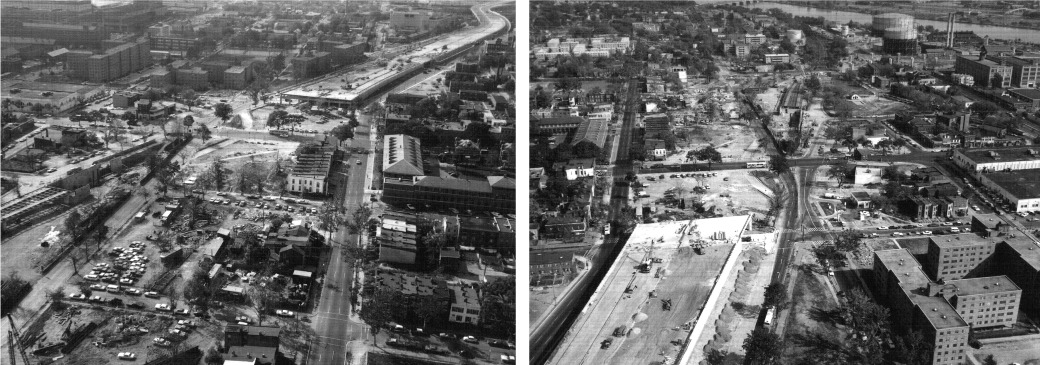
Construction of the Southeast/Southwest Freeway, 1968. Photos courtesy of the District Department of Transportation
Greater local control also helps to reduce state DOTs’ tendency to invest in costly highway boondoggles that provide little social, economic, and environmental return on investment. For instance, the Ohio Department of Transportation (ODOT) recently completed the Portsmouth Bypass, or state Route 823, in Scioto County along the Ohio River. The $1.2 billion P3 project includes construction and 35 years of operations and maintenance.63 And while the new highway shaves off a few minutes of travel time, it fails to address the most pressing local infrastructure and economic development challenges, including crumbling legacy facilities, polluted brownfield parcels located on prime land along the Ohio River, and aging waterworks.
To put the cost of the bypass in perspective, it helps to compare it to ODOT’s plans for local spending in Scioto County in the coming years. ODOT plans to spend a total of $41.5 million in Scioto County over the next four years, or a little more than $10 million a year.64 Excluding long-term operations and maintenance, the cost for the bypass was $646 million.65 Thus, ODOT spent 15 times more constructing the bypass—which took four years—than it intends to spend in Scioto County over an equivalent period of time.66
State DOTs care about the assets they own. Typically, this means the primary highway network. Yet this asset-based vision of investment is fundamentally flawed. Federal policy must change to recognize that travel-time savings are not the same as economic development. By pushing federal dollars and decision-making down to city and county officials, regions will be able to make more cost-effective and successful investments.
New policy
- Local control: Increase the share of Surface Transportation Block Grant funds subject to suballocation to 75 percent. Suballocate at least 25 percent of National Highway Performance Program funds. This change would further empower local leaders to make project selection decisions, helping to move away from a highway-centric approach to mobility and toward a more balanced, and multimodal system.
- Boulevard pilot program: Establish a pilot program with $300 million annually to fund the removal or conversion of limited-access highways, viaducts, or other principal arterial facilities that are no longer justified by travel demand or that are out of context with surrounding land use and economic development plans. Removing access-controlled highways that have come to the end of their useful life is an effective strategy to return valuable urban land to productive use, reconnect neighborhoods divided by highway facilities, and improve local transportation service. Rochester, New York, has already successfully removed a larger share of its inner loop.67 In addition, the New York State DOT has recently chosen to remove the elevated portion of Interstate 81 in Syracuse.
- Main streets: Establish a new competitive grant program with $250 million annually that would provide funding for capital projects to help small towns and midsize communities improve their main streets and central business districts, including through reconstruction, traffic calming, adding and improving nonmotorized facilities, lighting, and other design elements.
- Destination access: Establish a new performance measure for destination access. As opposed to tracking vehicle speeds, metropolitan planning organizations should be required to measure the ability of the transportation system to affordably, safely, and sustainably connect people to jobs, housing, and essential services, including health care, child care, and education, among others.
- Jobs-housing balance: Prioritize those transportation projects that help to reduce the imbalance in the location of workforce housing and employment centers. A combination of the suburbanization of many postindustrial jobs and the need for working and lower-income residents to live far away from employment opportunities to find affordable housing has created a structural imbalance in where people live and where they work. DOT should focus on transportation projects that support better land use and housing mix that allow people to live closer to where they work.68
For too long, states have controlled the lion’s share of transportation dollars, with a narrow focus on interstate and state highway construction. Increased local control will produce a more productive and balanced project mix that supports economic development, sustainable land use, and transportation choice.
Improving the condition of existing infrastructure assets
The current approach to performance management and to the state of repair of surface transportation assets has two fundamental problems. First, states are permitted to set a declining state of good repair performance target. This means that states can affirmatively declare their intent to use federal funds in a way that will permit their system to further deteriorate over time. States should be required to set a performance target that calls for stable or improving asset conditions. Second, there is no meaningful penalty for failure to make progress on asset repair conditions. Federal highway dollars flow each and every year, even when states make project selection decisions that ensure the share of broken bridges and deteriorating pavement will increase. The following recommendations would strengthen the federal performance management framework as well as reduce state project selection discretion for federal formula programs until states achieved a state of good repair.
Existing rules and guidance
- Performance measures: Section 150 of U.S. Code Title 23 includes three performance measures related to asset condition, including the condition of pavement on the National Highway System and interstate system and the condition of bridges on the NHS.69 The existing measures for asset condition should be amended to require states to maintain or improve pavement and bridge conditions. This change is important because the level of system disrepair is highly divergent across states, and the current performance structure does nothing to push states to do better. For instance, Florida has 1,375 NHS bridges listed as being in fair or poor condition.70 By comparison, Pennsylvania has 4,064, despite having a nearly identical number of NHS bridges.71
New policy
- Bridge repair: Establish a stand-alone bridge repair program and prohibit the transfer of funds from this account until a state has eliminated all structurally deficient bridges.
- State of good repair: Require states to spend at least 70 percent of their National Highway Performance Program funds for repair, rehabilitation, and reconstruction projects, until all pavement and bridges on the NHS have achieved a state of good repair.
- Penalty: Penalize states that fail to make adequate progress on achieving a state of good repair by reducing their National Highway Performance Program apportionment and making them ineligible for competitive grant programs, including Better Utilizing Investments to Leverage Development (BUILD); Fostering Advancements in Shipping and Transportation for the Long-Term Achievement of National Efficiencies (FASTLANE); and Transportation Infrastructure Finance and Innovation Act (TIFIA), which are discussed in more detail below. For the TIFIA loan program, this would require Congress to return the program to its previous discretionary status and away from a first-come, first-served credit facility.
Prioritizing asset repair is smart infrastructure policy. It’s also a way to advance social equity and address the lack of investment in many low-income communities and communities of color. All too often, new construction on the periphery of metropolitan areas serves to advance the commuting interests of affluent suburban residents or favored commercial interests looking to locate on cheap exurban land. These expansion projects typically receive a priority ranking because they support “growth,” yet the result is that many communities struggling with poverty, geographic isolation, and structural racism also must overcome crumbling assets that get worse year after year. Establishing a strong federal repair mandate would help to reverse this pattern of historical underinvestment.
Guiding infrastructure prioritization, financing, and implementation
Discretionary programs
Discretionary grant programs are an opportunity to drive policy reform by rewarding state and local project sponsors that submit applications for projects that advance national objectives. In general, the Department of Transportation should align its project selection criteria and evaluation process to advance sustainable and equitable growth by focusing on the five major challenges described in this report.
BUILD: The BUILD program makes project selections based on a series or primary and secondary criteria—some of which simply do not correspond to pressing needs and are a poor use of limited discretionary dollars. For instance, safety is listed as the first primary criterion. DOT highlights that it will focus, in part, on the “project’s contribution to the elimination of highway/rail grade crossings.”72 Yet according to the Bureau of Transportation Statistics, rail-grade crossings accounted for only 260 fatalities in 2018.73 By comparison, there were 7,354 nonmotorized fatalities from motor vehicle accidents—28 times more than rail-grade fatalities.74
The second primary criterion is state of good repair. Clearly, improving asset conditions should be a national priority. However, the scale of the repair challenge is well beyond the capacity of the BUILD program to make even a modest dent. The best way to improve asset conditions is to require states and regions to use their formula dollars. Within economic development, the BUILD program prioritizes freight projects that “help the United States compete in a global economy by facilitating efficient and reliable freight movement.”75 This is a very important goal, yet the Nationally Significant Freight and Highway Projects program, which the administration now calls the Infrastructure For Rebuilding American (INFRA) grant program, is dedicated to this very purpose, with $1 billion available in fiscal year 2020.76
Under the secondary criteria, DOT prioritizes new technology and innovative project delivery and financing, including P3s. Yet P3s have been around for decades, with a mixed track record of delivering projects with better cost and time performance than traditional procurement. DOT should focus its attention on the purpose and need for the projects under consideration and allow states to make their own independent procurement method decisions.
The secondary criteria also include an assessment of the estimated costs and benefits of proposed projects. Unfortunately, the core of the cost-benefit analysis is “savings in travel time costs.”77 Focusing on vehicle speed leads to selecting projects that undermine safety, better land use, access, and sustainability.
Finally, the BUILD program’s notice of funding opportunity does not mention equity or climate change. Addressing these challenges should be a central focus of the program. The closest the notice comes to addressing climate change is stating that DOT will consider the extent to which a project reduces “dependence on oil” and “congestion-related emissions.”78 The notice does not explain what is meant by dependence on oil. It would be better to replace this language with an explicit call for projects that reduce Clean Air Act criteria pollutants and GHGs. Additionally, the mention of congestion-related emissions is problematic because historically it has been one of the stated justifications for highway-widening projects. While internal combustion engines operate more efficiently when driving than idling or moving through stop-and-go traffic, building new highway capacity leads to more overall driving and emissions.
INFRA: The INFRA grant program should also be reformed to focus on national challenges. The statutory goals for the program include improving the “safety, efficiency, and reliability of the movement of freight and people” and reducing “highway congestion and bottlenecks,” among others.79 These goals should be placed in context. According to data from the Bureau of Transportation Statistics, heavy-duty combination trucks account for approximately 53 percent of all VMT on the interstate system. 80 Many of these miles are churned out over uncongested rural highways. The bottlenecks that the program wants to address are more often found within large metropolitan areas, where the proportion of light-duty vehicle traffic—especially during the morning and evening peak periods—is much higher. Adding pavement to metropolitan regions is expensive and yields little productivity gain. To the extent that metropolitan highway networks should grow, this expansion should be paired with variable roadway pricing and affordable transit service. In short, the best way to improve on-road freight performance isn’t to try and shoehorn in more urban lane miles but rather to provide residents with affordable alternatives to driving and a price signal that encourages carpooling or taking a trip during an off-peak time or on a less congested route.
In addition, the notice of funding opportunity rewards project sponsors that use “innovative financing,” including “[r]evenue from the competitive sale or lease of publicly owned or operated asset” and “[r]evenue resulting from the recent or pending competitive sale or lease of publicly owned or operated assets.”81 These examples of innovative financing are problematic for two related reasons. First, when a private firm provides an upfront concession or purchase payment to a public entity, it often uses private equity capital or proceeds from bank financing. These are very expensive sources of financing, and state and local governments can borrow money through the municipal bond market at much lower rates. Second, the private firm must charge users sufficiently high fees to repay bank loans or earn a return on equity. The reason that firms can charge such high rates is that many public assets behave like a utility or natural monopoly, meaning there is no or very limited competition. To raise so-called innovative financing, a state or local project sponsor may feel pressured to lease or sell an asset, giving way to monopolistic pricing practices that result in rent extraction. The federal government should remain neutral about how a project sponsor raises matching funds.
TIFIA: In 2012, the surface transportation bill MAP-21 reformed the TIFIA loan program to offer credit assistance on a rolling, first-come, first-served basis.82 This requirement removes the ability of the secretary of transportation to direct flexible, low-cost federal financing to those projects that truly advance equity and sustainability while making progress on the five major challenges outlined in this paper. The TIFIA credit facility should be amended to give the secretary the discretionary authority to provide credit assistance.
Repealing President Donald Trump’s deregulatory executive order
On January 30, 2017, President Trump signed executive order 13771, “Reducing Regulation and Controlling Regulatory Costs.”83 Section 2 of the order requires that “whenever an executive department or agency (agency) publicly proposes for notice and comment or otherwise promulgates a new regulation, it shall identify at least two existing regulations to be repealed.”84 Within DOT, this executive order has been incorporated as part of DOT order 2100.6, which states that for every significant new rule-making, the department must “identify at least two existing regulatory burdens to be revoked.”85
There is no correlation between the number of regulations in effect and a well-functioning transportation system and economy. This order originates from a simplistic ideology bent on undermining government, resulting in arbitrary and counterproductive efforts to slash and burn federal regulations. This executive order should be repealed immediately.
Targeted hiring and high-road employment labor practices and procurement
Federal infrastructure expenditures can create and sustain millions of well-paying jobs with strong benefits that allow families to own a home, send children to college or postsecondary training programs, and build retirement savings. For example, a worker making 150 percent of the federal minimum wage earns only $10.88 an hour, or $21,760 for a full year of work. By comparison, the average nonsupervisory heavy-construction worker earns $30.07, or $60,140 a year.86 This translates to an increase of $38,380, or 176 percent.87
Yet the benefits that come from construction and other infrastructure-related jobs have often bypassed women and communities of color due to discriminatory hiring practices. Moreover, even when infrastructure spending occurs in economically disadvantaged areas, it doesn’t translate into local jobs. This reality undermines the ability of infrastructure expenditures to deliver immediate benefits to struggling communities. DOT can begin to address this problem by using its authority to promote targeted hiring practices.
Importantly, reforming bid processes to require targeted hiring is not sufficient to redress discrimination and other exclusionary practices. To make real progress, DOT must work closely with the U.S. Department of Labor to create pathways that help individuals gain the necessary skills and on-the-job training required to build a successful career as opposed to a one-off, short-term job. Expanding apprenticeship programs is one powerful tool to successfully bring people into the construction industry.
New rules and guidance
- Targeted hiring: Use the special experimental projects authority as part of a pilot program or promulgate a new rule allowing grant recipients and subrecipients to require geographic-based hiring preferences. Historically, federal regulations prohibited the use of such preferences under the theory that they could erode competition and lead to higher bid prices on infrastructure projects. In March 2015, the Obama administration began a rule-making process to allow for targeting hiring preferences.88 However, the Trump administration withdrew this proposed rule in 2017.89 DOT should develop a pilot program or resume the rule-making process and promote targeted hiring with formula and discretionary program funds.
- Best value contracting: Publish guidance that encourages state and local grant and financing recipients to engage in best value contracting, which scores bids based on price as well as other factors, including equity and “commitment to creating or sustaining high-quality job opportunities affiliated with registered apprenticeship programs.”90
New policy
- Union neutrality: Prioritize competitive grant and financing program applications for those state and local governments whose contracting practices give preference to bidders that have formally adopted policies that are neutral toward matters of labor organizing.
- Apprenticeships: Allow states and regions to use up to 3 percent of their formula or discretionary grant awards to support the establishment and continuation of registered apprenticeship programs for the construction industry.
- Small and disadvantaged businesses: Increase the share of federal funds and financing assistance that must flow to small and disadvantaged businesses serving as contractors or subcontractors on infrastructure projects. DOT defines disadvantaged businesses as “for-profit small business concerns where socially and economically disadvantaged individuals own at least a 51% interest and also control management and daily business operations.”91
Additional resources on the structure and challenges of P3s
- “The Hazards of Noncompete Clauses in Public-Private Partnership Deals”92
- “The Limits of Risk Transference Through Public-Private Partnerships”93
- “Assessing Claims About Public-Private Partnerships”94
- “Public-Private Partnerships: Understanding the Difference Between Procurement and Finance”95
Project finance
The municipal bond market is the principal mechanism by which state, local, and special-purpose governmental entities finance infrastructure projects. Approximately two-thirds of all infrastructure projects rely on municipal bond financing.96 According to the Securities Industry and Financial Markets Association, there is more than $4.1 trillion in outstanding municipal issuances.97 In short, state and local project sponsors do not lack access to project financing. The constraint holding back additional infrastructure work is insufficient tax and user fee revenues to repay new project debts.
The deep economic downturn caused by the coronavirus pandemic has only exacerbated this reality. For instance, the Federal Highway Administration estimates that total VMT fell by 40 percent, or 120 billion miles, in April 2020 compared with the same month during the previous year.98 This reduction in driving will decrease federal and state fuel tax collections by billions of dollars.99
Proponents of P3s often tout private financing as a solution. Yet swapping one source of financing for another doesn’t address the public sector revenue shortfall. Private financing—including bank debt, private activity bonds, and equity—must be repaid. Moreover, private sources of capital often come at a substantially higher cost. For instance, the current yield on 30-year municipal securities is 1.78 percent.100 By comparison, the target return on equity is greater than 10 percent.101 Using equity financing for infrastructure projects is like choosing to finance a house with a credit card instead of a mortgage.
The actual value proposition of P3s is not that they solve the revenue shortfall problem, but rather that they offer a mechanism for the government to transfer project delivery or revenue risk to a private concessionaire. In theory, the project sponsors determine that paying a premium for private financing is worth the added cost if it helps avoid cost overruns or the downside risk of toll revenue shortfalls. The project delivery record for P3s is decidedly mixed, and political factors often reduce the degree of real risk transference. For instance, the Interstate 4 Ultimate highway project in Orlando, Florida, and the Purple Line light rail project in Maryland are both P3 concessions with significant delays and cost overruns.102
Conclusion
The recession triggered by the COVID-19 pandemic has increased the urgency of making robust federal investments in infrastructure to help stimulate long-term economic recovery. However, current policy and program structures need deep reforms to ensure that federal investments are equitable, sustainable, and targeted to communities facing the greatest need. Simply adding more money to the status quo will not help the United States meet its global climate commitments or redress the harms caused by discriminatory project selection and exclusionary labor practices. To achieve inclusive and sustainable prosperity, the Department of Transportation should use its authority to repair existing facilities, promote healthy living environments, and improve safe and affordable transportation access. Moreover, DOT should push Congress to enact legislation that ensures federal dollars achieve the greatest social, economic, and environmental return on investment.
About the author
Kevin DeGood is the director of Infrastructure Policy at the Center for American Progress.