Introduction and summary
Americans often think of health policy in terms of health care policies that affect prescription drug prices, deal with Medicare and Medicaid, or focus on health insurance coverage. But the health of Americans and the factors that affect health are about much more than health care. In fact, studies show that health care accounts for only about 10 percent to 20 percent of health outcomes.1 Health and life expectancy are shaped to a much greater extent by people’s living conditions and environment. The health of Americans is determined by education, income, jobs, housing, neighborhoods, and the world around them. One study estimated that education and income explained 60 percent of the variation in life expectancy.2
Put simply, social, economic, and environmental policies are health policies. Decisions about wages and benefits, taxes, education, affordable housing, rapid transit, the climate, and other aspects of daily life have ripple effects that affect public health. These policies can save lives or cause premature deaths. They can prevent disease or drive up health care costs. They can reduce inequities or widen them.3
Put simply, social, economic, and environmental policies are health policies.
Policymakers should be intentional and thoughtful about considering the health implications of their policy options before they act. It is difficult to identify, value, and enact effective policy without data on the magnitude of its potential impact, its disparate effects on vulnerable populations, and the opportunities it provides to address specific threats. For example, for a number of years, federal regulators have considered the costs to agriculture, energy use, human health, and property in setting policy on carbon emissions.4
The good news is that there are a number of places where policymakers can turn to get this critical information—including resources that can help identify health priorities; reliable scientific evidence that shows how different policies affect health; and tools that can predict the magnitude of benefits, harms, and costs. This report reviews those resources. It discusses health rankings, indexes that identify communities with the greatest health needs, sources of evidence about the health impacts of policies, and modeling tools that can forecast the magnitude of those impacts. However, the value of such tools depends on the circumstances. For example:
- Rankings are important to know which states or localities have the best or worst health outcomes—and thus, which can model promising policy approaches.
- Indexes of need help identify “hot spots”—areas where adverse conditions are concentrated and resources should be targeted.
- Studies of policy effectiveness can help evaluate the merits of potential strategies to rectify adverse conditions. Such policy research reveals the strength of the evidence that the strategy works and sometimes provides data that can quantify the magnitude of its impact, at least under the conditions in which the study was conducted.
- Prediction tools, including modeling, can use existing evidence to estimate the effect of a policy in particular circumstances that a policymaker faces, but these estimates rely on assumptions.
Evidence and research of any kind cannot be taken at face value, and this report provides guidance for readers interested in the factors to consider when judging the quality of policy research. It provides two examples—minimum wage policy and climate policy—to illustrate the technical considerations that go into the measurement of health impacts, including selecting the outcomes of interest, locating relevant data, comparing the results of different studies, and critiquing the underlying assumptions.
This report provides two examples—minimum wage policy and climate policy—to illustrate the technical considerations that go into the measurement of health impacts.
Researching the health implications of policy options is more challenging than it should be. For one, influential decision-makers are not always thinking about the health implications of “non-health” policies—those outside medicine and public health—let alone asking for evidence about their impacts. In addition, reliable data and research on health outcomes are not always available due to the inadequate national investment in research and data gathering.5
Policymakers often must make decisions urgently and do not have the luxury of waiting for perfect evidence or complete data. As the COVID-19 pandemic has illustrated, the need to act compels policymakers to make the best of existing evidence, however imperfect it may be. When setting policies that can affect health, decision-makers want the best available estimates of the likelihood of health benefits, the risk of unintended harms, the costs, and—when possible—estimates of cost-effectiveness and return on investment. In short, policymakers want to know what to expect.
One strategy, which is especially useful when there is inadequate time or resources to conduct a real-world study of policy effects, is to use simulation models that piece together existing data to predict likely outcomes.6 Modeling tools are a trusted resource in daily life, from the mapping apps that tell motorists the fastest route to their destinations to the weather alerts that predict when storms will arrive. Similar tools can help forecast the consequences of policy options.
This report makes the following five recommendations for advancing policies that promote health:
- Be evidence-based—consult the science before setting health or non-health policies.
- Use decision tools to forecast outcomes and track results.
- Connect the dots between non-health policies and health outcomes.
- Expand and act on research on the health impacts of climate policy.
- Invest in research on the health impacts of socioeconomic policies.
Key to fully recognizing the value of modeling are investing in the research and data gathering needed to make models rigorous and their predictions reliable in assessing health outcomes, as well as making that information more easily available and accessible to policymakers. These steps will enable policymakers to consider the health implications of policy options before they act and help them identify policies that save lives and offer the greatest benefits for the least harm and costs.
Social determinants of health
Decades of research have proved that the social and economic conditions in which people live—and the policies that shape those living conditions—matter greatly to their health and longevity. Policies governing health insurance coverage and access to health care matter too, but health care accounts for only about 10 percent to 20 percent of health outcomes.7 It’s education, employment, income, housing, transportation, and the physical and social environment that determine health outcomes ranging from life expectancy and mortality rates to the incidence of disease and injury. Public health experts call these the social determinants of health.8
Figure 1
Policies that influence the social determinants of health, therefore, have major implications for the health of Americans. Decisions that affect schools, jobs, taxes, highways, and other aspects of people’s lives, and that have little to do with hospitals and doctors, can improve health and even save lives—or endanger them. Some policies can help reduce health disparities, while others can widen the gap.
With that in mind, questions remain about how to determine which policies matter most and how to achieve the intended outcomes. Those questions apply to a range of policies, from those taken by governments at the federal, state, and local levels to those enacted by the private sector, such as decisions by employers, real estate developers, highway builders, drug manufacturers, restaurants, supermarkets, lending institutions, the news media, and advertisers, among others. For example, research has shown that minimum wage laws are associated with health benefits ranging from improved birth outcomes to suicide prevention.9 But as described later, choosing strategies, quantifying benefits, and predicting outcomes depend on a variety of factors.
The market is growing for tools to analyze the health implications of social and economic needs as well as potential policies to address those needs. Indexes or mapping tools that can help identify places where people live shorter lives, or that quantify how a proposed job or tax policy can improve the health of workers or lower health care costs, can help build the case for pursuing specific policies, help policymakers compare policy options, and provide metrics for tracking the health impacts of policies over time.
In short, the social and economic policy world faces a pressing need for data tools that can shed light on health impacts. This report reviews the range of data tools available and the factors to consider in judging their strengths and limitations. For illustrative purposes, this report also explores the relevance of these tools to evaluating how minimum wage laws improve birth outcomes.
Available analytic tools to inform health policy
The past decade has witnessed an explosion of metrics in health policy, a growing toolbox that is becoming increasingly difficult to navigate. Within minutes, a visit to the internet can uncover a plethora of mapping tools, scoring systems, indexes, health rankings, and measurement dashboards.
Policymakers therefore need to be specific to find their way to the kind of data they need and the correct genre of metrics that best serves their purposes. Which tool fits the situation depends on the question being asked. Among the options are rankings, which are helpful in identifying which states or localities have the best or worst health outcomes; indexes of need, scoring systems that help identify hot spots where adverse conditions are concentrated; policy research, including studies that evaluate the merits of potential strategies to rectify adverse conditions; and prediction tools, including modeling, which can exploit existing evidence to estimate the effect of a policy in particular circumstances that a policymaker faces. These estimates, however, rely on assumptions.
Rankings: Benefits and limitations
America thrives on competition, and not surprisingly, rankings can be a powerful incentivizing tool. Being rated #1 or worst in class carries weight. Programs and places can use their top rankings to showcase success, while others can cite low rankings as a call to action. A variety of projects rank the health of states, counties, cities, and other localities. America’s Health Rankings has been ranking the health of states since 1990 and now ranks based on 81 measures.10 Since 2008, County Health Rankings & Roadmaps, a project of the Robert Wood Johnson Foundation, has been ranking U.S. counties on measures of health and the social determinants of health.11 And a growing number of projects have taken on the challenge of ranking inequities, such as the size of the racial and ethnic health gap in states and localities.12
Programs and places can use their top rankings to showcase success, while others can cite low rankings as a call to action.
Rankings get attention, but they have limitations. Who gets ranked 1st, 15th, or last varies across rankings because of differences in methodological details.13 And rankings, however accurate they may be, do little beyond flagging success and failure to meet benchmarks. Policymakers, particularly those in places that routinely rank poorly on health outcomes—such as the deep South and Appalachia—often grow weary and lose interest in rankings, correctly noting that rankings do little to identify or change underlying circumstances responsible for those rankings or to propose solutions. Rankings say little about context, such as the poverty or struggling municipal budget that make one city rank worse than a neighboring city with affluent taxpayers. Rankings, especially when repeated too often, reach a point of diminishing returns—unless they are used to stimulate change.
Indexes of need: Pinpointing hot spots
Indexes that are of particular interest are those that can quantify the severity of health threats or identify hot spots where needs are greatest. A variety of mapping tools are available to plot these indexes for nations, states, districts, counties, ZIP codes, or census tracts.14 These maps are highly effective visual tools to help the public and policymakers see areas where the greatest needs are clustered and are useful in raising the visibility of local needs.
Maps are highly effective at visualizing areas where the greatest needs are clustered and are useful in raising the visibility of local needs.
Indexes of need first emerged decades ago with the development of poverty and deprivation indexes.15 These are often composite indexes, meaning that they synthesize multiple factors into a single score. Deprivation indexes are used by international groups—for example, the Human Development Index16—and many countries have developed their own index—for example, the New Zealand Index of Deprivation.17 Deprivation indexes used in the United States include the Area Deprivation Index,18 the Child Opportunity Index,19 and the Opportunity Index.20 These indexes generally have relatively little to do with health.
In the United States, a small but growing number of composite indexes have been developed with a focus on health. Examples include the Social Deprivation Index21 and the Community Resilience Estimates,22 which score communities based on the presence of conditions that are known to affect health. More advanced indexes use statistical techniques that assign weights to different local conditions—such as poverty and housing costs—based on their ability to predict specific health outcomes.
Another example is the scores given to communities by the Health Opportunity Index and the Healthy Places Index (HPI) that are based on the mathematical correlation between local indicators and life expectancy. In 2014, the Public Health Alliance of Southern California initiated a collaboration with the California Department of Public Health and researchers at Virginia Commonwealth University to calculate an HPI score for almost all of California’s 8,057 census tracts. The HPI, scored on a scale of 0 to 100, reflects 25 census tract indicators covering eight domains—economics, education, health care access, housing, neighborhood conditions, pollution, social factors, and transportation—and is weighted by these domains’ ability to predict life expectancy.23 A mapping tool allows users to visualize the HPI for any part of the state, customize the output, and access information and resources on policy solutions. (see Figure 1)
Since its release in 2015, the California HPI has been used for a variety of policy decisions.24 Notably, in the first year of the COVID-19 pandemic, California began using the HPI as part of its “Blueprint for a Safer Economy,”25 a statewide effort to promote equity in its pandemic response and influenced investment decisions.
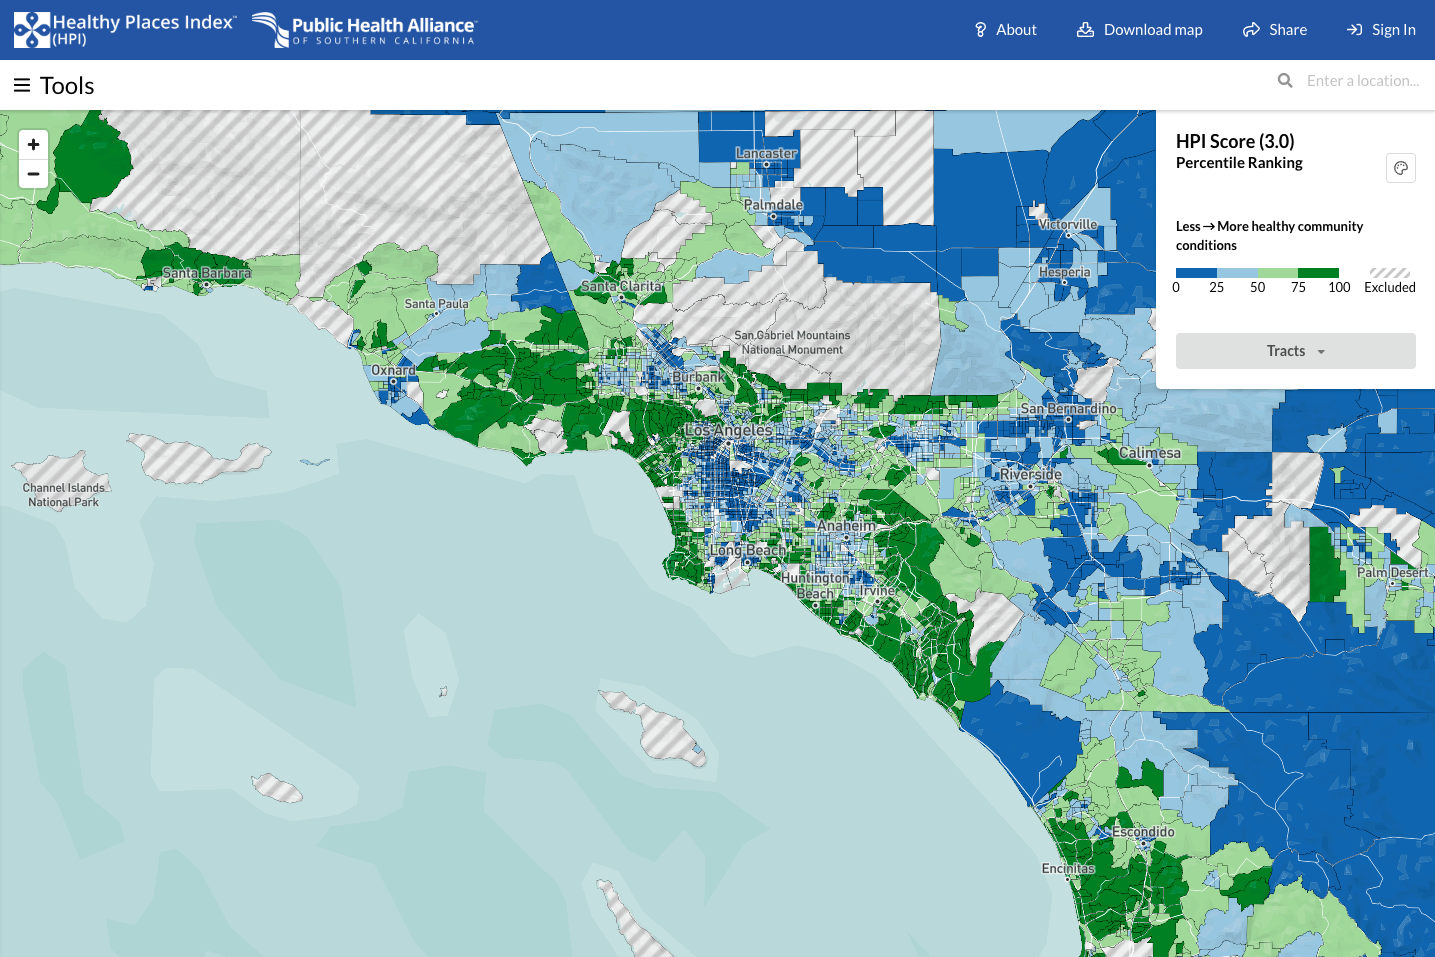
The Public Health Alliance of Southern California’s Healthy Places Index (HPI) map can display the HPI ratings for census tracts throughout California. Here, it shows metropolitan Los Angeles. Green shading represents areas with conditions more conducive to health—i.e., higher HPI ratings—and blue represents less healthy areas with lower HPI ratings. This interactive mapping tool provides the user with opportunities to customize the information shown based on needs and to access practical information on actionable policies. Source: Public Health Alliance of Southern California, “Healthy Places Index,” available at map.healthyplacesindex.org (last accessed March 2022).
Policy research: Gauging effectiveness
Separate from assessing needs, policymakers often seek evidence about the effectiveness of potential policy solutions. Policymakers often operate on a short timeline because of urgent issues that demand action during short budget cycles, upcoming elections, or other demands that conflict with the pace of scientific research. They ask the obvious questions: How well does it work? Will it work as well under a short timeline? What works best? They need data on which policies will matter most, which have proven outcomes as selling points, and which have the best cost-benefit ratios (“bang for the buck”) to justify investments.
Policy analysis is important whether the question is “What works?” or “What works best?”
Policy, or evaluation, research refers to studies, often conducted by policy research organizations or universities, that are designed to answer the question: How well does the policy work? Measuring the impact and effectiveness of policy solutions for the health challenges facing the nation or a community is methodologically challenging.26 The kinds of evidence needed are not always available, and the evidence that does exist often varies in quality. Even when data are available, policy research is often encumbered by lack of data and problems with their accuracy, relevance to the problems at hand, or generalizability. As discussed in more detail below, proving whether a policy improves health is often more difficult than performing a controlled trial to test a new drug or medical procedure. These questions require a different toolbox of research methods that rely heavily on observational methods and quasi-experimental designs. The intense need for evidence about policies leads many to accept findings at face value, but the quality of the evidence varies greatly, making it important to take evidence with a grain of salt and consider the source.
Factors to consider in judging the quality of policy research
A variety of factors influence the strength of evidence, beginning with the quality of the data. As captured in the adage “garbage in, garbage out,” policy evaluations based on obsolete, inaccurate, or misleading data carry a fundamental flaw. Even when evidence is based on high-quality data, the applicability or generalizability of the evidence may be limited if it does not cover the time period, target population, or geographic area that is of interest to the policymaker. For example, excellent evidence about a successful policy in New York City may not be generalizable to rural Texas. Other factors to consider when judging policy research quality include the outcome measures; how the study defines success; and the study design, such as whether the study is observational or involves an experiment.
Outcome measures
A key consideration in judging the quality of evidence is the choice of outcome measures, the metrics for judging how well the policy works. For policies intended to improve health, the ideal outcome of interest is a health metric that matters to everyday people, such as levels of pain or disability or the length and quality of life.
Any assessment of how well a policy works relies on an implicit causal pathway or logic model. (see text box below) Ideally, when evaluating policies that affect health, the ultimate outcomes should be measures of morbidity and mortality27 that matter to people (and the costs of those measures).28 However, these ideal metrics are often unavailable for policy evaluation, typically because they are too difficult to define or collect. Instead, judgments about policy are often based on intermediate or process outcomes that are assumed to ultimately lead to the intended health outcome. For example, tobacco control policies are ultimately intended to prevent tobacco-related illnesses and death and their associated costs. However, such illnesses develop over many years, making it almost impossible for every study of tobacco control policies to use these health outcomes as a metric. Such studies instead rely on intermediate outcomes such as smoking rates or tobacco sales, based on the body of evidence—assembled over decades of research—that has established the scientific links between these intermediate outcomes and tobacco-related illness.
However, it cannot necessarily be assumed that a change in the intermediate outcome will translate into a measurable impact on desired outcomes. For instance, evidence that tax benefits promote the construction of supermarkets in food deserts is of limited value without evidence that eliminating food deserts improves the health of the local population.
Finally, the selection of outcomes also matters if there is a concern about the trade-off between benefits and harms such as adverse effects and unintended consequences. Evidence that a policy produces health benefits may not be enough, especially when there are concerns that benefits could be outweighed by potential harms. For example, administering a high-risk drug to a low-risk population may save the lives of a small proportion of recipients but claim more lives through fatal side effects.
Logic models
In writing or graphical form, logic models make explicit the intended outcomes and mechanisms of action, potential side effects or unintended adverse consequences that may arise at each step, and implicit assumptions about how short-term changes will lead to longer-term results.
These diagrams serve multiple purposes: They disclose the beliefs and assumptions that animate advocates, they provide metrics for measuring impact, and they help identify gaps in the structure of the model—such as the failure to consider potential harms, unintended consequences, or economic costs—and in supporting data and evidence. They make explicit the steps in the pathway for which supporting evidence is necessary. Each linkage in the model represents a potential research question: What is the evidence that the first, second, or third step in the logic model will occur, what is the magnitude of the effect, and how strong is the science behind these estimates?
Such evidence can be limited to testing parts of the causal model, such as whether the policy can achieve short-term intermediate outcomes or can address the larger questions of whether the policy can affect the health outcomes of ultimate interest and whether the benefits outweigh the harms.
Study designs
The strength of evidence for a proposed policy is also determined by how the study is designed to collect data. A key factor is whether the evidence comes from an observational or an experimental intervention study.
Observational studies
A common way to explore the health impacts of policies is to observe outcomes among people and places that happen to have been exposed to them. In observational studies, the researchers have no role in implementing the policy but take advantage of its existence to track outcomes.
- Retrospective studies collect background data after the fact; for example, having the outcomes of a policy already in hand, researchers may go back in time to identify preexisting conditions, such as population characteristics or economic circumstances, that differentiate people who did or did not later benefit from the policy. Some retrospective studies seek to draw connections between past policies and subsequent outcomes. For instance, studies have shown that the Head Start program and other civil rights legislation of the 1960s were associated with subsequent reductions in mortality.29
- Prospective studies, considered a stronger class of evidence that is less subject to bias, collect this information systematically when, or even before, a policy is implemented and then track outcomes over time. Uncontrolled prospective studies lack a comparison group, so there is no way to know whether the outcomes would have occurred absent the policy. Controlled prospective studies provide stronger evidence because they allow contemporaneous comparisons of outcomes in settings where the policy was and was not implemented.
Some observational studies focus not on the policy itself but instead on the condition the policy seeks to address and measure its association or correlation with outcomes. For example, a study may show that exposure to childhood trauma is predictive of subsequent teen pregnancies, suggesting that this outcome might be prevented by programs to reduce such trauma. Policy advocates often rely upon such evidence about predictors, risk factors, and correlations when direct evaluations of policies are lacking. And some policy evaluations rely heavily on correlations to infer causality. Observational studies, for example, have documented an association between civic engagement and lower suicide rates,30 suggesting that communities struggling with high suicide rates might benefit from programs, such as through churches and community organizations, to strengthen the social fabric.
But such assumptions are not always justified and can even be controversial. Consider the sensitive topic of gun violence prevention laws, which some argue are ineffective in preventing shootings. The following excerpt from a 2021 report from the National Academies of Sciences, Engineering, and Medicine illustrates the reliance on evidence of association to evaluate the effectiveness of gun violence prevention policies:
Rates of firearm-related suicide are higher in states with looser gun regulations and more gun ownership, and in nonmetropolitan than in larger metropolitan. Anestis and colleagues (2017) studied trends in suicide by firearms between 1999 and 2015 and found that at the state level, the absence of laws requiring universal background checks and imposing a mandatory waiting period for the purchase of firearms were associated with a more steeply rising trajectory of statewide suicide rates. Furthermore, where firearm suicide rates were declining, this decline was not offset by increases in suicide by other means. Others have documented higher suicide rates in states with higher gun ownership, and handgun ownership has been associated with higher rates of firearm-related suicide mortality. These findings suggest that strengthening state gun control laws has the potential to reduce suicide rates and possibly rural-urban differentials in these rates.31
As this example illustrates, the perpetual challenge with observational studies is asserting causality. As reflected in the adage “association is not causation,” measuring a statistically significant correlation between exposure to a policy and improved outcomes does not, by itself, rule out the possibility that confounding variables—extraneous factors that were more common among the people or places affected by the policy—explain part or all of the observed differences. The settings in which the policy was implemented may have other reasons for better outcomes, such as more educated populations, greater resources, or the presence of other policies. In what is known as the ecological fallacy, patterns observed for a group may not apply to all individuals in the group, whose circumstances vary.
Researchers work to address such concerns by using statistical techniques—for example, multivariate equations—to adjust for potential confounding variables. If they can show that a policy is associated with better outcomes even after adjusting for these variables, the evidence of causality is strengthened, but statistics can rarely fully account for everything, especially unknown confounding variables. A recent study, which found an association between COVID-19 and newly diagnosed diabetes in people under age 18, also noted that it “lacked information on covariates that could have affected the association between COVID-19 and incident diabetes, including prediabetes, race/ethnicity, and obesity status.”32
Even when the evidence is persuasive enough to infer that the policy has an impact, the precise magnitude of the impact can be difficult to quantify based on observational research. For example, death rates among middle-aged adults (ages 45 to 64) with 9 to 11 years of education are twice as high as among those with 12 years of education (equivalent to a high school degree),33 but does this mean that giving them a high school diploma will reduce their risk of dying by 50 percent? Probably not. Such evidence only allows one to conclude that completing high school has a sizable effect on mortality rates.
Experimental intervention studies
The gold standard for proving effectiveness is the double-blind randomized controlled trial, in which the effectiveness of an intervention is tested under experimental conditions against a placebo and both the recipient of the treatment and the researcher are blind to which subjects have been assigned to which groups. In theory, randomization offers the most convincing proof that observed outcomes can be credited to the policy because the experimental design and randomization equally distribute both known and unknown confounding variables. In controlled trials, fidelity—testing a reproducible intervention that is always the same, such as 50 milligrams of a drug every 12 hours—and the use of control groups help quantify the magnitude of impact.
However, social and economic policies rarely lend themselves to experimental testing. Unlike laboratories in which experimental conditions can be highly controlled, community conditions are often far more complex, fluid, and beyond the control of researchers. Having a control group, in which an intervention is not offered to randomly selected communities, is often unethical. And controlled trial experiments can take time, sometimes years, to produce measurable results and are often costly. The fidelity and consistency that are strengths in testing drugs are a weakness in testing public policies, especially when their success hinges more on adaptability than uniformity. Every community is different, and policies may not be scalable or effective in diverse settings unless they can be customized and responsive to the needs of the people or community being served.34
A useful alternative to experimental trials arises when circumstances create “historical” or “natural” experiments, in which policies not under the control of researchers are implemented in a fashion that produces control groups. A classic example is the Moving to Opportunity project, conducted by the U.S. Department of Housing and Urban Development from 1994 to 1998, in which approximately 1,800 families in low-income housing projects were offered subsidized vouchers that enabled them to move to more affluent neighborhoods. Families eligible for the program were chosen randomly,35 creating a natural experiment that allowed researchers to track the degree to which adults and their children benefited or were harmed by relocation to places with more resources. At first, studies reported that recipients of the vouchers had lower rates of obesity and diabetes36 and long-term (10- to 15-year) improvements in adult physical and mental health and subjective well-being.37 But although moving was associated with a reduced rate of conduct disorder among girls, it increased rates of depression, post-traumatic stress disorder, and conduct disorder among boys.38
Summing up the evidence: Determining a policy’s likely impact
Policymakers often must make decisions urgently and do not have the luxury of waiting for perfect evidence or complete data. The need to act makes it necessary to make the best of existing evidence, however imperfect it might be.39 The COVID-19 pandemic offers a recent example of the dilemma of needing to act quickly in the face of inadequate, and often conflicting, scientific evidence.
When setting policies that can affect health, decision-makers want the best available estimates of the likelihood of health benefits, the risk of unintended harms, the costs, and—when possible—the cost-effectiveness and return on investment. In short, policymakers want to know what to expect. Three resources to sum up the evidence include health impact assessments, reports designed with the specific purpose of helping policymakers evaluate the health implications of policy choices; systematic reviews and meta-analyses, which use systematic methods to summarize and synthesize evidence; and predictive modeling, in which statistical methods are applied to existing evidence to predict a policy’s likely outcomes.
Health impact assessments
The health impact assessment (HIA) was inspired by environmental impact assessments, which have been used for decades to evaluate the potential effects of policies that can affect the environment. HIAs help policymakers compare the effects of potential policies on health outcomes.40 They address policies with national, state, and local scopes and deal with a variety of policy topics. (see Figure 2) The text box below lists resources for more information about HIAs. The challenge in producing HIAs is the time and resources required to conduct a thorough review of the evidence. Policymakers cannot always afford the costs—or the waiting time for a completed report.
Figure 2
Resources on health impact assessments
Federal resources:
State resources:
Systematic reviews and meta-analyses
Systematic reviews are sophisticated syntheses of evidence that use rigorous methods to ensure that existing evidence is examined comprehensively and impartially. In meta-analyses, the results of multiple studies, typically controlled trials, are pooled to generate an aggregate estimate of likely outcomes. More often than not, however, the existing policy research is too heterogeneous to lend itself to such pooling techniques.
Predictive modeling
Another useful resource to quantify the impact of a policy is predictive modeling, in which statistical methods are applied to existing evidence to predict a policy’s likely outcomes. What makes these models particularly useful to the policymaker is their ability to estimate the magnitude of effect of an intervention. For example, a predictive model developed by Dow and others estimated that a 10 percent increase in the minimum wage reduces nondrug suicides among low-educated adults by 2.7 percent.41 Such models typically rely on a set of assumptions and allow for projections to be adjusted to simulate outcomes if the assumptions or circumstances are changed. Model predictions for a variety of social and economic policies are available in the published literature. For example, Table 1 lists studies that have used predictive modeling to estimate the health benefits of the earned income tax credit (EITC).
Table 1
Researchers use a variety of modeling techniques. For example, discrete event simulation is widely used in operations research to simulate circumstances such as customers waiting in line or patient delays in the waiting room. Systems dynamic models are used to model feedback loops, such as how a beverage tax could reduce consumption and later result in lower tax revenue. Microsimulation models consider the behavior of individuals, households, or businesses.42 One common example is agent-based modeling, which creates synthetic populations of individual actors, known as agents, to simulate how agents relate to each other and the system over time. Such models have been put to use in population health policy. In 2015, the Institute of Medicine published a 250-page report on the use of agent-based models for tobacco regulation.43 And more recently, MITRE, a nonprofit research corporation, developed an agent-based modeling tool to predict the outcomes of health care policies.44
Perhaps the most commonly used method for estimating the health impact of a policy is the difference-in-difference (DID) design.45 The DID design is a more advanced example of pre-post comparison that compares outcomes before and after a policy is implemented. The problem with an ordinary pre-post comparison is that it fails to account for changes in outcomes that would have occurred independent of the policy. The DID design addresses this problem by comparing pre-post outcomes in settings where the policy is implemented (A2 minus A1) to changes in outcomes in comparable settings where the policy is not implemented (B2 minus B1) or not implemented to the same degree. The difference between (A2 minus A1) and (B2 minus B1) estimates the true effect of the policy.46 DID studies and predictive modeling have the downside of requiring time, resources, and skilled modelers to produce trustworthy results.
Putting analytic tools to use
The proper choice of analytic tools depends on the circumstances. As previously noted, rankings are important to identify which states or localities have the best or worst health outcomes. Indexes of need help identify hot spots where adverse conditions are concentrated. Studies of the effectiveness of policies can help evaluate the merits of potential strategies to rectify adverse conditions. Such policy research reveals the strength of the evidence that the strategy works and sometimes provides data that can quantify the magnitude of the impact, at least under the conditions in which the study was conducted. Health impact assessments and systematic reviews are useful when there is a desire to sum up the results of multiple studies. And prediction tools, including modeling, can exploit existing evidence to estimate the impact of a policy in particular circumstances that the policymaker faces or to help set priorities. The policy toolbox is large, but the proper tool depends on the question being asked.
Infrastructure investments that create jobs, address climate change, or increase benefits to families can have important health benefits and potentially save lives. An interactive modeling tool that can quantify those benefits can help argue the case.
National Commission on Prevention Priorities
The National Commission on Prevention Priorities (NCPP) ranked the relative importance of 28 screening tests, including tests for cancer, immunizations, and other preventive services that are all recommended by the U.S. Preventive Services Task Force. (see Table 2)47 Busy clinicians or agencies with limited resources cannot implement every prevention service that is recommended. The NCPP used microsimulation models to determine which of the recommended services should be prioritized, based on their effect on people’s health and the services’ cost-effectiveness.48
Table 2
Interactive modeling tools
Policy research can be brought to life with interactive tools, typically hosted on websites and software application platforms, that allow users to manipulate social and economic conditions and observe their predicted impacts on health outcomes. Some tools invite users to type in values, use a cursor to adjust variables, or manipulate a slider tool to observe outcomes.
Interactive tools, typically hosted on websites and software application platforms, allow users to manipulate social and economic conditions and observe their predicted impacts on health outcomes.
ReThink Health’s Dynamics Model
With support from the Rippel Foundation, the nonprofit organization ReThink Health developed a data-driven simulation tool known as the Health Dynamics Model49 that allows users to manipulate conditions in a health system and observe projected effects over time on population health, health care delivery, health equity, workforce productivity, and health care costs. The tool can make projections for “Anytown, USA,” a hypothetical community, but it has also been used by planners in Atlanta, Cincinnati, and many other jurisdictions throughout the United States. Users can choose from approximately 20 potential initiatives—ranging from enhancing care quality to promoting healthier behaviors or expanding economic opportunity—and test which interventions perform best in saving lives, curbing costs, improving quality, increasing social equity, or boosting productivity. The tool requires users to consider financing options, such as economic incentives and reinvested savings, and provides a 25-year projection that helps planners determine the sustainability of said strategy. One application of this model found that combined investments in clinical and population-level initiatives, coupled with financial disincentives for costly care and reinvesting savings, would reduce severe illness by 20 percent, lower health care costs by 14 percent, and boost economic productivity by 9 percent.50
The ReThink Health Dynamics Model, which is designed to be user-friendly, relies on a simulation model that draws on multiple sources of empirical data to generate estimates in real time. Such tools can be useful, not only as evaluative tools for gauging outcomes but also for outreach to engage the public or other audiences and raise awareness about the health implications of social and economic policies.
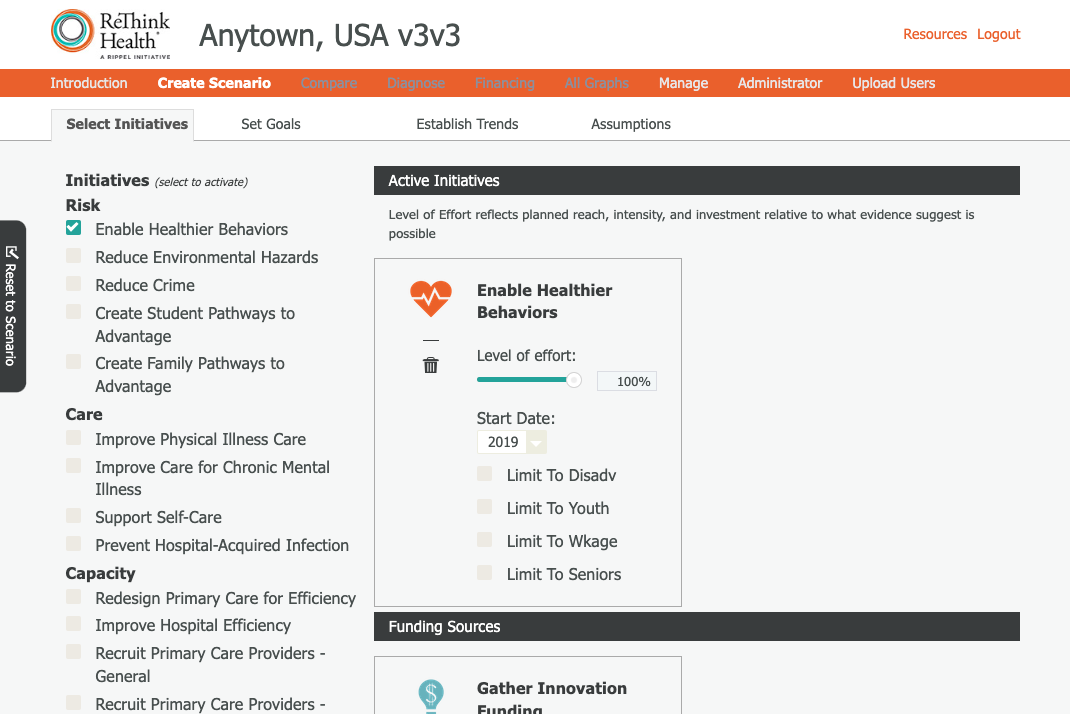
The ReThink Health Dynamics Model is an interactive predictive modeling tool with a user-friendly interface. Source: ReThink Health, “Dynamics Model,” available at https://rethinkhealth.org/our-work/dynamics-model/ (last accessed March 2022).
Benefits and challenges of developing an interactive predictive modeling tool
A well-designed interactive modeling tool with an attractive and user-friendly interface can also serve as a communication and outreach device. An engaging user experience can draw the interest of policymakers and other stakeholders, and the popularity of the tool and the compelling statistics it generates can bring greater visibility to the policy. Some models allow users to conduct sensitivity analyses to see how projected outcomes change under different circumstances or assumptions. The output can sometimes be customized for geographic areas of special interest, such as a congressional district or hospital catchment area. Finally, unlike printed reports that age over time, interactive modeling tools can be easily updated to reflect new evidence and data and track changes in outcomes over time.
The challenges of developing such tools are not trivial, however. The most obvious are the time and costs associated with their development and maintenance, which can vary depending on whether the work is done in-house or is outsourced, the charges for the work, and the level of functionality and design work required for the product. A further issue is reputation; organizations will want the quality of the tool to live up to their standards of excellence and will not want to put their name behind a model that makes inaccurate projections or is based on arguable evidence and assumptions. Such criticism could blemish not only the reputation of the model but may also inflict damage on advocacy efforts for the policy the model addresses. And even a model that performs perfectly can age and become outdated; a tool that is launched without a budget for maintenance and updating may have a limited shelf life. However precise the model, it is essential that developers are explicit about its limitations and the caveats to consider in interpreting its projections.
Given that the promise of a predictive tool comes with its challenges, a prudent approach would be to test the waters by piloting the development of a prototype tool for a specific policy. Such a use case would help the organization gain familiarity with the tasks that go into developing such a tool, the associated time and costs, and the potential for scalability—that is to say, whether the template developed for the use case could be easily adapted to other policies and datasets.
Case studies: Modeling the health impacts of social, economic, and environmental policies
Policymakers are likely to encounter the argument that certain social, economic, or environmental policies will save lives, prevent disease, or cut health care costs. Their central question will be “By how much?” The ability to give a firm answer will depend on the existence of research to quantify the impact and will invariably depend on the circumstances in which the policy is implemented and the population whose health is being considered. Whether one is an advocate for a policy or a decision-maker judging its merits or affordability, a simulation model that can estimate the likely effects of a policy under different circumstances can have great utility. It can help argue the case for the policy, provide the numbers to judge cost-effectiveness, and set priorities.
A model can also demonstrate how dramatically a policy can affect health, a message that can be especially important in demonstrating that a connection between non-health policies and health exists in the first place, as well as in raising awareness about the magnitude of the influence. However, unlike drugs and medical procedures, for which the evidence of clinical outcomes and costs is extensive, research on the health effects of social, economic, and environmental policies is often more limited. And models that are poorly designed can produce flawed results.
This section explains what goes into the design of a good model. To do that, it uses two case studies—minimum wage laws and climate policy—to explore the complex considerations that arise even when data and peer-reviewed research evidence are available.
Although each circumstance will differ, the development of a predictive model for a proposed policy involves a series of steps such as those depicted in the text box below. The first steps are not only to identify the policy of interest but also to clarify the goals and objectives of the undertaking. What is the policy agenda that motivates interest in predictive modeling, and what kind of question is the model intended to answer? To what purpose is the output to be used, what is the target audience, and what arguments is the tool expected to make? For example, is it intended to show an impact on health outcomes, to quantify a health benefit, to clarify the range of estimates—for example, scientific uncertainty—or to make a cost-benefit or cost-effectiveness argument?
Template for developing a predictive modeling tool for policies with potential health impacts
- Select the policy of interest.
- Define the goals and objectives of the project and model.
- Technical development:
- Select policies and outcomes of interest.
- Assemble relevant evidence and data.
- Select appropriate model design.
- Narrow and prepare the dataset on which the model will be based.
- Define covariates, areas of uncertainty, and model assumptions.
- Program and test the model and perform sensitivity analyses.
- Development of the model interface:
- Define the functions the tool will offer.
- Design and refine the wireframe.
- Construct the prototype.
- Engage in beta-testing.
- Customize the aesthetic appearance and functionality.
Case study 1: The health impacts of minimum wage laws
How might laws to increase the minimum wage affect health outcomes? Answering this question provides a useful example of the kinds of issues that enter into the analysis, beginning with the selection of the policy itself and extending to the selection of outcomes of interest, the assembly of relevant evidence and data, the comparison of results, and the scrutinization of assumptions.
Policy selection
The first step is to select the policy of interest. There are a handful of policies with a relatively large body of research that has examined health outcomes. These include not only the minimum wage but also the earned income tax credit, early childhood education, Medicaid expansion, and other policies for which multiple studies have demonstrated quantifiable health benefits. The supporting evidence of health benefits for the minimum wage is considerable, growing, and timely. The Center for American Progress has long worked to build the policy case for raising the minimum wage through legislation such as the Raise the Wage Act of 2021, which would gradually raise the federal minimum wage to $15 per hour by 2025 and would eliminate the subminimum wage for tipped workers and disabled workers.
Outcomes of interest
While the majority of the research on minimum wage laws focuses on how higher wages affect economic security, such as through employment and income, a growing number of studies have examined their impact on health outcomes. For example, studies have shown their association with premature mortality,51 heart disease deaths,52 depression,53 suicide,54 diet,55 access to health care,56 and birth outcomes.57 While some studies are based on observational studies, including research comparing the association between wages and health outcomes, other investigators have built models to quantify the potential health impacts. For example, one study using a DID model found that a $1 increase in the state minimum wage was associated with a 3 percent to 6 percent reduction in the suicide rate among those with a high school education or less and that the largest effects occurred during periods of high unemployment.58
A $1 increase in the state minimum wage was associated with a 3 percent to 6 percent reduction in the suicide rate among those with a high school education or less.
Although minimum wage studies offer a range of health outcomes to choose from, birth outcomes have been examined in multiple models using diverse approaches. As noted above, the choice of outcome should be guided by the project’s goals and objectives. If the goal is to advocate for minimum wage laws in the face of resistant voters, employers, or politicians, a tool that shows a dramatic effect on a persuasive outcome can be particularly useful. Birth and infant health outcomes resonate with the public and are more likely to garner interest among policymakers on both sides of the aisle.
Evidence and data selection
Although the four studies listed in Table 3 are not exhaustive, they provide sufficient diversity to illustrate the kinds of decisions that go into the selection of the evidence and datasets on which to base a prediction model. For example, three of the studies (Komro and others, Wehby and others, and Rosenquist and others) examined the relationship of birth outcomes to state minimum wages, while one of the studies (Curtis and others) examined the association of birth outcomes with county income levels. The studies took different approaches to measuring minimum wage policy: Wehby measured the inflation-adjusted minimum wage, Komro measured the inflation-adjusted difference between the state and federal minimum wage, and Rosenquist compared high and low minimum wages based on percentiles. Three of the four studies examined birth weight as an outcome, and two examined mortality rates. Rosenquist examined neonatal mortality (death in the first 28 days after birth) and infant mortality (death in the first 365 days after birth) and Komro examining post-neonatal mortality (death occurring from 28 days to 364 days after birth).
Table 3
Closer examination of these studies reveals other distinctions. For example, Rosenquist looked only at one calendar year, modeling the relationship between state minimum wages in 2010 and infant mortality rates recorded for that year. The other studies examined data from more than two decades and used regression models that accounted for “fixed effects.”59 All the studies adjusted the results for confounding variables that could influence birth outcomes independent of wages. Multivariate equations adjusted for various combinations of individual characteristics of mothers—for example, age, race and ethnicity, education, marital status, tobacco use, and prenatal care—and the states or counties in which they lived, including population, racial composition, and unemployment and poverty rates. Two studies (Rosenquist and Curtis) assumed that birth outcomes would result from wages in effect during the birth year, whereas other studies adjusted for lagged effects, measuring over one year (Komro) or as much as two years (Wehby) to observe delayed outcomes in recognition of the fact that conditions before pregnancy—the preconception period—influence pregnancy outcomes.
Comparing results
Given the variation in study designs, it comes as no surprise that the results of these studies differed and were framed differently. For example, whereas Komro concluded that every $1 increase in the minimum wage above the federal level was associated with a 1 percent to 2 percent decrease in low-birth-weight births,60 Wehby reported that a $1 increase in the minimum wage during the two years before birth increased birth weight by only 0.1 percent (4 grams) among low-educated mothers.61 Rosenquist, the only study to examine infant mortality, reported that being among the states with high minimum wages (at or above the 75th percentile) decreased the odds of infant mortality by 7 percent. The Curtis study, which did not examine the minimum wage specifically, found that an increase of $10,000 in county median income was associated with a decrease in the occurrence of low birth weight—by 0.34 per 100 live births—and in Black-white disparities in low birth weight (by 0.58 per 100 births).
Thus, a choice of studies, regression equations, and datasets are available to build the statistical engine for developing a prediction tool for modeling the effects of wages on birth outcomes. The decision rests partly on outcomes of interest. For example, only Rosenquist provided the data to predict impacts on infant mortality, whereas Komro could help with post-neonatal mortality.
Scrutinizing the assumptions
Another consideration is whether the models provide sufficiently granular data to make projections for a specific state or to allow for varied assumptions about individual- or state-level characteristics. Tools with a customizable interactive interface that allows users to tailor the output for specific circumstances invariably rely on a set of assumptions. For example, certain assumptions, and appropriate data, would be required to predict how a $1 increase in the minimum wage would affect birth weights in Kansas or how that impact would vary based on the unemployment rate. Another example of where assumptions matter is when the researcher is predicting the outcome of events that occur in a series of steps. The probability of dying from a viral infection first depends on how likely one is to be exposed to the virus and, in turn, the likelihood that exposure will lead to infection, that infection will lead to symptoms, that symptoms will progress to life-threatening complications, and so forth. The assumptions made about these probabilities will influence the results. The degree to which these assumptions are based on data or guesswork often varies.
In the absence of appropriate data, models can be helpful in performing sensitivity analyses to learn which variables are important in shaping outcomes—and which are not. This type of information can help clarify which evidence gaps are most important to fill, and which are of lower priority.
Complicated models that adjust for multiple covariables have their advantages and disadvantages. The obvious advantage is that they account for confounding variables and can therefore lend more precision to the estimate by isolating the effects of the policy from the effects of unrelated factors that exert independent effects on the outcome. However, the net effect of adjustment for many covariables is generally to dampen the predicted impact of the policy, often watering down its selling points. This is entirely appropriate when supported by the science, but adjustments for covariables that are based on arguable assumptions or extrapolations of the evidence can misstate impact with false precision.
Implicit assumptions, therefore, warrant scrutiny before developers build them into a prediction tool. For example, Wehby adjusted not only for maternal age, education, marital status, and race and ethnicity but also for “time-varying, state-level factors”—policies enacted by states that the authors assumed would influence birth outcomes. For each year of analysis, researchers adjusted for whether the state had a statewide waiver that had altered its Aid to Families with Dependent Children program, had implemented Temporary Assistance for Needy Families, had expanded Medicaid, or had an EITC program. They adjusted further based on whether the EITC was refundable and on the level of the state EITC as a percentage of federal credit. These adjustments had a sensible rationale but likely diminished the projected impact attributed to minimum wage policy. Indeed, the authors concluded that raising the minimum wage by $1 would increase birth weight “by a very small amount: approximately 4 grams (0.1 percent).” (italics added) Should this “very small amount” be considered more precise because it is based on so many adjustments? Or is it less precise because it fails to consider the overlapping effects of these policies on birth outcomes?
Some models can inadvertently embed philosophical or even racist assumptions. The philosophical rationale for adjustments is the assumption that the covariable has its own causal influence on the outcome, and because that influence is “expected,” measuring the impact of the policy requires removal of that covariable’s contribution. This assumption is often justified, as when there is a biological reason for a different outcome. For example, for biological reasons, older women face a higher risk of birth complications; therefore, the failure to adjust for maternal age may give too much credit to the policy for preventing infant deaths. States with a lower minimum wage may have higher infant mortality because women giving birth in that state tend to be older. On occasion, however, adjusting for race can embed the problematic assumption that people of color are expected to have higher disease rates.
Case study 2: The health impact of climate policies and pollution
One area ripe for the application of prediction tools is the intersection of climate policy and population health. Environmental scientists have strong data on the potential impact of global warming on environmental outcomes. Decades of research document how rising temperatures will affect the planet, air quality, food and water security, and human capital and increase the risk from severe weather events and natural disasters, ranging from severe and more frequent hurricanes and tornadoes to flooding, extreme heat and cold, and uncontained forest fires. These environmental changes will affect population health in diverse and profound ways.
The health consequences of climate change and pollution
The health implications of climate change and fossil fuel production loom large (see Figure 3) and include not only the lives at stake but also the economic consequences of decreased productivity caused by higher disease rates and the health care costs to treat those conditions.62 Extreme temperatures increase the rates of hospitalization and death from heat-related illnesses, such as heat stroke, and hypothermia. Increases in ozone levels and in airborne ash carried aloft by wildfires can cause respiratory illness across large regions.63 Natural disasters and severe weather events can disrupt the core infrastructure on which public health depends. For instance, flooded roads and downed power lines can block access to food, doctors, and emergency medical services. Contamination of drinking water and sanitation systems can cause infectious diseases,64 and power outages can affect hospitals and expose vulnerable populations to severe cold or heat.65
In addition, many sources of greenhouse gas emissions that cause climate change are emitting other harmful pollutants, such as particulate matter and nitrous oxide, among others. Examples include cars and heavy-duty trucks, power plants, oil refineries, and other industrial facilities, which expose local communities to emissions that increase the risk of asthma, heart disease, cancer, and other illnesses.
Figure 3
More insidious health consequences are expected as climate change worsens, such as diseases and deaths caused by drought and water shortages,66 mass migration caused by the displacement of large populations,67 and the spread of insect- and foodborne diseases.68
Both the immediate and the insidious health consequences of climate change will disproportionately affect marginalized populations and communities, particularly communities of color. The legacy of environmental injustice makes these populations more vulnerable and situates them disproportionately in flood plains, heat islands, and other exposed areas. The economic stresses on these communities make it more difficult for them to recover after natural disasters and rebuild livelihoods, and this disadvantage increases the risk of more severe health complications and deaths.69
Data tools for predicting the health outcomes of climate policies
The range of data tools discussed in this report—including rankings, indexes of need, policy research, and modeling tools—can help federal, state, and local governments and private sector leaders in efforts to improve public health preparedness. For example, indexes of need based on environmental and social risk factors can help identify communities that are more vulnerable to disasters. The National Health Security Preparedness Index,70 the Centers for Disease Control and Prevention’s Social Vulnerability Index,71 California’s CalEnviroScreen72 and Climate Change and Health Vulnerability Indicators (CCHVIz),73 and the Social Vulnerability Index for the United States (SoVI)74 developed by the University of South Carolina are all tools used to identify the most vulnerable communities. The draft Climate and Economic Justice Screening Tool created by the White House Council on Environmental Quality is intended to help implement the Biden administration’s Justice40 Initiative to combat environmental racism. The goal is to identify communities that have been historically marginalized, underserved, and overburdened by pollution and to target at least 40 percent of the benefits of federal climate and infrastructure investments toward them.75 These tools are often hosted on data visualization platforms with mapping tools to identify areas at greatest risk.
Although tools to identify the areas that most need help are coming online, data to quantify the full extent to which climate policies can avert harm are less readily available. Of particular interest is measuring what climate experts call the “co-benefits” of mitigating fossil fuel emissions, such as improved health and averted health care costs. The pace of climate change gives urgency to identifying and using information that quantifies how climate policies will effect changes across policy arenas, including health, housing, utility services, and other critical infrastructure and services. Rather than waiting on evidence that could take years or decades to collect, policymakers who appreciate the urgency of climate change and the potential lives at stake are turning to modeling studies that estimate the magnitude of health benefits and how those benefits will offset health care costs and bolster communities and the economy. Advocacy groups making the case for climate policies also rely on these data and modeling, both to raise awareness among audiences unfamiliar with the links between climate policy and population health and to demonstrate the return on investment in saving lives and curbing medical costs.
Simulation models, an essential tool for making climate change projections and considering potential mitigation strategies such as reducing carbon emissions,76 can be helpful in predicting health outcomes in the absence of long-term epidemiological studies. Models can be designed to piece together existing climate and epidemiological data to estimate the impact of climate change on health outcomes. Since the 1990s, the U.S. Environmental Protection Agency (EPA) has used simulation models77 to predict the health consequences of air pollution,78 and emerging tools are now beginning to forecast the health effects of climate change. An EPA model released in 2017 predicted that by 2050, premature deaths from extreme temperatures in 49 U.S. cities would cost $140 billion per year (see Figure 5) and that reducing carbon emissions to moderate levels79 would prevent 24 percent of those deaths and reduce costs by $11 billion per year. The model also predicted fewer deaths caused by rising ozone levels, saving approximately $3 billion per year, and reductions in the number and costs of West Nile virus infections and emergency department visits for exacerbations of asthma.80
Upon taking office in 2021, the Biden administration reestablished the Interagency Working Group on the Social Cost of Greenhouse Gases. This working group uses simulation modeling to estimate the “social costs” of carbon emissions—the annual monetary damages to agriculture, energy use, human health, and property caused by a 1 metric ton increase in carbon dioxide—which federal agencies rely on to judge the impact of proposed regulations.81 The 2022 report82 of the Intergovernmental Panel on Climate Change features detailed projections generated by an extensive international modeling collaboration known as the Coupled Model Intercomparison Project (CMIP).
Although programs such as the Centers for Disease Control and Prevention’s Climate and Health Program83 and National Environmental Public Health Tracking Network84 are studying the linkages between the environment and health research, there is momentum for an even more robust national investment. For example, the Climate Change Health Protection and Promotion Act, introduced in the U.S. Senate in 2019 and reintroduced in 2021 (S. 1702), recognizes the need for a more robust national program. The legislation, according to its sponsors, would:
- Provide technical support to state and local health departments to develop preparedness plans and conduct community outreach.
- Enhance forecasting and modeling, track environmental and disease data, and expand research capacity to better understand the relationship between climate change and health.
- Prioritize communities that have been harmed by the disproportionate impacts of the climate crisis due to environmental injustices.
- Enhance domestic and international tracking capacity for infectious diseases and environmental health indicators.
- Develop a coordinated research and preparedness agenda on climate and health.
- Require health impact assessments to determine how current and proposed laws, policies, and programs would protect against the health impacts of climate change.85
The bill was referred to committee, and as of the publishing of this report, there has been no further action.
Takeaways from the case studies
These examples illustrate the range of issues that surround efforts to predict the health effects of public policies, ranging from the technical challenges of building models based on a range of existing studies (minimum wage laws) to the challenges of dealing with complexity and uncertainty in the face of a global emergency (climate policy). They illustrate the need for the nation to invest adequately in building the science to enable this work and, when models make predictions about potential effects, for critical appraisal of the methods rather than taking them at face value. Details such as how the models adjusted for confounding variables can strengthen conclusions or embed false assumptions and dubious guesswork.
The importance and challenges of assessing the racial and ethnic impacts of policies
With the recognition of structural racism as a serious threat to public health and a root cause of racial and ethnic health inequities, it is critically important to consider how policies affect people of color and other historically marginalized populations. At the most basic level, this requires a comparison of outcomes across racial and ethnic groups, but granular data for such assessments are often lacking even for the broadest racial and ethnic groups, such as Hispanic and Latino populations and non-Hispanic American Indian and Alaska Native, Asian and Pacific Islander, Black, and white populations. More granular data are needed within these racial and ethnic groups so that health outcomes can be compared among Hispanic and Latino, Asian, and other people from different countries or cultural backgrounds. Race- and ethnicity-specific data are needed not only on inequities in outcomes across these groups but also on structural barriers, social determinants of health, and processes that help create racialized outcomes.86
In modeling studies, a useful strategy to expose the intersectionality between race and social determinants is to stratify group results separately by race and ethnicity. In this approach, the model is run for different racial and ethnic groups to compare the impact of policies across populations. A case in point is the study by Rosenquist and others, which had the foresight to separate data for the non-Hispanic Black and white populations. When examined in aggregate, the model reported that a high minimum wage decreased the odds of infant mortality by 7 percent, but rerunning the model by race and ethnicity showed that the impact was considerably larger in the non-Hispanic Black population (a 20 percent reduction) and was statistically insignificant in the non-Hispanic white population. This additional detail would have been overlooked had the investigators not included race and ethnicity as a covariate.
A useful approach that helps expose the intersectionality between race and social determinants is to stratify group results separately by race and ethnicity.
Similarly, when the Healthy Places Index was calculated for census tracts in metropolitan Washington, D.C., the model revealed that education and economic conditions explained 60 percent of the variation in life expectancy across census tracts. But when race was added to the model, it dominated the other variables, explaining 47 percent of the variation and reducing the influence of education and economic resources from 60 percent to 35 percent.87 This statistic was startling, and advocates for racial equity were eager to publicize the result, but the project concluded that a more appropriate strategy was to contrast the HPI for census tracts that were largely white and those that had large populations of color. Doing so was a more effective strategy for contrasting the stark differences in education, economic, housing, transportation, and health care access that exist in communities of color due to the legacy of systemic racism and discrimination.
Recommendations
Organizations seeking to develop resources to quantify the health impacts of social and economic policies have a range of factors to consider. The factors reviewed in this report support the following recommendations:
1. Be evidence-based—consult the science before setting health or non-health policies. Review summaries of the research on benefits, harms, and costs; eschew policies that are ineffective or lack adequate evidence; and promote policies that save lives and offer the greatest benefits for the least harms and costs.
2. Use decision tools to forecast outcomes and track results. Engage experts in simulation modeling to predict the likely consequences of outcomes and in the development of metrics to track progress and determine the success or failure of policies. The government and other influential decision-makers can use these tools to make better investments. Follow the methodological recommendations in the text box below.
Methodological recommendations for designing data tools to measure policy impacts
- Consider goals: Invest time and effort to clarify the nature of the question to be answered, the purpose for which the information will be used, and the target audience.
- What is the question? The appropriate resource varies with the question: Where are health outcomes the worst or best? Which populations or places face the greatest needs? How large are the disparities across racial and ethnic groups? Is there any evidence that a policy is effective? How effective is it? Do its benefits outweigh its costs? What is the return on investment or the cost-effectiveness ratio? How does effectiveness vary across different settings or circumstances?
- What is the purpose? Is it intended for internal use by an organization (for example, to include in an issue brief or slide presentation), or will the data be presented to outside audiences to argue for/against the policy? What are users expected to do with the information? What outcomes will matter most to the target audience, and what level of scientific or technical detail is appropriate? Are the numbers all that is needed, or does the information need to be presented in an engaging, compelling format? Is the information needed static—a one-time question for a specific circumstance—or does the audience need a dynamic tool that can be used over time and under varied circumstances?
- Begin with pilot-testing: Begin with a use case to test the waters and gain experience with the benefits, challenges, and costs of a modeling tool for predicting outcomes. Go through the steps outlined above, beginning with selecting an ideal use case for the pilot test. As in the minimum wage example above, select a policy that offers multiple studies or data sources from which to choose. Define the goals of the tool and the technical steps in designing the model, including clarifying outcomes of interest, assembling relevant evidence, selecting model design, defining covariates and model assumptions, and programming and testing the model. Based on the success of this exercise, decide whether to proceed with designing an interactive tool, which involves the design, building, and beta-testing of an online or application interface—driven by a statistical engine based on the model—to allow users to predict outcomes of the policy.
- Consider resources: Determine what level of staff time and fiscal investment to dedicate to the research question. Consider in-house capacity for literature review and data analytics and, if needs outstrip internal capacity, the feasibility of outsourcing the literature review and model design to external contractors. Should the decision be made to turn the model into an application or web-based tool, a similar decision must be made as to whether to use in-house web designers and graphic artists or to recruit a skilled design firm.
- Explore recruitment of researchers to access data and design the model: Especially when data and findings from a particular study are highly relevant to the policy of interest, consider engaging researchers who have published their model results. Those investigators are likely to have the datasets and statistical software, such as SAS, R, or Python, necessary to operationalize the model, experience with and useful advice on methodological considerations, potential interest in being recruited to help design the prediction tool, and networks of colleagues who could contribute. If needed, engage early with one or more consultants with expertise in simulation modeling to assess feasibility and ensure the credibility of the calculations. It may also be important to include consultants with expertise on the policy of interest (such as tax policy), health outcomes (such as epidemiology, public health, or medicine), and costs (for example, economics).
- Determine desirability and capacity for customization: Decide whether it is preferable for the tool to have the advantages of simplicity—which could make it more accessible to a lay audience and more effective for advocacy, as it would convey a clear, unequivocal message—or to have customization features and filters that allow the user to explore how predictions change with varied assumptions. Interfaces can become quite complex and visually busy as these customization features are added, and advocacy and messaging efforts can become less convincing when the projected impact shifts from a defined answer to “It depends.” Should the capacity for customization be desired, explore whether the available data are up to the task—whether they are sufficiently granular and whether the underlying assumptions are valid to make these calculations.
- Adjust for confounding variables, but do so cautiously: The models on which prediction tools are based must almost always adjust for factors that are known to have independent influences on the outcome being modeled, and the failure to do so can undermine the credibility of the results. However, for reasons explained earlier, adjustment for covariates can go too far; making too many adjustments can wash away or exaggerate the impact of a policy, especially when the complex interrelationships between covariables are poorly understood. Fixed-effect models that account for known and unknown factors that are common across time or place are often a better strategy than to throw in everything but the kitchen sink. Adding a large number of variables that might possibly influence outcomes can produce imprecision under the guise of precision.
- Scrutinize assumptions: The logic models on which calculations are based should not be accepted at face value, unless there is compelling evidence to support the causal pathway on which the logic model is based. For example, a simulation model might assume that a certain proportion of the population will develop a risk factor for a disease, that a certain proportion of those people will have that risk factor detected at an early stage if they obtain a screening test, that the screening test can be offered to a certain percentage of the population, that having the test will prevent a certain proportion of people from experiencing progression of the disease over a period of time, and that this effect will prevent a certain number of deaths and costs. For each assumption in a model, ask “How well do we know this to be true?” And when there is uncertainty, the use of sensitivity testing is important to determine whether the absence of clear evidence is inconsequential or problematic in making safe predictions.
- Apply an equity lens: Models that predict the impact of policies for the population in aggregate may not clarify differential impacts on vulnerable populations or whether the policy will narrow or widen inequities. Policies that may seem to have trivial or no impact on the population overall may be transformative for low-income communities or people of color. Models cannot clarify this without collecting data that are stratified by race and ethnicity, socioeconomic status, rural and urban classification, or other relevant groupings.
Policies that may seem to have trivial or no impact on the population overall may be transformative for low-income communities or people of color.
3. Connect the dots between non-health policies and health outcomes. Recognize that decisions about issues seemingly unrelated to health care—such as education, neighborhoods, the environment, economic growth, good jobs, livable wages, and other social determinants of health—may have a bigger impact on the health of Americans than anything done by doctors or hospitals.
4. Expand and act on research on the health impacts of climate policy. Recognize that heat waves, flooding, wildfires, and severe weather produced by climate change can disrupt utilities, sanitation systems, and access to drinking water, food, and health care, thereby subjecting Americans to heat stroke, hypothermia, infectious diseases, and respiratory illnesses. Climate policies or inaction are certain to affect rates of disease, hospitalization, premature death, and health care spending. Increasingly, decision-makers will need to rely on data to account for those risks.
5. Invest in research on the health impacts of social and economic policies. Fund statistical agencies, academia, and policy research organizations to gather the data and perform the studies that are necessary to quantify the health impacts of social and economic policies. Create programs that stimulate collaboration between research agencies that currently work in separate silos on public health, economic policy, education, social issues, and the environment.
Conclusion
This report clearly illustrates that policymakers seeking to evaluate strategies to address the social determinants of health have a range of tools available to inform their choices. Tools exist to assess the populations and places with the greatest need and to evaluate the potential effectiveness of policy solutions. Each tool has its strengths and weaknesses and requires scrutiny to recognize the limitations and sources of error each approach introduces. Modeling tools can be extremely challenging to develop and to interpret, but they can also be enormously helpful, especially in simulating likely outcomes in the absence of evidence or under varied circumstances.
It is critical that policymakers consider the health implications of policy options before they act so that they promote policies that save lives and offer the greatest benefits for the least harms and costs. Key to achieving that outcome is to recognize the value of modeling, invest in the research and data gathering needed to make models rigorous and their predictions reliable in assessing health outcomes, and make that information more readily available and accessible.
Acknowledgments
The author would like to acknowledge the Center for American Progress’ Domestic Climate, Early Childhood Education, Gun Violence Prevention, Health, Poverty to Prosperity, and Racial Equity and Justice teams for their input and guidance.