Author’s note: CAP uses “Black” and “African American” interchangeably throughout many of our products. We chose to capitalize “Black” in order to reflect that we are discussing a group of people and to be consistent with the capitalization of “African American.”
Introduction and summary
While more students than ever are completing high school with a diploma, the American education system has a long way to go until each and every student is prepared for what comes after graduation. Almost one-fifth of America’s students fail to graduate high school, and the odds are worse for specific student groups. In the 2016-17 school year, students who were Hispanic, low income, Black, or who have disabilities received a high school diploma at lower rates than their white peers—80 percent, 78.3 percent, 77.8 percent, and 67.1 percent, respectively, compared with 88.6 percent for white students.1 Of those students who do graduate and go to college, about half qualify for what is known as remediation—courses that focus on basic math and reading skills and do not count toward a degree. According to data from the nation’s public two- and four-year higher education institutions, about 30 percent more Black and Hispanic students than white students took a remedial course in the 2015-16 school year.2
Students who are underprepared often do not complete a college degree, wasting valuable time and money.3 But with such widespread rates of remediation across the United States, it is hard to succinctly identify the root of the problem: Are high school students not taking the right kind of English and math courses, or are those classes not preparing them adequately? According to data out of Delaware, the answer is both.
The state of Delaware has the same remediation challenge that is plaguing the rest of the country. But through its unique analysis of high school and college data, it has gotten closer to identifying the root of the problem. The state has pinpointed which high school English and math courses contribute to its college remediation problem and has identified those students least likely to enroll in higher-level 12th grade math and English courses. Both of these data points hold enormous potential to reform high school math and English instruction and transform student academic outcomes.
For Delaware and the nation at large, finding solutions that work within state contexts could not be more urgent. Whether unemployment rates are high or low, those left jobless and underemployed are generally people with low levels of education and Black and Hispanic people.4 In other words, educational attainment gaps eventually become employment gaps.
With the economy becoming increasingly reliant on a workforce with expertise in science, technology, engineering, and math content, as well as skills such as critical thinking, collaboration, and adaptability, those who find employment in the job market will have postsecondary education that is well aligned in such areas and includes both short-term credentials and college degrees.5
Unless significant advancements are made in closing existing gaps in educational attainment, America’s current employment gaps will worsen as the student population becomes more diverse.6 Introduced in 2015, Delaware’s College Success Report (CSR) enables such advancements by connecting high school course outcomes in math and English to college remediation rates in these same subjects. The report provides actionable data at both the school and state levels regarding academic preparation for college and careers. Delaware uses the CSR to generate and sustain discussion about course rigor and instructional practice in high school math and English courses, with equity at the center. By disaggregating its data, the CSR shows that students of color, those from low-income families, students receiving special education services, and English-language learners “are more than 1.5 times more likely to be placed in remedial classes compared to their peers.”7 Furthermore, because Delaware pays for six semesters of community college for its students, a better understanding of the causes of remediation will help the state improve its return on investment. This is especially true given that the current design of the state’s remedial education program essentially means that Delaware is paying to reteach students on content they should have learned in high school.
Delaware’s analysis and use of the CSR provides a model for other states to follow to collect more accurate data about which high school courses in math and English are more likely to result in remediation in college—and to effectively intervene.
Staff at the Center for American Progress met with current and former staff of the Delaware Department of Education (DDOE) to chronicle the state’s process in developing the CSR and to detail their lessons learned so that more states can follow their example. This report first provides an overview of the Delaware CSR, including its inception, findings, and enacted solutions. It then discusses how DDOE staff use the CSR to connect multiple types of data.8 The report concludes with recommendations that would allow other states to benefit from similar analyses.
Overview of the Delaware CSR
Delaware’s College Success Report sprang from an initiative started by then-Gov. Jack Markell (D) and has since been continued by Gov. John Carney (D). In 2013, Gov. Markell announced his Getting to Zero plan, the goal of which is to ensure that no students need remediation when they get to college, and all students who are prepared to go to college enroll.9 The initiative was inspired by the findings of the Strategic Data Project, a report that Delaware commissioned from Harvard University that analyzed the state’s college application and remediation rates and found that 20 percent of “highly qualified” high school graduates with the credentials to apply to college did not.10 Gov. Markell charged the DDOE with improving these statistics.
After internal discussion and consultation with stakeholders, the DDOE decided to analyze college remediation rates for the high school graduating class of 2014, producing a report that in 2015 became known as the state’s CSR.11 Since that report, Delaware has looked at in-state college remediation rates by high school math and English course types and has analyzed these data with increasing detail. The most recent report, issued in 2017, analyzes remediation rates by high school math and English courses. Ultimately, the CSR tries to uncover the exact areas where students are lacking preparedness in these subjects.
The DDOE uses its existing resources—including its State Longitudinal Data System; the expertise of staff from districts, the DDOE, and state colleges and universities; and its pre-K to 20 state advisory council (P-20 Council)—to draft, review, finalize, and publicize the results of the CSR. This team also determines strategies based on the results of the report.
Stakeholders responsible for producing the CSR
The analysis, review, and production of the CSR includes DDOE staff from the following areas: data, math, and English curricula, as well as assessments, all coordinated by the director of the state’s Office of Higher Education. For example, math curriculum staff review all of the results from the math performance analysis to ensure that recommended next steps align with the math team’s work across the state.
Outside entities are also involved in this effort, including college provosts, the state’s P-20 Council, and K-12 school district instructional leads in math and English.12 DDOE staff aim to garner buy-in from each of these stakeholder groups to create shared accountability for identifying problems and solutions. To this end, the colleges involved issue press releases about the data and attend all of the events associated with the report. The district instructional leads also review the data and disburse the information to local schools, and the P-20 Council reviews the recommendations. The council’s established subcommittees then pursue solutions to further the governor’s goal of reducing remediation and ensuring all students who are prepared enroll in college.
The process
For the first two years of the report, 2014 and 2015, the DDOE’s higher education team conducted the analysis in-house. In 2016, however, the agency contracted with a research team from the University of Delaware to coordinate the data analysis so that the state’s higher education team could manage the overall project, report distribution, and communication outreach.
Production of the CSR now follows a four-step process:
- Collect, code, and clean the data over a four-month timeline.
- Conduct the analysis and review initial results with the curriculum teams and P-20 Council subcommittees, gathering their input and questions to include in any additional analysis. This step is completed over a period of three to four months.
- Write the report and discuss its messaging with all teams involved in order to get buy-in on the results and narrative. This step is completed over a period of two to three months.
- Provide K-12 district representatives with a copy of their data and the report before it is publicly released. The representatives have conversations with the DDOE so that they can provide feedback and verify the data. This step is completed over a period of two to three months.
CSR findings
The state’s 2017 CSR reports two groups of data: remediation rates and enrollment rates.
Remediation rates
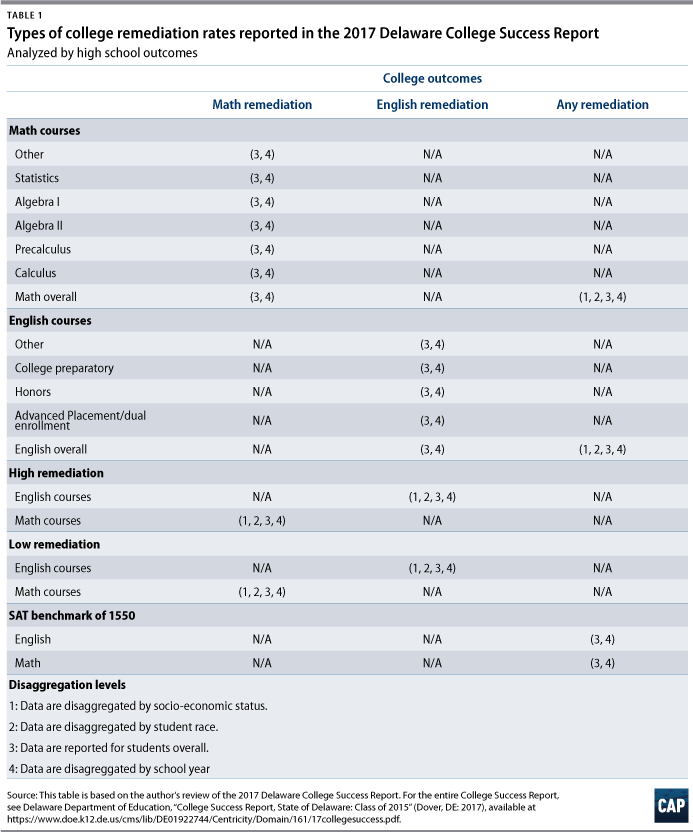
Looking at the class of 2015, the 2017 CSR provides an overall college remediation rate for public school students, at 41 percent, as well as remediation rates specifically in math, at 17 percent; English, at 5 percent; and both English and math, at 19 percent.13 Remediation rates are further disaggregated by specific high school math and English courses. Delaware also provides remediation rates disaggregated by student demographics for English and math courses with high rates of remediation, defined as 60 percent or greater, and low rates of remediation—40 percent or less. Finally, the CSR provides overall remediation rates based on if students met or did not meet the SAT college-readiness benchmark score of 1550. Table 1 details the specific college remediation data reported in the CSR. These data points cover various years, from 2012 through 2015.
Enrollment rates
The 2017 CSR provides three types of enrollment data:14 enrollment in 12th grade English and math course type; transition rates to higher-level English and math courses in 12th grade based on either an 11th grade course grade of B or higher or an SAT benchmark score of 1550 or higher; and enrollment within in- and out-of-state higher education institutions. Ninety-six percent of 12th graders in the class of 2015 were enrolled in a math course and 100 percent of them were enrolled in an English course. Among Delaware’s 11th graders in the class of 2015, approximately one-third transitioned to an Advanced Placement or dual enrollment math course in 12th grade, whereas almost 40 percent of them made this transition if they reached the SAT benchmark of 1550 for college readiness.15 These rates are similar in math among 11th graders who belong to the classes of 2016 and 2017. About 60 percent of Delaware public school graduates enroll in college; slightly less than half of them enroll at in-state institutions, and about 20 percent enroll at out-of-state colleges.
Equity trends in high school course enrollment, transition to rigorous courses, and college remediation
The patterns in the CSR data reveal that African American, Hispanic, low-income, or special education students, as well as English-language learners, often fare worse in accessing more rigorous high school courses and meeting the college-ready SAT benchmark score of 1550; these groups are also more likely to need college remediation. For example, African American, Hispanic, and low-income students are least likely to transition to Advanced Placement or dual enrollment math courses even if they meet the SAT benchmark in that subject. African American and low-income students are also least likely to transition to these same courses in English if they meet the English SAT benchmark score. And African American, Hispanic, low-income, and special education students are least likely to meet the SAT college-readiness benchmark score of 1550, while Asian and white students are the most likely.
Finally, African American, Hispanic, low-income, and special education students, as well as English-language learners, are more likely to be enrolled in English and math courses tied to higher rates of college remediation. These preparation gaps simply reflect research finding that approximately 80 percent of eighth grade students lack the skills to be ready for college-level work by the time they graduate high school.16 Thus, in order to improve high school outcomes, Delaware will need to address earlier grades, in addition to high school grades, and close readiness gaps before they become insurmountable.
Identifying the problem of disconnected data
Before initiating the College Success Report, Delaware conducted a scan of state-produced reports about postsecondary readiness that could provide examples of data analysis for the state to follow. However, these analyses used either K-12 outcome data or higher education outcome data; no report combined these data points, and no report looked at student-level outcomes at both K-12 schools and state colleges or universities. Patterns other than statewide remediation rates were impossible to discern, let alone could be used to develop preemptive and just-in-time interventions to make a difference for students.
Lacking any examples to follow, Delaware decided to customize its analyses. It used its State Longitudinal Data System to triangulate high school student course-taking data, P/SAT test results, college remediation rates, and individual student demographics. This helped the state to better understand the connection between high school course-taking and college remediation rates.
Simply tracking schoolwide and statewide remediation rates masked distinctions—such as remediation rates being associated with specific courses, as highlighted in the above findings—and it prevented Delaware from identifying the root cause of the lack of student preparation. Now armed with remediation rates disaggregated by high school math and English courses at the school, classroom, and student levels, the state could have discussions with various stakeholders about root causes and next steps. Below are five specific solutions that Delaware was able to enact by producing its CSR.
Solutions that Delaware enacted
Guiding philosophy
“It was very important to us to find solutions, not to just identify the problems.” – Shana Payne, director of the Office of Higher Education, Delaware Department of Education17
Increase access to rigorous coursework pathways
Delaware used the course enrollment data that correlated grades and P/SAT scores to identify students who received a B or greater or achieved benchmark scores on the P/SAT but did not transition into higher-level math or English courses, such as Advanced Placement, dual enrollment, or honors. The state provided these data to underscore the importance of initiatives such those identifying students who could achieve passing grades in Advanced Placement courses and holistic reviews of access policies to dual enrollment and Advanced Placement courses. Schools were able to use the data to identify barriers for students and greater value in resources that determine student academic potential to help remove those barriers.
Identify student tracking into less rigorous course pathways
Curious about the high rate of remediation—approximately 30 percent—for the college preparatory English course, DDOE staff spoke with district staff about what could be causing it, as “college preparatory” suggests that students will receive instruction corresponding to college-level work.18 The DDOE staff learned that the “general” English courses were renamed “college preparatory” in order to eliminate the appearance of tracking students into less rigorous courses. Tracking is the controversial practice of grouping students by their academic ability into above-, at-, or below-average groups.19 The state was then able to engage in a conversation to create authenticity and transparency around high school course pathway names. The DDOE also use the data from the CSR to help build buy-in during instructional coaching conversations with school staff.
Additionally, Delaware created two transition courses, math and English, that borrow from Tennessee’s Seamless Alignment and Integrated Learning Support model. The math course is being piloted to provide an alternative option for fourth-year math credits for students likely to need remediation. Colleges agree to waive remediation placement based on students receiving a score of 77 or higher in the course. The English course is offered in 11th grade and helps students access dual enrollment courses in 12th grade based on performance in the course.
Provide additional focus to the Delaware P-20 Council
In 2003, then-Gov. Ruth Ann Minner (D) created Delaware’s P-20 Council through an executive order, charging the body with coordinating early education through postsecondary education across the state.20 The state secretary of education and president of the State Board of Education jointly chair and oversee this council. The council focuses on the transition between grade bands—including pre-K to elementary, elementary to middle school, middle school to high school, and high school to postsecondary education.
Some of the council’s previous efforts in the transition from high school to postsecondary education include establishing the state’s definition of “college and career readiness”; starting the Delaware College Access Network, a group aiming to increase the number of college graduates in the state; and establishing articulation agreements to set statewide policies for the acceptability and awarding of course credit to satisfy high school, community college, or university requirements.21 The council currently reviews drafts of the CSR analysis, informs the narrative, and helps determine next steps for the state education agency and stakeholders, including operating subcommittees that are aligned with the findings of the CSR and the governor’s college- and career-readiness goals.
Create shared accountability among districts, the state, and higher education institutions
Shared accountability in education is the idea of creating a broader community outside of the school that is responsible for identifying problems related to and creating solutions for low student achievement.22 Armed with data about performance in math and English courses at both the high school and college levels, Delaware was able to bring together representatives from these school systems to review the data and determine possible causes and solutions. Given the myriad elements that affect student success, such as course curriculum, instructional practice, educator professional development, and student supports, Delaware brings together a broad coalition of staff from school districts and higher education to address these issues.
Recommendations
States play an important role in improving student outcomes. They have a powerful lever at their disposal: the ability and resources to collect and analyze student data, which they can immediately apply to design interventions and teacher professional development that will affect student learning.
To get there, the federal government should continue to invest in the State Longitudinal Data System.23 In addition to authorizing more money for the program—the most recent federal grants were provided in 2015—Congress and the U.S. Department of Education should emphasize building the capacity of state staff to analyze and utilize the data in ways that support the enhancement of student outcomes, such as connecting these data with labor market data. This would allow educators and policymakers to better understand which academic programs are associated with higher levels of employment in living-wage jobs and in-demand careers.
States, meanwhile, should take the following steps:
- Collect and analyze student course-taking data. This includes tracking which English and math courses students take and their grades in those courses. Tracking these data would allow states to identify to what degree math and English courses specifically are associated with college remediation rates and other outcomes such as college persistence and graduation. These data would also allow states to identify what course sequences are associated with rates of employment and income if states triangulate these data with labor market outcomes.
- Create a uniform course code. Courses that teach the same content may be called by different names. For example, one school may call a course algebra II and another might call that same course advanced algebra. In larger states with more courses, the challenges of creating a common list of courses will be multiplied exponentially. True comparisons of course outcomes cannot be accomplished until a state is comparing like courses. To ensure uniformity, Delaware uses National Center for Education Statistics course codes and groups like courses together. Districts verify that courses are categorized accurately.
- Convene stakeholders within and outside of the education system to discuss the data analysis results. It is important that all stakeholders—including administrators from colleges, school districts, and schools, as well as parents and representatives from the workforce—understand what the data signify and what they do not signify, as well as what appropriate responses might be. Any state undertaking an effort similar to Delaware’s should seek consensus on what the problem is and how to move forward so that stakeholders share responsibility over the next steps and results.
- Eliminate the need for remediation by intervening in earlier grades. States could use predictive analytics of student course grades and test scores in grades nine through 11 to identify the likelihood of a student being placed in remediation in college. The College Success Report currently analyzes lagging, years-old data; analyses based on current information would provide school staff with an opportunity to intervene to make a difference in student outcomes. Such data should not be publicly reported. For example, some states have developed early warning systems within or outside their State Longitudinal Data System to analyze attendance and course-passing rates for eighth and ninth grade students to flag which students might need intervention before they receive too little course credit to graduate high school on time.24
- Create pathways for accelerated graduation from high school. A recent report from the Alliance for Excellent Education and Education Reform Now shows that nationally, nearly 850,000 students—nearly one-third of them from low-income socio-economic backgrounds—are academically ready to enroll in college based on their ACT test scores in 11th grade.25 The report suggests that instead of the traditional senior year in high school, these students could be given the option to enroll in full-time college courses. This pathway potentially reduces time in college as well as its cost.
Delaware and other states could conduct similar analyses and strengthen them by triangulating test data with course grades, attendance, and teacher feedback on student readiness. In addition to identifying students who could enroll in college-level courses full time beginning the senior year of high school, states should consider what policies would help or hinder this process. For example, states may need to create statewide articulation agreements, adjust high school seat-time requirements, and/or create or modify early graduation policies.
- Eliminate low-quality and irrelevant course pathways. Every high school course pathway in math and English should lead to credit-bearing coursework in college and be relevant to students’ future careers. This is especially true for math, since a significant body of evidence shows that college algebra is the primary roadblock to entry into credit-bearing coursework in college and, eventually, to graduation.26 The roadblock is often constructed by three barriers: Students who could succeed in college algebra are inaccurately placed into remedial math; algebra is irrelevant to most students’ majors and future careers, although it is the default math content in America’s high schools; and remedial courses are ineffectively and inefficiently structured, repeating secondary-level math content rather than providing challenging material and often requiring students to take several sequential courses. All too often, the combination of these barriers leads to high attrition rates not only in math, but also in any credit-bearing coursework in college.27
One effort to ensure that math instruction is both high quality and relevant is math pathways, a focus of the Charles A. Dana Center at University of Texas at Austin (UT Austin).
Math pathways at the Dana Center
The Dana Center at UT Austin defines “math pathways” as “pathways [that] enable students to take different paths through the math curriculum, making the math students learn relevant to their programs of study and careers. Model pathways vary but often focus on statistics, quantitative reasoning, or algebra/calculus.”28 Often, these are designed as accelerated courses, allowing students to earn more credit in less time.
Math pathways began locally at various community colleges that had high rates of remediation—a common occurrence for noncompetitive institutions. Given the pathways’ high rate of success compared with traditional remedial education courses, states and districts are now adapting and adopting these practices in high schools. For example, students in a math pathways course in Indiana passed that course at a rate of 64 percent. A similar program at the City University of New York saw pass rates of 55 percent, and results were similar for a math pathways program in Tennessee.29 These pass rates are more than double those of traditional remedial education courses. The Dana Center is now leading a multiyear, multistate effort to implement math pathways in high schools.
Remaining challenges
The data analysis produced by Delaware’s CSR is not required by federal law. As such, it is self-funded and requires state leadership to declare that this report is a priority significant enough to commit resources sustained over time.
Delaware had several advantages in this regard. Through its federal Race to the Top grant, the state education agency established written agreements to share student-level data with its state colleges, making the triangulation of high school to college course data possible. In addition, it tracked student-level course-taking rates for its high school students. States without these advantages will need to take these initial steps. Even if states already track student course-taking data in high school, they will need to ensure that courses match across schools—that is, whether courses that have different but similar names are in fact teaching the same content. State education agencies alone cannot answer this question; they must involve their districts. Additionally, states larger than Delaware will need to carefully coordinate how to engage with a large number of school districts.
What’s more, high-quality data analysis must be accompanied by consistent, high-quality action over the long term. State education agencies interested in conducting this kind of analysis will need to make the case to each new governor that this effort is worth supporting. Institutionalizing this work within and across state agencies and colleges would support its sustainability.
Conclusion
As the world of work continues to evolve, policymakers must create an education system that can provide students with the knowledge and skills that are in demand. In order to build these skills, students must graduate high school ready for what is next: college and careers. However, students cannot access that next step if they lack basic skills in reading and math. Delaware’s data-driven approach to understand more succinctly where students are failing to acquire these skills is promising—and it is an approach that more states should adopt.
About the author
Laura Jimenez is the director of standards and accountability on the K-12 Education Policy team at the Center for American Progress.
Acknowledgments
The author would like to thank current and former staff of the Delaware Department of Education for their participation in interviews for this report.
Appendix: DDOE staff interviews
This report relies on interviews with two staff members of the Delaware Department of Education: Ryan Reyna, former director of the Office of Accountability and Data Management, and Shana Payne, director of the Office of Higher Education. Reyna was interviewed on February 27, 2019, and Payne was interviewed on March 8, 2019.
Both interviewees were asked the following questions; their responses informed the overview of the College Success Report, identification of the problem of disconnected data, and solutions enacted by Delaware.
- In 2017, the type of analysis Delaware conducts for its CSR changed. What was your rationale for analyzing college remediation data differently?
- What data did you use to conduct the 2017 analysis?
- Did you have the necessary data available at the state level or did you need to collect new data for the 2017 analysis?
- Who within the state education agency (SEA) was involved in the decision to conduct a new analysis for 2017?
- What surprised you, or not, about the findings?
- How are you now talking about the analysis findings within the SEA and externally?
- How did you roll out this report? What feedback did you get?
- What are the implications of the findings at the student, teacher, school, district, and SEA levels?
- What recommendations do you have to other states that are not collecting and/or analyzing this data?