Over the past eight years, the United States has experienced a remarkable explosion of innovation and entrepreneurship in clean energy. The U.S. energy sector has steadily transformed to a cleaner one with electricity production from wind quadrupling and utility-scale solar electric generation increasing 40-fold. Throughout this transformation, the energy sector has maintained affordability and reliability and supported clean energy jobs for millions of Americans. The clean energy sector will continue to build on this foundation, given the powerful forces of technological innovation, ever-lower costs, and broad business and public support that have coalesced around clean energy.
Since taking office, however, President Donald Trump and his administration have set in motion numerous efforts to dismantle the clean energy growth engine. The Trump administration’s budget, for example, starves support for continued clean-energy innovation and its regulatory agenda undermines energy efficiency initiatives and repeals or rewrites critical air and water protections to favor fossil fuel production and interests. Moreover, President Trump has abandoned efforts to reduce carbon emissions—most notably by announcing the withdrawal of the United States from the Paris climate agreement.
America’s success on clean energy in the past eight years was fostered in no small measure by the prior administration’s efforts to create an environment that nurtured strong growth and encouraged innovation. Now that the U.S. Energy Information Administration (EIA) has published complete energy statistics for 2016, the public can evaluate the effect of President Barack Obama’s energy policies and the market conditions they encouraged.1 These data provide a baseline for charting future progress—and obstacles to that progress—along several important dimensions, including:
- The share of clean technologies in the U.S. electricity mix
- The size of the U.S. government commitment to research, development, and demonstration for clean energy
- The use of tax policy and other financial incentives to lower the cost of deploying clean energy technologies
- The use of other government authorities to encourage deployment such as procurement and promoting renewable energy projects on public lands
- The development of updated product standards and the encouragement of voluntary actions to improve the energy efficiency of the U.S. economy
- Actions to facilitate job growth and understand employment trends in the clean energy industry.2
The U.S. electricity generation mix has changed
The U.S. electricity sector, in which discernable changes in the energy mix typically occur slowly, experienced substantial and observable changes over the past eight years. This level of change is remarkable given the sector’s size and complexity. Nationwide, electricity is generated by around 7,700 operating power plants and delivered to 147 million customers—the number of entities that consume electricity at one electric meter—who spent about $400 billion in 2015 on electric bills.3 In 2008, the largest contributor to U.S. electric power supply, across all sectors of the economy, was coal-fired generation, accounting for more than 48 percent of U.S. electric generation.4 By 2016, coal was no longer the dominant source of U.S. electric supply. Natural gas-powered electricity plants grew from providing 21 percent of electric generation in 2008 to 34 percent in 2016, while the share from coal-powered plants declined to just more than 30 percent of the total electricity produced.5
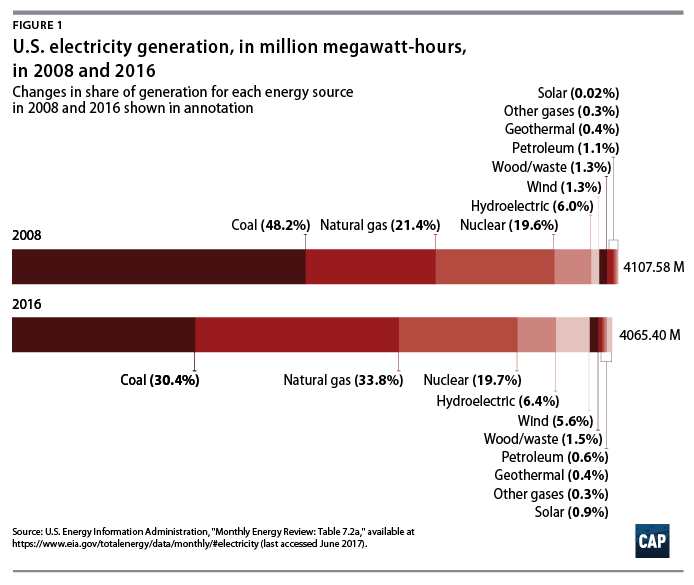
The increased share of natural gas in electricity generation is a consequence of the introduction of new techniques for producing natural gas, which expanded available domestic resources and lowered its price relative to coal. From 2008 to 2015, U.S. proved reserves of natural gas increased from 255 trillion cubic feet to 324 trillion cubic feet.6 Increasing natural gas production from 2008 to 2016 was accompanied by a substantial decrease in natural gas prices.7

Wind and solar electric generation increased substantially from their 2008 base
Between 2008 and 2016, renewable energy grew significantly, led by increases in wind power.
Several Obama administration policies and initiatives played a key role in the remarkable growth of wind and solar electric generation at utility-scale facilities—generation facilities above 1 megawatt in size—from 2008 to 2016. Those policies included the following:
- President Obama worked with Congress on a bipartisan basis to extend tax credits for investment in and production of renewable energy: the Investment Tax Credit (ITC) for solar power and the Production Tax Credit (PTC) for wind and other renewable energy. These tax incentives have lowered the levelized cost of electricity for new wind and solar generation projects and enabled them to compete with conventional energy sources that have received equivalent—or greater—tax and other incumbency advantages over many decades. One recent EIA analysis shows how this makes new wind generation and solar photovoltaic projects cost-competitive with natural gas power plants.8
- The Obama administration addressed and removed market barriers to the introduction of these clean energy technologies, through loan guarantees for new facilities and programs such as the SunShot Initiative.9
- The Obama administration strongly promoted research and development on clean energy technologies. From Fiscal Year 2008 to FY 2016, U.S. Department of Energy (DOE) spending for energy efficiency and renewable energy research, development, and demonstration grew from $1.24 billion to $2.07 billion, an increase of 68 percent. Within this increased investment, solar and wind power research, development, and demonstration grew from $215 million in FY 2008 to $337 million in FY 2016, an increase of about 57 percent.10
The DOE’s SunShot Initiative
In 2011, the Obama administration launched the DOE’s SunShot Initiative, setting the goal of cost-competitive solar energy by 2020 without subsidies. Through increased funding for research, development, demonstration, and deployment, as well as collaboration with the national labs and private-sector, academic, state and local government, and nonprofit partners, the SunShot Initiative achieved 70 percent of its goal by 2016. In other words, between 2010 and 2016, the cost of residential solar photovoltaic systems had fallen from 42 cents per kilowatt-hour to 18 cents per kilowatt-hour on the path to the SunShot goal of 9 cents per kilowatt-hour by 2020. Similarly, utility-scale solar photovoltaic system costs had fallen from 27 cents per kilowatt-hour to 7 cents per kilowatt-hour over the same time.11
- The Obama administration implemented an aggressive plan to site renewable energy projects on the public lands and in offshore waters. Secretary of the Interior Kenneth Salazar and his successor, Secretary Sally Jewell, rejected the U.S. Department of the Interior’s traditional focus on promoting only fossil fuel projects on public lands. By working closely with the renewable energy industry and key stakeholders, and championing environmental review and permitting reforms, the department approved 60 commercial-scale renewable energy projects on public lands with an estimated total capacity of 15,500 megawatts of electricity—enough to power approximately 5 million American homes.12
- The Obama administration and many of its cabinet agencies implemented sustainability goals and practices that provided expanded market opportunities for renewable energy.13 The U.S. Department of Defense, for example, committed to purchase 3 gigawatts of renewable energy at its bases by 2025; as of the end of 2016, the department was on track to meet that commitment.14
Energy and public lands
Prior to 2009, the U.S. Department of the Interior, which manages much of the federally owned public land and offshore waters in the United States, focused almost entirely on promoting oil, gas, and coal development, to the exclusion of renewable projects. Indeed, despite its jurisdiction over tens of millions of acres of public lands in the sun-drenched American southwest, hundreds of applications for solar projects were sitting on the shelf at the Interior Department in January 2009. Shortly after taking office, Interior Secretary Salazar created an Energy and Climate Change Task Force that provided a first-ever focus on expanding renewable energy development on public lands and offshore waters.15 The task force developed innovations including the creation of “solar energy zones” in the southwest and “wind energy areas” off the Atlantic coast to achieve the twin aims of expediting approvals and improving environmental outcomes.16
The combination of significant past investments by industry and the federal government with these more recent investments and policy initiatives has greatly lowered the costs of deploying key clean energy technologies.17 This has created what is termed a virtuous cycle where falling costs have spurred additional deployment, which in turn has led to further economies of scale and cost reductions from accumulated experience in the deployment of these technologies.

As a result, overall U.S. wind power generation quadrupled from 2008 to 2016, from 55.4 million megawatt-hours to 226.9 million megawatt-hours.18 The strong growth in wind power generation has now positioned this resource just behind conventional hydroelectric power generation as a contributor to U.S. electric power supply.19

The preceding graph shows aggregate annual totals for generation. A look at month-by-month totals for 2016 shows that, for the last four months of 2016—September, October, November, and December—the amount of electricity generated by wind power was greater than the amount generated in those months from conventional hydropower.20

Since the construction of wind-power generation continues to grow at a strong pace, while the number of large hydroelectric power facilities is not increasing, wind power can be expected to surpass hydroelectric power in terms of annual generation of electricity in the near future.
Solar electric power generation in utility-scale systems—which are larger than most rooftop and distributed solar systems—grew more than 40-fold from 2008 to 2016, from 864 thousand megawatt-hours to 36,754 thousand megawatt-hours.21 Within this overall 40-fold growth in utility-scale solar is an even more striking development. Before the Obama administration, there were no photovoltaic (PV) solar plants greater than 100 megawatts operating in the United States.22 In 2008, total utility-scale solar PV generation was only 76 thousand megawatt-hours.23 The DOE Loan Programs Office helped finance the first five large PV generating facilities. After these facilities demonstrated the technology and helped the financial community understand the low level of risk, the private sector built another 45 large PV generation projects on its own.24 In 2016, utility-scale solar PV generation reached 33,367 thousand megawatt-hours, or 33.4 million megawatt-hours,25 a 440-fold increase over the level generated in 2008.

Smaller, distributed solar electric power generation systems also have grown strongly in recent years. Growth for distributed solar from 2014 to 2016 has been significant: EIA estimates more than 70 percent growth from 11.2 million megawatt-hours in 2014 to about 19.5 million megawatt-hours in 2016.26 The combined total of EIA’s figures for solar electricity generation from utility-scale and smaller scale facilities in 2016—56.2 million megawatt-hours—is just above the level of wind power generation in 2008. As solar electric generation technology continues to drop in cost, there is great promise for continued growth in the utilization of this clean energy resource.
Carbon dioxide emissions from electricity production dropped significantly
The trends in the U.S. electricity generation mix from 2008 to 2016 have had a significant effect on carbon dioxide, or CO2, emissions from this sector. Over the past eight years, CO2 emissions in the electric power sector have dropped by 23 percent, from 2,373 million metric tons in 2008 to 1,821 million metric tons in 2016.27 This decline in emissions is impressive, because electricity production varied up and down only slightly during the same time: From 2008 to 2016 overall, net generation in the electric power sector declined by only 1.4 percent, from 3,974 million megawatt-hours to 3,920 million megawatt-hours.28 This means that the carbon dioxide intensity of the electric power sector, that is to say, the amount of carbon dioxide emitted per unit of net electricity generation, declined by more than 22 percent.

This accomplishment is important to overall national progress on reducing greenhouse gas emissions. The process of generating electricity is the single largest source of CO2 emissions in the United States; the electric power sector is responsible for approximately 35 percent of total U.S. CO2 emissions.29
The commitment to increasing energy efficiency grew
Over the same eight-year period, the U.S. economy continued its long-term trend since the 1970s toward lowering the amount of primary energy needed to produce $1 of gross domestic product—known as energy intensity.30 From 2008 to 2016, the amount of energy consumed per $1 of real gross domestic product fell by more than 12 percent. The decline in the energy intensity of the U.S. economy reflects a combination of greater energy efficiency over time and structural changes in the economy. It is projected that the energy intensity of the U.S. economy will continue to decrease over the next few decades.31

The DOE nearly doubled the amount of research, development, and demonstration on energy efficiency in vehicles, buildings, and industrial and manufacturing processes, from $379 million in FY 2008 to $739 million in FY 2016.32 During the Obama administration, from FY 2009 to FY 2016, DOE distributed $6.59 billion to state and local governments to make low-income homes more energy efficient through its Weatherization Assistance Program.33 DOE also exercised its statutory responsibility to promulgate energy efficiency standards more vigorously, issuing about 50 energy efficiency standards governing appliances, heating and cooling equipment, lighting, and electronics—more standards than were issued under any previous administration. Taken together, these energy efficiency standards will save consumers $550 billion on their energy bills and avoid about 3 billion tons of carbon dioxide emissions by 2030.34
The U.S. Environmental Protection Agency’s ENERGY STAR program, a nonregulatory program to promote greater energy efficiency in appliances, commercial equipment, industrial processes, and buildings, also marked several accomplishments:
- In the 17 years from the inception of the program in 1992 through the end of 2008, about 3 billion ENERGY STAR certified products were purchased by consumers. From 2009 to the end of 2015, another 2.5 billion ENERGY STAR certified products were purchased, 300 million in 2015 alone.35
- As of the end of 2008, about 125,000 buildings, representing about 7 billion square feet of floor space, had been benchmarked for energy efficiency using ENERGY STAR Portfolio Manager. By the end of 2015, this number had grown to a cumulative total of more than 450,000 buildings, equaling 40 billion square feet of floor space.36
- As of the end of 2008, the cumulative energy saved by the program since 1992 was estimated at about 1.2 trillion kilowatt-hours. By the end of 2015, the cumulative energy saved by the ENERGY STAR program had grown to about 3.4 trillion kilowatt-hours.37 The 2.2 trillion kilowatt-hours of energy saved during these seven years is an amount roughly equivalent to the electricity consumed by all U.S. households over the past 18 months.38
- By September 2016, about 91 percent of households surveyed recognized the ENERGY STAR mark, and 45 percent of households had knowingly purchased an ENERGY STAR-labeled product in the preceding 12 months.39 A study in 2011 showed that the ENERGY STAR mark tied with the Good Housekeeping seal as the most influential consumer emblem in the nation.40
In addition to increasing emphasis on energy efficiency through federal programs, the Obama administration encouraged energy-efficiency commitments by a host of state, local, and tribal governments and other organizations.41 The administration also challenged electric utilities to provide customers with better access to their energy use data through a standardized “Green Button,”42 and organized partnerships such as the Better Buildings Alliance to increase access by building owners to DOE’s network of research and technical experts and to facilitate sharing of best practices for building energy management among building owners and operators.43
Advances in energy efficiency and clean energy production created jobs
The growth of clean energy and energy efficiency not only saved consumers money and improved the environmental performance of the energy sector, it also created new jobs. Federal labor data categorization makes it difficult to account for clean energy jobs accurately prior to 2010. For example, the data identifies residential solar installation establishments as electrical contractors, not solar companies.44 Starting in 2010, nonprofits began charting clean energy job creation more accurately, followed by the DOE’s 2016 and 2017 editions of the U.S. Energy and Employment Report.
Energy efficiency accounts for the largest category of clean energy job creation in recent years. with an estimated 2.2 million jobs in the first quarter of 2016, an increase of 7 percent over the previous year.45 Of the 6.5 million U.S. construction workers in the first quarter of 2016, about 21 percent of them worked to support the construction or installation of energy-efficient technologies.46
Solar electric generation accounts for the second largest category of clean energy jobs with a 24.5 percent increase among employees who spend most of their time on solar work, from about 209,000 employees to 260,000 employees, between 2015 to 2016.47 Solar sector workers who spent at least some portion of their time working on solar technologies numbered nearly 374,000 employees in 2016.48

Wind power represents the third-largest category of clean energy jobs and accounts for slightly more than 77,000 workers in 2015 and nearly 102,000 workers in 2016, a 32 percent increase in employment in one year.49 The American Wind Energy Association reported a 20 percent increase in employment from 2014 to 2015.50 Like the solar sector, the largest share of employment in wind generation of electricity is in construction.
A common thread among all three of these segments of the clean energy industry is that their employment growth in recent years has greatly outpaced the growth rate of all nonfarm U.S. employment, which increased by 2.21 percent from January 2014 to January 2015, and by 1.85 percent from January 2015 to January 2016.51 The effective mixture of policies and financial incentives under the Obama administration has helped make clean energy a bright spot in the overall U.S. economy.
Conclusion
During President Obama’s two terms in office, the United States successfully harnessed the opportunities presented by a history of American innovation and entrepreneurship, a growing public desire to reduce carbon emissions from fossil fuels, and declining costs of renewable energy and energy efficiency technologies to turbocharge its clean and efficient energy production and use. This resulted in a remarkable shift in the direction, performance, and emissions of the U.S. energy sector. Prior skepticism about clean energy gave way as utility-scale clean energy projects provided “proof of concept” that renewable energy produced in the United States could—and should—be a foundational element of America’s energy system. As the electricity market opened to cleaner technologies the costs of those technologies went down, job numbers associated with them went up, and Americans embraced an energy future increasingly fueled by clean, domestically produced, renewable energy.52
For political rather than economic reasons, the Trump administration has chosen to favor its supporters in the fossil fuel industry by providing blustery advocacy for increased coal, oil and gas production, while virtually ignoring the economic growth opportunities and intrinsic environmental benefits of the clean energy sector.53 But making energy a partisan issue helps no one. At the end of the day, the question will be whether the United States will continue to move forward and win the technology race to produce affordable, sustainable energy in the United States and globally. The facts are now in: In the past eight years, success on clean energy has introduced momentum in the U.S. energy system and markets and set a new, much higher standard for policies and public investment against which future administrations will be judged
Robert M. Simon is the former principal advisor to the director for energy, transportation, and resources in the White House Office of Science and Technology Policy and a former staff director of the U.S. Senate Committee on Energy and Natural Resources. David J. Hayes is a senior fellow at the Center for American Progress and the former deputy secretary of the U.S. Department of the Interior. Luke Bassett, the associate director of domestic energy and environment policy at the Center, contributed to editing this issue brief.