Infrastructure is the foundation of America’s society and economy. Yet not all investments are worthwhile. In fact, unnecessary projects create a long-term, unproductive cost burden—a form of infrastructure overhang. The “White Elephant Watch” series profiles projects that demonstrate the failures of the current U.S. policy approach to transportation infrastructure.
Under current federal transportation policy, states are not held accountable by the federal government for their investment decisions. Instead, the federal government provides states with dedicated highway money, which reflects the political power of certain elected officials and regions as opposed to local needs or potential returns on investment. Under this system, states are not required to demonstrate the social, environmental, or economic value of their projects. Beyond certain procedural and design requirements, states have total discretion, which often results in projects that fail to provide clear benefits or to advance national transportation policy objectives.
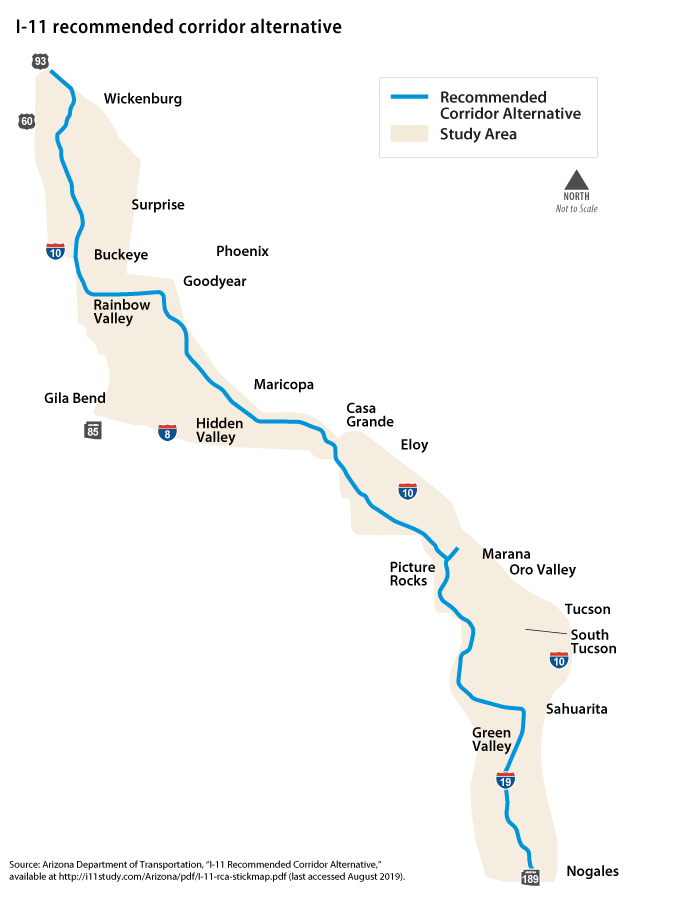
The steady flow of federal funds means that even highly questionable projects can advance. For instance, the Arizona Department of Transportation (ADOT) has proposed to build Interstate 11 (I-11). The new highway would run approximately 280 miles from Nogales, Arizona, along the border with Mexico to Wickenburg, Arizona, which is located about 50 miles northwest of downtown Phoenix. Most of the corridor would run either through pristine areas with delicate wildlife and habitats or along the exurban fringe of Tucson and Phoenix. The project has an estimated cost of $7.3 billion.1
In addition to significant environmental harm, the proposed highway would spur unsustainable low-density, auto-dependent development and increase the number of single-occupant vehicle trips within the Phoenix and Tucson metropolitan regions. Moreover, the project runs counter to the desire of voters in Phoenix to build a multimodal community with abundant transportation choices that would reduce private vehicle use and increase transit and nonmotorized trips, including biking and walking.
The purpose and need for I-11
ADOT offers five unconvincing justifications for I-11. First, ADOT argues that the new facility would provide a “high-priority, high-capacity, access-controlled transportation corridor to serve population and employment growth.”2 Arizona is indeed growing rapidly—on this point, there is no debate. Since 2000, Arizona has grown at a compound annual rate of 1.7 percent, adding 1.67 million people.3 This is slightly more than double the U.S. population growth rate over the same period.4
This impressive growth is highly concentrated within the Phoenix metropolitan area. In fact, the Phoenix metropolitan statistical area, which includes both Maricopa County and Pinal County, is responsible for 78 percent of all population growth in the state since 2000. Over the next 20 years, the state of Arizona expects the Phoenix metro region to grow by 1.8 million people, accounting for 83 percent of statewide population growth.5
The rapid and sustained growth of metro Phoenix has important implications for judging the value of the proposed I-11 project, given that most of the trips that residents make on a daily basis are local. According to data from the Federal Highway Administration, 73 percent of all vehicle trips are fewer than nine miles in length, and the average commute distance is 12.7 miles.6
According to data collected by ADOT, the 10 most heavily used highway segments in the state are located along I-10, which runs east to west within metro Phoenix.7 Additionally, I-17, which runs north to south within metro Phoenix, accounts for 11 of the top 50 most used segments in the state.8
The fundamental challenge facing Arizona is how to efficiently, sustainably, and cost-effectively accommodate rising travel demand within the Phoenix metropolitan area. Yet the state is proposing a roughly 280-mile interstate highway designed for long-distance, interregional travel. In short, ADOT is proposing the wrong solution for its largest transportation challenge.
In its second justification, ADOT claims that I-11 is necessary to “[e]nhance access to the high-capacity transportation network to support economic vitality.”9 However, this is simply a restatement of the first justification, offering no new reasoning. The state wants to ensure continued economic growth, which is a perfectly reasonable policy goal. However, I-11 is not the right investment to make given the challenges created by a rapidly expanding metro Phoenix.
ADOT’s proposed I-11 corridor has four major flaws:
- Fails to increase transportation choice or reduce local single-occupant vehicle trips made within the Phoenix and Tucson metro areas
- Promotes low-density land use and dependence on automobility
- Produces significant environmental harms
- Is based on flawed travel demand models that do not adequately account for induced demand
Instead, ADOT’s supply-side investments should focus on high-capacity public transportation, including rail and rapid bus service. The city of Phoenix already has 4,850 miles of public streets.10 The challenge going forward is how to increase the efficiency and productivity of this roadway network. The focus should be on moving more people—as opposed to more light-duty vehicles—per hour. For instance, ADOT should help the city dramatically improve its bus service by providing funding to convert general travel lanes into dedicated bus lanes; reconfiguring traffic signals to periodize transit vehicles; and modernizing payment systems to allow digital and off-board fare collection. On the demand side, ADOT should begin implementing variable congestion pricing on the most heavily traveled highway corridor, as well as look into cordon-based pricing around downtown Phoenix during the morning and evening peak periods.
In its third argument, ADOT claims that I-11 would support “improved regional mobility for people and goods to reduce congestion and improve travel efficiency.”11 ADOT is correct that it needs to make strategic investments to improve mobility within the Phoenix region. However, it is difficult to understand how building a 280-mile highway that would skirt the western edge of Phoenix would achieve this goal.
Rising freight demand is a common justification for highway projects. ADOT argues as part of its regional mobility justification that the preferred I-11 corridor “offers long-distance travelers an opportunity to avoid the congestion in Phoenix” and “effectively attracts and diverts long distance truck traffic away from existing roadways.”12 Transportation officials correctly point out that efficient freight movement is essential for economic production and supplying the goods that households consume every day.
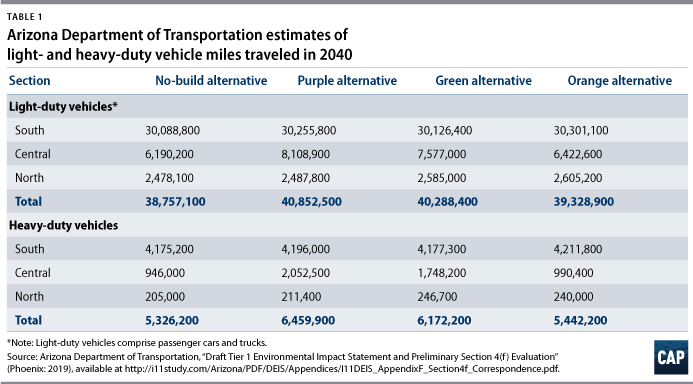
Yet when highway boosters make dire pronouncements about the harm caused by freight bottlenecks, they often omit a critical fact: Light-duty vehicles are responsible for the supermajority of vehicle miles traveled (VMT) and, by extension, congestion. ADOT’s own travel demand model estimates that heavy trucks would account for only 16 percent of VMT on the proposed corridor:
Input from freight shippers and receivers to the Arizona State Freight Plan (ADOT 2017c) affirmed that they are largely satisfied with the current performance of the transportation system, with the exception of recurring congestion and bottlenecks in urban centers. [emphasis added]13
ADOT states that even after construction of the new facility, “I-10 will continue to carry a significant amount of traffic through the Tucson area and will continue to be used as a primary connection to downtown Tucson.”14 Again, this statement reflects the local nature of metropolitan travel and that most residents of Tucson would not have a reason to use a bypass.
ADOT claims as its fourth justification that the proposed I-11 corridor would “[c]onnect metropolitan areas and markets in the Intermountain West to Mexico and Canada through a continuous high-capacity transportation corridor.”15 Of all the stated justifications, this is the only one regarding long-distance travel. And importantly, such a corridor already exists. A combination of interstate highways already provides this commercial link; the challenge is one of allocation. Currently, these facilities are overwhelmingly used by drivers making local trips due to a combination of factors, including a lack of robust public transportation and nonmotorized alternatives; low-density land use that increases vehicle miles traveled; and the absence of any roadway pricing mechanisms to encourage low marginal productivity trips to be taken during off-peak hours or using transit or alternative routes.
For its fifth justification, ADOT says that I-11 would “[p]rovide for regional route redundancy to facilitate efficient mobility for emergency evacuation and defense access.”16 Of all the justifications provided by ADOT, this one is the most dubious. Arizona already has 144,959 lane miles of roadway, including 13,986 lane miles of interstates, freeways, and other principal arterial roadways.17 Constructing I-11 would expand Arizona’s total lane miles of arterial roadways and highways by only 6.5 percent. Moreover, every major transportation investment could theoretically invoke emergency and national defense justifications. ADOT does not provide any explanation for why I-11 is uniquely suited to achieve these ends.
Finally, the analysis reveals that ADOT views driving demand as largely fixed. ADOT’s travel demand model estimates that VMT would vary by only 5 percent for light-duty vehicles and 21 percent for heavy trucks between the no-build alternative and the purple alternative.18 (see Figure 1) This result is deeply puzzling and troubling because it runs counter to decades of research on travel demand. Research shows that drivers respond to prices—both explicit, in the form of gas and tolls, and implicit, in the form of lost time due to congestion.19 As prices rise, demand falls; and as prices fall, demand rises.
ADOT’s principal argument for I-11 is that in the absence of expansion, future growth will lead to highways with a very low level of service—a qualitative scale for grading roadway performance from A to F. The degraded roadway performance project by ADOT should translate into reduced VMT under the no-build scenario. In other words, the prospect of lengthy travel delays brought about by congested highways should cause Arizona residents to make fewer trips. Yet as noted above, ADOT’s model does not reflect this reality.
Conversely, adding more than 800 lane miles of new limited-access highway should significantly boost VMT for the three build alternatives. (see Figure 1) As cars are diverted onto the new pavement of I-11, space should open up on existing roadways, allowing Arizona residents with pent-up travel demand to make more trips because the cost has been effectively lowered—a phenomenon known as induced or latent demand.20 Todd Litman of the Victoria Transport Policy Institute defines induced demand as, “Road improvements that reduce travel costs attract trips from other routes, times and modes, and encourage longer and more frequent travel.”21 Yet ADOT’s analysis has no discussion of induced demand.
In fact, ADOT claims the opposite will happen. ADOT states that one of the induced effects of building I-11 is that I-10 would experience “a reduction in traffic volumes potentially reducing congestion. This could improve regional air quality and could reduce future delays due to congestion.”22 The only way this statement could be true is if travel demand were completely unresponsive to changes in price. The assertion seems all the more puzzling since the state projects heavy population growth within metro Phoenix.
Equally concerning is how much money ADOT wants to spend to achieve modest performance improvement. After spending $7.3 billion, ADOT estimates that end-to-end travel times between Nogales and Wickenburg during the afternoon peak period—a window chosen by ADOT to magnify the effect—will improve by only 18 percent to 20 percent.23 Even this modest benefit deserves some skepticism. Given the apparent lack of elasticity in ADOT’s travel demand model, it may underestimate induced demand and delay for the preferred build alternative and may overestimate demand under the no-build alternative, leading to a larger estimated time savings than would actually materialize should the state move forward with I-11.
I-11’s environmental damage
Building I-11 would cause significant environmental harm. According to the Arizona Department of Transportation, I-11 would run through six major biotic communities, which the state defines as “distinct assemblages of plants and animals that are characteristic of the surrounding soils, geology, climate, and other environmental conditions.”24 The construction of I-11 will impact numerous plants and animals protected under the Endangered Species Act, air and water quality, and land use, among other effects.
The various build alternatives under consideration by ADOT would affect “undisturbed lands of the Sonoran Desert” along with the Saguaro National Park, Avra Valley, Ironwood Forest National Monument, Tucson Mountain Park, and Vulture Mountains Recreation Area.25
The I-11 corridor would affect 10 aquatic and riparian species listed under the Endangered Species Act, including the Chiricahua leopard frog, the yellow-billed cuckoo, and the Yuma Ridgeway’s rail. Additionally, the build would “increase accessibility to wildlife refuges and IBAs [Important Bird and Biodiversity Area] utilized by migratory birds and other sensitive wildlife.”26 Beyond the species listed in the Endangered Species Act, the corridor would also negatively affect numerous species listed as sensitive under various federal statutes. ADOT’s environmental analysis estimates that the three alternatives under consideration would affect “3 amphibians, 20 birds (including bald and golden eagles), 3 fish, 2 invertebrates, 13 mammals (including 8 bats), 21 plants (including Tumamoc globeberry), and 12 reptiles.”27
According to the U.S. Environmental Protection Agency, several counties in Arizona are in nonattainment for various criteria pollutants under the Clean Air Act. For instance, Maricopa County is in nonattainment under the eight-hour ozone and particulate matter of 10 microns (PM-10) rules.28 Pinal County has even worse air quality, with nonattainment for the eight-hour ozone, lead, PM-10, PM-2.5, and sulfur dioxide rules.29 Pima County is in nonattainment for PM-10.30
ADOT argues that building I-11 could improve regional air quality—a claim that deserves serious skepticism. According to research by the federal government, both light- and heavy-duty vehicles release fewer harmful emissions at higher speeds.31 This means that internal combustion engines are more efficient at higher speeds than when idling or engaged in stop-and-go traffic and low-speed travel.32 ADOT uses its travel demand model to claim that building I-11 would reduce congestion and increase vehicle speeds, thereby improving air quality. In effect, ADOT starts with the narrow fact that internal combustion engines are more efficient at higher speeds to make an aggressive claim about regional air quality.
Furthermore, ADOT suggests the efficiency gains from expansion would be so substantial that they could offset the effects of increased VMT, stating, “Improvements in speeds generally reduce emissions of criteria pollutants and can even offset increases in VMT.”33 However, at a certain point, efficiency gains are overwhelmed by total use. Given the rapid expansion of metropolitan Phoenix and the apparent inelasticity of ADOT’s travel demand model, it seems prudent to assume VMT growth would swamp any projected efficiency gains.
A close reading of the environmental analysis shows ADOT hedging its own rosy scenario. The state starts off with a modest hedge, claiming, “Reductions in emissions from improved travel times and reduced congestion for the Build Corridor Alternatives may be partially offset by the increase in VMT.” ADOT further hedges its claims about achieving cleaner air through traffic flow improvements by stating that “there is an overall downward trend in total emissions even as VMT increases due to federal regulations on motor vehicles that have reduced tailpipe emissions.”34 Here, ADOT is essentially admitting that its project is harmful but that a suite of federal vehicle and other environmental regulations may offset its recklessness.
The impacts of I-11 on water resources are also troubling. According to the ADOT environmental analysis, the highway would result in “[i]ncreased impervious surface leading to more runoff, more automotive-based nonpoint source contamination, and less infiltration to groundwater.”35 Building the highways, including bridges and culverts, would result in “permanent change in stream contours or loss of wetlands,” as well as increase “base flood elevation and exacerbate flooding downstream.”36 These projected harms are confined to the proposed interstate facility. ADOT does not estimate the additional harm to water resources that would result from the economic development spurred by the facility over time. The state notes that induced growth would “[c]hange surface waterflow, impacting the quality and quantity of water available for uses including recreation, habitat, drinking, and agricultural uses.”37
This leads to the issue of growth. ADOT is proposing to build I-11 to accommodate projected increases in VMT resulting from population and employment growth principally in Phoenix and Tucson in the coming decades. The problem with VMT projections is that they are predicated on the assumption that the future will look exactly like the past. Unfortunately, this becomes a self-fulfilling model. First, the state department of transportation builds a travel model that assumes future population growth will happen in low-density, auto-dependent communities that generate high levels of VMT. Second, these projections become the basis for increasing public spending on highway construction. Third, local elected officials zone for and developers construct new low-density, auto-dependent communities that take advantage of the new highway facilities. Fourth, total VMT increases in line with the state DOT projections. State transportation departments could break this cycle by building different transportation facilities that spur more compact and sustainable land-use patterns and generate less driving.
The problem with VMT projections is that they are predicated on the assumption that the future will look exactly like the past.
In general, transportation projects shape development patterns because land has value only when it can be accessed. Different transportation facilities provide different kinds of access. Interstate highways support automobility, which is tied to land-use patterns that are much less dense than development patterns facilitated by transit and nonmotorized facilities. ADOT’s analysis shows that I-11 would create high-capacity auto access for undeveloped and underdeveloped land. Moreover, ADOT’s analysis states, “Developable areas within 5 miles of interchanges are assumed to have project-induced growth.”38
This growth will almost certainly mirror the historical development pattern of the Phoenix metro area, which is substantially less dense than other rapidly growing Mountain West regions. For instance, the city of Denver has made aggressive transit investments in recent years, which has contributed to higher population density, lower vehicle ownership rates, and a higher share of commuting trips occurring on public transit. According to data from the U.S. Census Bureau, the city of Denver is 40 percent denser than the city of Phoenix.39 Moreover, metro Phoenix has a population density of 313 people per square mile.40 In comparison, Denver, Arapahoe, Broomfield, and Jefferson counties, which make up the metropolitan core of Denver, have a combined population density of 1,106 people per square mile—a difference of 353 percent.41 The higher population density makes a difference in vehicles available per household and for commuting.42 The share of households in Denver with zero or one vehicle available is higher than in Phoenix.43 Additionally, the share of households with four or more vehicles in Denver is substantially lower than in Phoenix.44 The percentage of commuting trips taken by transit is twice as high in Denver as it is in Phoenix.45
The truth is that I-11 will not remain a pristine bypass located away from the development of Phoenix or Tucson. Instead, commercial and residential developers will seek to leverage the facility by building in close proximity.
A better way to grow
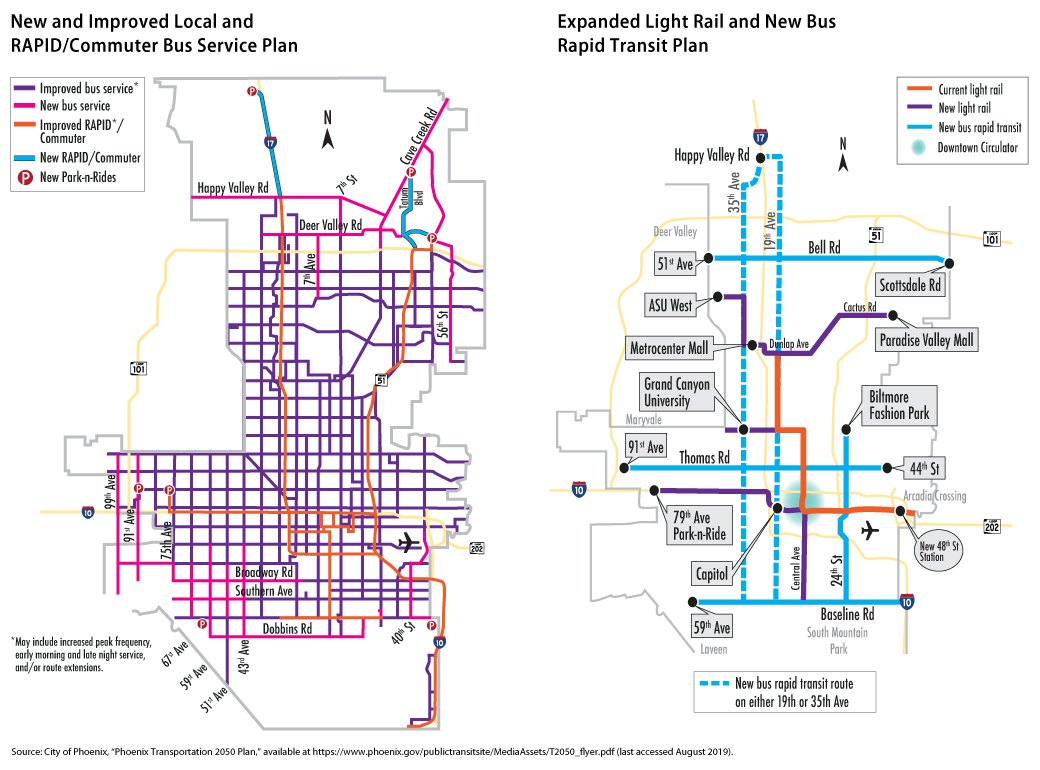
The I-11 proposal is especially vexing because it runs counter to the city of Phoenix’s comprehensive transportation plan known as Transportation 2050.46 In 2000, voters in Phoenix approved a 20-year 0.4 percent sales tax increase to fund the expansion of transit service, including rapid and express bus lines as well as the construction of 24 miles of new light rail. The transit build-out has produced substantial service improvements and ridership gains. For instance, from 2000 to 2017, Phoenix’s transit ridership growth has increased at double the rate of its overall population growth.47
In 2015, Mayor Greg Stanton (D) and other city and civic leaders campaigned for a second major sales tax initiative known as Proposition 104 to generate additional funding to implement the Transportation 2050 plan.48 By a margin of 55 percent to 45 percent, city voters approved increasing the portion of local sales tax dedicated to transportation from 0.4 percent to 0.7 percent and extending the tax through 2050. The estimated $16.7 billion49 raised through Proposition 104 is intended to repave 680 miles of streets; add 135 miles of new sidewalks and 1,080 miles of new bike lanes; nearly triple the light-rail system with 42 new miles of track; and improve bus frequency by 70 percent, among other improvements.50 With the passage of Proposition 104, residents of the city of Phoenix sent a clear message that they want a transportation system that is efficient, sustainable, and accessible.
Unfortunately, Phoenix and Tucson—which passed their own ballot initiatives and sales tax funding for roads and transit in 2006—are on their own, since the state does not support public transportation and nonmotorized facilities.51 For instance, the state of Arizona’s $11.7 billion fiscal year 2020 budget does not include any funding for public transportation.52 Moreover, Article 9, Section 14 of the state constitution prohibits any state gas taxes or related fees from being used for transit: “No moneys derived from fees, excises, or license taxes relating to registration, operation, or use of vehicles … shall be expended for other than highway and street purposes.”53 Transit capital projects undertaken by the Valley Metro Transit System in Phoenix as part of the Transportation 2050 plan will be implemented with local funds and federal grant dollars. It is hard not to imagine the progress Phoenix could achieve with state financial support. Instead, ADOT is preparing to spend billions of dollars to reinforce a development pattern predicated on automobility.
Conclusion
The proposed I-11 project demonstrates the lack of accountability in federal transportation policy. While Congress has established that a fundamental goal of federal policy is to “enhance the performance of the transportation system while protecting and enhancing the natural environment,” there is no mechanism in place to ensure that states select sustainable projects that reduce harmful emissions, protect pristine lands and endangered species, and protect local waters.54
When federal highway money flows on an annual basis, states are able to advance expensive, questionable projects rather than look for solutions that truly advance national policy goals. This lack of accountability allows ADOT to construct I-11, even though the project would fail to advance the multimodal transportation vision that residents of Phoenix endorsed at the ballot box; spur low-density, auto-dependent development that increases single-occupant vehicle trips; and result in significant environmental damage.
Kevin DeGood is the director of Infrastructure Policy at the Center for American Progress.