This column was originally published on MarketWatch.
U.S. economic growth tumbled in the first quarter of 2014, as the gross domestic product, or GDP—the sum total of goods and services produced in the United States—grew at merely 0.1 percent, according to new data released today from the Bureau of Economic Analysis, or BEA.
Although today’s headline GDP disappoints, subsequent revised estimates for the growth figure are likely to show a stronger number, but not one that changes the picture significantly: Nearly five years since the start of the business cycle expansion, the U.S. economy is still struggling to gain traction.

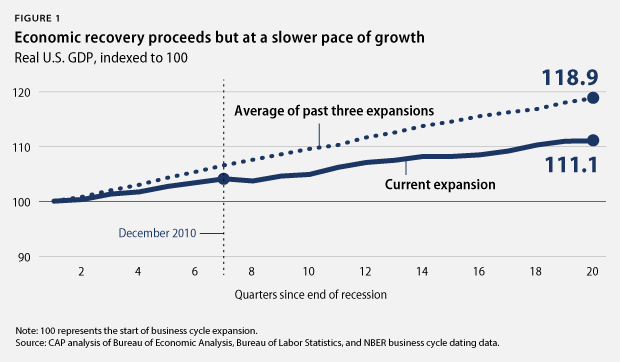
Compared to the prior three U.S. expansions, going back to 1982, the economy is recovering at merely 60 percent of that pace. (see Figure 1) Whereas at this point in past recoveries, the economy expanded by an average of 19 percent, today, the U.S. economy has grown just 11 percent overall since the economy’s June 2009 trough. Of course, two key things are different about the post-Great Recession recovery that sets it apart from recent economic history.
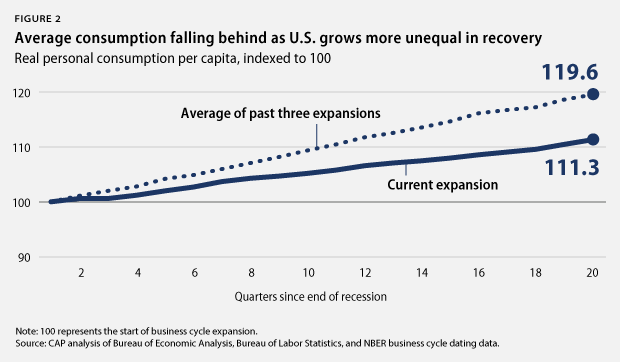
The first key difference is what caused this economic mess in the first place, namely, the depth of the real estate collapse and the wicked hangover of debts left in its wake. The burden of these debts on families—who were already feeling an income squeeze before the recession—has taken a heavy toll on individuals and households’ personal consumption. Personal consumption, which accounts for close to 70 percent of overall GDP, is also expanding off the pace of prior recoveries. (see Figure 2) As families need to save more—to pay off debts and rebuild diminished retirement savings—they will consume at a lower rate.

The income squeeze on consumption, however, is not being felt equally across the country. Separate data, based on IRS tax filings, show that in the recovery from 2009 to 2012—the most recent years for which data are available—average incomes of America’s top 1 percent grew 31 percent, while average incomes of the bottom 90 percent shrank by almost 2 percent. Gains enjoyed by some families are not trickling down to most, holding back the recovery of consumption overall.
Even with this income disparity, consumption grew 3 percent after inflation in the first quarter, contributing 2 percentage points to overall economic growth, according to today’s data. This growth likely reflects the impact of surging housing prices, which were up 12.9 percent across the country in the beginning of 2014, as measured by the Case-Shiller house price index, rather than growth in disposable income, which today’s BEA data show increased less than 0.5 percent in the first quarter. For those individuals with housing wealth, increasing prices enable people to consume more and save less. However, rising real estate prices resulted more from investor demand returning to the housing market and with it the pushing up of prices rather than from stabilization of supply of housing units. Private housing stock data show 2013 beginning with higher housing inventories than in 2012.
With interest rates already rising from last year’s historic lows and poised to creep higher as the Federal Reserve eventually scales down its quantitative easing stimulus, shrinking profit margins will cut into private equity’s appetite for housing investment, as well as pricing more would-be homebuyers out of the market. Thus, wealth-based consumption may not have the legs to propel economic growth going forward.
The second major difference can be seen in the radical departure from past practice of fiscal policy and government spending on investment and consumption, which fell 0.5 percent in the first quarter of 2014, after falling 5.2 percent in the preceding quarter. These figures measure what the government spends on building and delivering public goods and services, not what it spends on transfer payments.
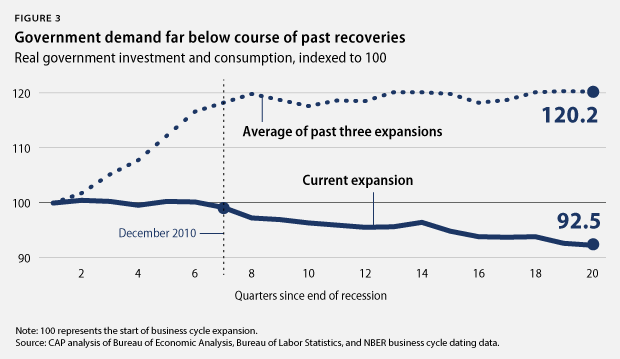
In past expansions, government spending continued supporting economic recovery, rising 20 percent for two years beyond the start of the upswing and leveling out only thereafter. (see Figure 3)

But the fiscal policy response in this recovery was much different. Instead of expanding to support the economic recovery, the January 2009 American Recovery and Reinvestment Act, or ARRA, and related measures served in large part merely to offset the sharp fiscal contractions experienced widely across state and local governments. As one-time spending from the ARRA waned, Republicans won control of the House of Representatives in 2010 and set U.S. fiscal policy on a downhill course. As a result, rather than supporting economic recovery, the public-sector contraction has cut one-third of a percentage point per quarter from the growth rate on average since the start of the expansion.
The rest of today’s GDP report from the BEA shows that investment overall continues to basically keep pace with what has been seen in other recent recoveries, even though investment shrank 6.1 percent overall in the first quarter. Persistent U.S. international trade deficits also continue to pose a drag on the larger U.S. economy, although with fairly stable downward pressure.
Thus the lackluster growth that we are seeing nearly five years since the U.S. economy began expanding can be traced back to two main factors: the ongoing financial stress faced by most American families whose incomes are struggling to keep up with household demands; and the abnormal fiscal austerity that undermined government’s usual contribution to smoothing downturns and laying the foundations for the next round of economic growth—this despite the fact that fiscal deficits will fall back to just 2.8 percent of GDP this year.
Fortunately, these are social and political problems—not fated by economic laws of nature—that could in theory be overcome. But don’t bet next quarter’s GDP on it.
Adam S. Hersh is Senior Economist at the Center for American Progress.