Introduction and summary
The election and presidency of Donald Trump has upended American politics in numerous ways. For his most ardent supporters, President Trump’s efforts to change things in Washington; to deliver nationalist economic policies on trade, jobs, and immigration; and to advance culturally conservative rhetoric and racial appeals are worth the break with past presidential behavior and national unity. For his detractors, the actions of Trump and his administration represent a serious abrogation of presidential norms and mark a dangerous shift away from pluralist democracy and toward more authoritarian nationalism. Many other voters with less intense feelings about Trump are just trying to put the whole spectacle out of their minds and to find some semblance of normalcy in a politically fractured environment.
For those who study public attitudes about government itself, the Trump presidency raises serious questions about whether the United States is experiencing real, long-lasting changes in voters’ attitudes toward government, or if Americans are reacting in intense but more typical ways that are consistent with past trends. To examine these issues in more detail, the Center for American Progress, along with its colleagues at Hart Research Associates, designed a comprehensive national survey to measure basic beliefs about government and specific voter attitudes about the Trump administration. The online survey of 1,500 registered voters nationally was conducted March 19–25, 2018, and has an overall margin of error of +/- 2.6 percent. This study builds upon a major public opinion study that CAP and Hart conducted in 2015, which examined public attitudes about government and explored a variety of proposals for improving the performance and representation of the government in Washington. The results of that research are summarized in the unpublished May 2016 report, “Of the People, By the People, For the People? A National Study of Public Trust and Confidence in Government.”1
Based on the results of the current study and comparisons with earlier responses from the 2015 research and other publicly available data, we believe that reactions to the Trump administration represent a genuine break with past public views of government in significant ways. Most importantly, the partisan divisions on measures of trust and confidence in government found in earlier research are now fully solidified. Many American voters today are not basing their evaluations of government on objective criteria that weigh policy choices and overall performance in a neutral manner. Rather, in-party and out-party voters are reacting in entirely divergent ways to the government itself based primarily upon who is leading the government and which party is in control.
As seen in these data, perceived impact and trust in government has cratered among self-identified Democrats and risen significantly among self-identified Republicans in only three years—from the final term of Barack Obama’s presidency to the first term of Trump’s. Democrats’ belief in the Obama years that government has a very positive impact on health care has shifted to the belief that government has a mostly negative impact. Conversely, Republicans who felt that the government had a very negative impact on the economy under Obama now believe that the government has a very positive impact on the economy under Trump. Although there may be good reasons for partisan voters on both sides to think this way, it is just as likely that trust in government itself and perceptions of its impact have succumbed to the same tribal political forces that define much of contemporary American politics.
Put simply, if voters like Trump and what he is doing, they trust in the government more and see more positive impacts and benefits. If voters dislike Trump and what he is doing, they distrust government more and see many more negative impacts and fewer benefits from government.
Voters, however, are not split entirely along partisan lines in their evaluation of Trump and his administration. Voters across the board express serious concerns with a range of actions that Trump has taken, primarily those centered on his personal behavior and his ongoing flouting of rules, laws, and regulations that were designed to prevent corruption and abuses of power. Majorities of voters overall in this study say they have less confidence in government itself under Trump and believe that the performance of government has gotten worse during his tenure.
Issues of corruption in government and the role of special interest influence remain powerful unifying forces across divergent groups of American voters. Overwhelming majorities of voters express concern about the role of money in politics and the perceived self-dealing and unethical behavior of politicians on the receiving end of campaign contributions. Consequently, voters strongly support a range of concrete steps to end corruption in government, including more transparency of how policymakers benefit from legislation, much tighter campaign finance laws, and even an outright ban on campaign contributions from lobbyists.
Despite deep concerns about Trump and government overall, this study also finds encouraging sentiments among voters. For example, voters overall desire a more active role for government in solving pressing economic and social problems facing the country, rather than a less active role. Likewise, a strong majority of voters believe that the government itself can be better managed, and they reject the position that government is bound to be ineffective no matter what.
This report first examines the dimensions of trust and confidence in government overall.2 It then explores voter attitudes toward the Trump administration, as well as the support and opposition for specific policies designed to help improve government.
Partisanship sharply shapes trust in government
This study explores the basic issue of trust in government from multiple angles, using both traditional questions and newer ones to better understand the dimensions of trust. In all three measures employed here, the results are the same: Although trust in government remains quite low overall, trust has increased slightly since 2015 due to a significant increase in trust among self-identified Republicans.
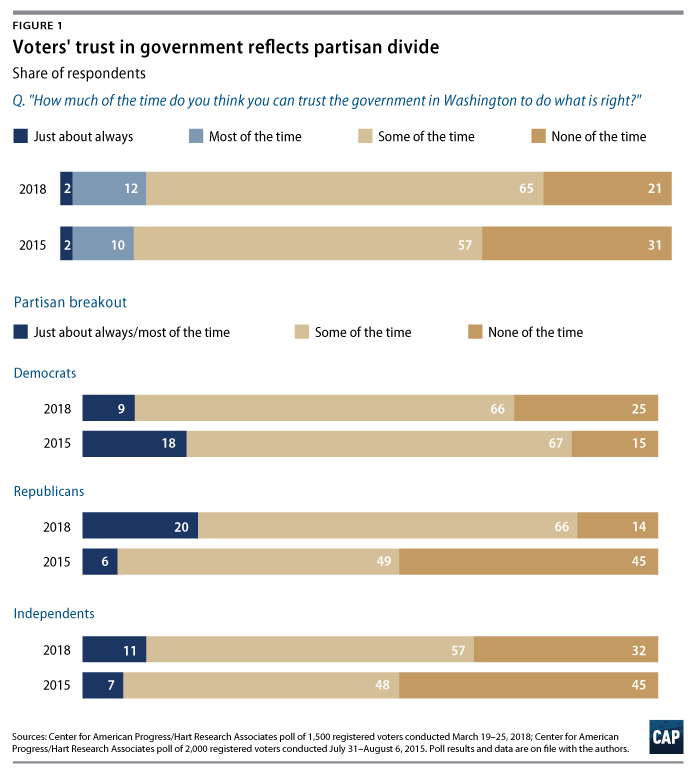
As Figure 1 shows, less than one-fifth, or 14 percent, of American voters overall say they trust the government in Washington to do what is right “just about always” or “most of the time,” compared with the 65 percent who trust the government only “some of the time” and 21 percent who trust it “none of the time.” The percentages of voters saying they trust the government “some of the time” and “most of the time” are up 8 percentage points and 2 percentage points from 2015, respectively, while the percentage saying they trust the government “none of the time” has dropped 10 percentage points over the same period.
Looking at the partisan trends, 20 percent of self-identified Republicans in 2018 say they trust the government in Washington “just about always” or “most of the time,” compared with a scant 6 percent of Republicans who felt similarly in 2015. Two-thirds of self-identified Republicans trust the government “some of the time,” and 14 percent trust it “none of the time.” In 2015, by comparison, nearly half of all Republicans, or 45 percent, said they trusted the government in Washington to do what is right “none of the time”—31 percentage points more negative in the Obama years than in the Trump years. White noncollege-educated men show the largest shift on this measure, with the percentage of this group trusting the government in Washington “none of the time” dropping from 45 percent in 2015 under Obama to 23 percent in 2018 under Trump.
The 2015 study introduced a new measure of trust in government to get a more precise read on views compared with those typically reported in public polling, asking people, “On a scale from 0 percent to 100 percent, what percent of the time do you think you can trust the federal government?” In 2015, the mean trust score among all voters was 34.8 percent, with two-thirds of voters reporting trust in government in the 0 percent to 49 percent range, or less than half the time. Mean trust in government increased to 38.1 percent overall in the 2018 study, with a slightly smaller proportion of voters—63 percent—trusting government in the 0 percent to 49 percent range.
Partisan shifts on this new test of trust in government are notable. Among self-identified Democrats, mean trust in government declined substantially from 48.5 percent in the 2015 survey to 36.3 percent in the 2018 study. The pattern is completely inverted among self-identified Republicans: Mean trust among Republicans increased from 22.3 percent in 2015 to 41.1 percent in 2018.
The third measure employed to examine trust in government assesses voters’ favorable or unfavorable views of the federal government. Asked, “What is your overall opinion of the federal government?” 39 percent of voters overall report a “very favorable” or “mostly favorable” view of government, with 61 percent expressing a “mostly unfavorable” or “very unfavorable” view.
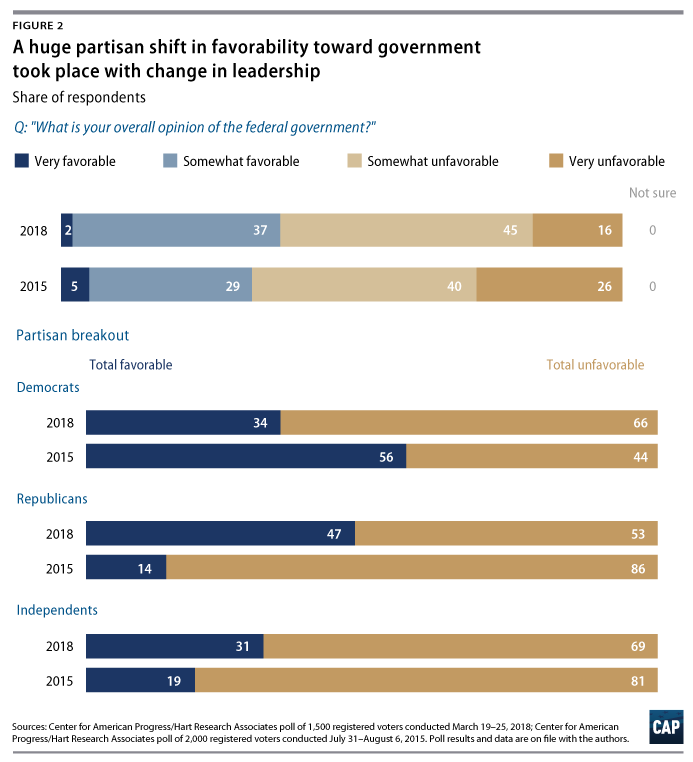
Partisan shifts from 2015 are even more pronounced when examining this government favorability measure. As seen in Figure 2, self-identified Democrats in 2015 held a more favorable than unfavorable view of the federal government by a 56 percent-to-44 percent margin—a +12 percent net margin. In 2018, the numbers are completely reversed, with 34 percent of Democrats holding a favorable view of the federal government and 66 percent holding an unfavorable view—a -32 percent net margin and a 44-point net shift in favorability over a three-year period. In contrast, self-identified Republicans moved from a 14 percent-to-86 percent favorable-to-unfavorable margin in 2015 to a 47 percent-to-53 percent margin in 2018—a huge 78-point net shift in favorability over the same period.
Looking at other demographics, white noncollege-educated women showed significant improvements in their views of the federal government, moving from a 29 percent favorable-to-71 percent unfavorable margin in 2015 to a 41 percent-to-59 percent margin in 2018. In contrast, African Americans shifted sharply in the other direction, moving from a 64 percent favorable-to-36 percent unfavorable margin in 2015 to a 41 percent-to-59 percent margin three years later.
Is this increased trust among Republican voters a result of the government taking positive actions or government performance improving in the eyes of these voters? Partially, but it is also likely that measures of trust in government no longer represent entirely objective or neutral evaluations of the government itself, and instead reflect people’s views about who is in charge of government. The shift in control of the presidency from Democrat Barack Obama to unified Republican control of government under President Trump has clearly influenced partisan views of government, with Republicans generally feeling more trusting and Democrats feeling less trusting.
This may seem like an anodyne observation, but if these trends continue in the future, it raises serious questions about whether Americans as a collective body are capable of forging consensus views about government and its actions independent of the partisan control of government.
Looking at other measures, the study finds interesting shifts in perceptions about what the government represents to people. Asked, “When you think and talk about government, do you tend to think of it more as ‘the government’ or more as ‘our government’?” more than 7 in 10 voters—71 percent—say that they think of it as “the government.” Less than 3 in 10 voters—29 percent—view it as “our government.” Views of the government as a mostly distant entity rather than a more democratic embodiment of the people have increased sharply over the past two decades. In 1999, for example, only 55 percent of people described it as “the government” rather than “our government.”3
In the current study, Republicans express slightly more affinity with the current government than do other voters. Two-thirds of Republicans describe thinking of it as “the government” rather than “our government,” compared with 77 percent of self-identified independents and 74 percent of self-identified Democrats.
Fortunately for those who believe in good government, there is evidence that public trust is higher among voters who conceive of the government more in terms of the policies and programs it produces than in terms of the politics and political leaders who inhabit the government.
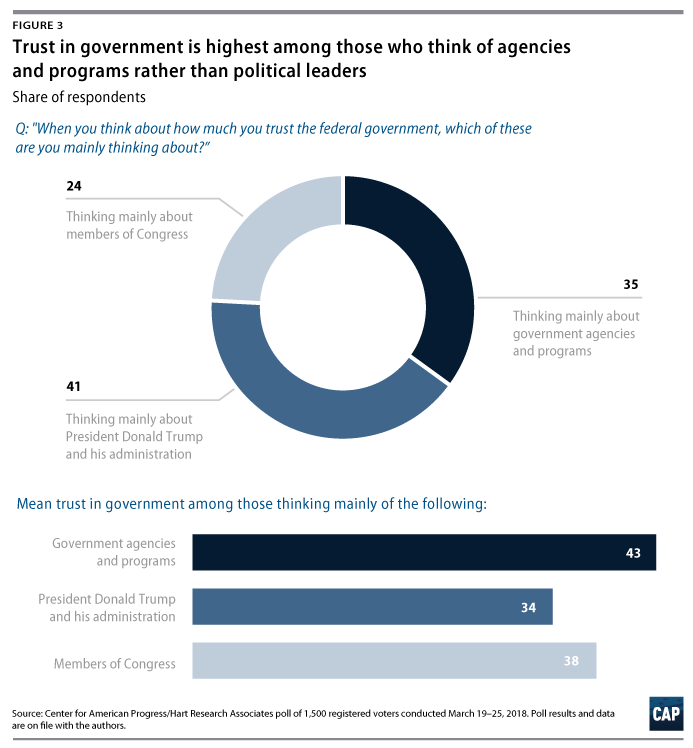
As seen in Figure 3, when asked what they are mainly thinking when considering their trust in government, a plurality of voters overall say they are “thinking mainly about Donald Trump and his administration”; 35 percent say they are “thinking mainly about members of Congress”; and 24 percent say they are “thinking mainly about government agencies and programs.” Although the percentage of those viewing government as agencies and programs is the lowest overall, trust in government among these voters is highest: Mean trust among voters who think of government mainly as agencies and programs is 43 percent, compared with 38 percent among those who view government mainly as members of Congress, and 34 percent among those who view it mainly as President Trump and his administration. Although we do not know the exact reasons for the higher levels of trust among this group, we do know that politicians overall receive highly negative ratings, while certain programs and institutions of government—including Social Security and Medicare or the military and agencies such as the National Park Service and Centers for Disease Control and Prevention—score much higher with voters, most likely explaining the differences.4
Perception of government impact is more positive than measures of trust but remains low on many issues
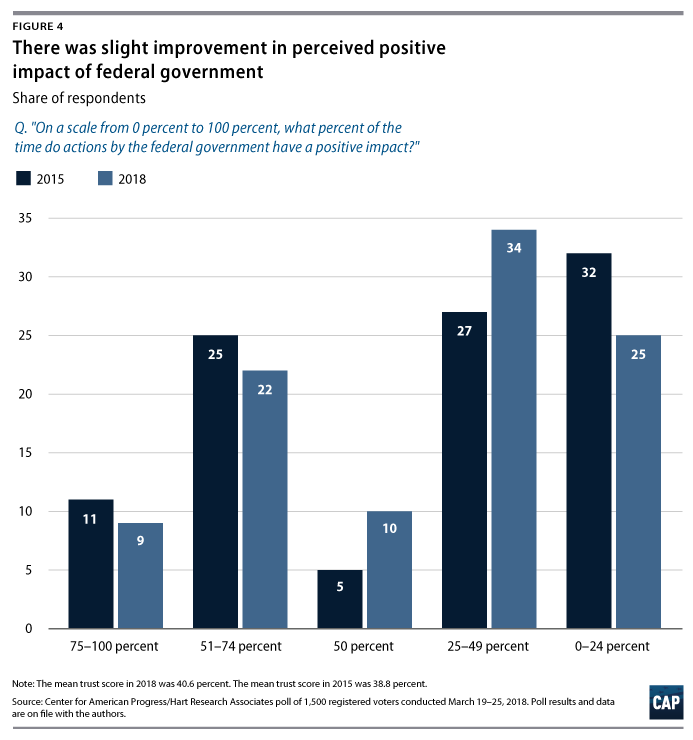
On questions about the perceived impact of government, voters express slightly more positive views overall than they do on measures of trust. Employing a similar sliding-scale measure to the one described earlier—“On a scale of 0 percent to 100 percent, what percent of the time do you think actions by the federal government have a positive impact?”—voters overall report a mean score of 40.6 percent in terms of the perceived positive impact of government. This is about 2 percentage points higher than the 2015 mean trust in government rating and 2 percentage points higher than the perceived positive impact from the 2015 study.
Trust in government and perceived positive impact are clearly correlated: Among those who trust government in the 50 percent-to-100 percent range, the mean score on positive impact is 60.8 percent; among those who trust government in the 0 percent-to-49 percent range, the mean score on positive impact is a meager 11.7 percent.
The partisan trends seen on trust, with Republicans recording higher trust than Democrats under the Trump administration, hold up on the measure of perceived impact as well. Self-identified independents report the lowest mean score on the positive impact measure at 35.6 percent, with self-identified Democrats recording a mean of 38.8 percent and self-identified Republicans having the highest mean at 43.6 percent.
Examining public views of the impact of the federal government on specific issues, interesting differences emerge, with the government doing relatively better in voters’ eyes on issues such as national security and border security and much worse in areas such as the environment and race relations. The survey asked respondents to “indicate whether [they] think the federal government has a positive impact, a negative impact, or not much impact either way” on a range of issues. As highlighted in Figure 5, perceived positive impact of government exceeds perceived negative impact in only three issue areas among voters overall: national security, U.S. border protection, and the economy. On other important issues such as health care, education, and the environment, barely one-fifth of American voters feel that the federal government is having a positive impact.
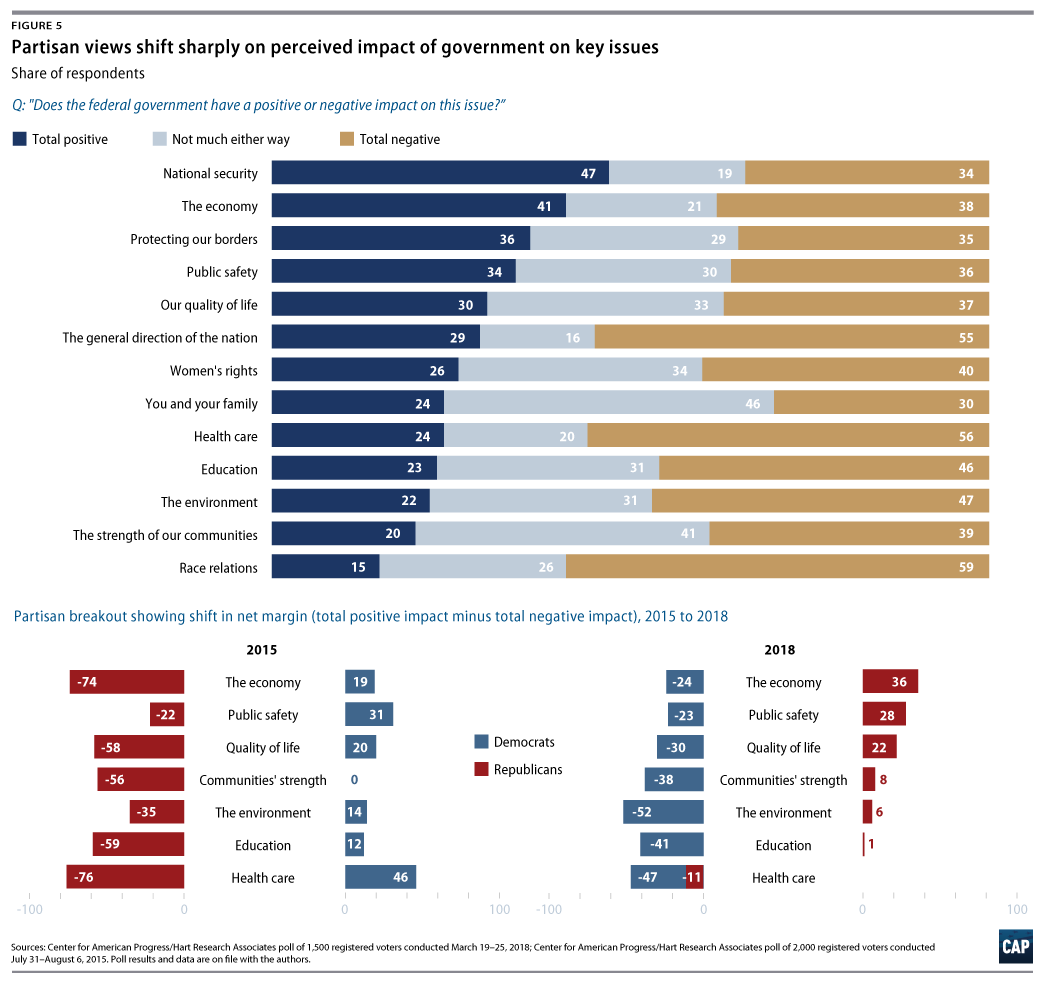
The partisan divisions and shifts on the measure of issue impact are staggering, underscoring the extent to which party control and leadership of the federal government shapes individual views about government’s impact. Among self-identified Democrats, for example, net positive views of impact on health care—meaning positive impact minus negative impact—moved from +46 percent in 2015 to -47 percent in 2018—a 93-point net shift in three years. Conversely, among self-identified Republicans, net positive views of impact on the economy shifted from -74 percent in 2015 to +36 percent in 2018—a huge 110-point net shift from the Obama years to the Trump years. Although these views about the impact of government certainly reflect real evaluations of government performance in these areas by partisan voters, it is hard to view these shifts as neutral evaluations of actual performance of government rather than partisan accolades or criticisms for the actions of specific leaders. Again, these findings suggest how difficult it may be for future political leaders and parties to take steps that will receive widespread approval or disapproval based on the actions themselves rather than which leader or party took them.
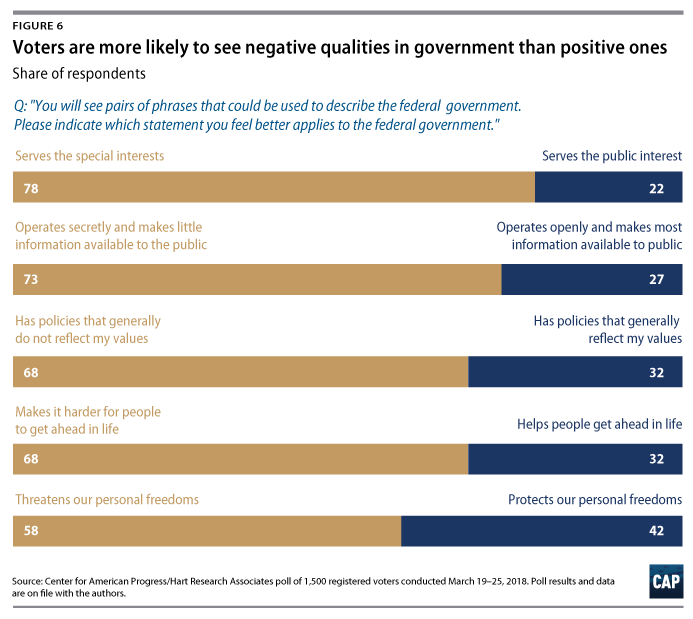
At a values level, voters generally hold negative views about the role of the federal government in modern life. The study presented five separate pairs of phrases and asked voters which phrase comes closer to their own view about the government. As seen in Figure 6, majorities of voters choose the negative view of government over the positive one in each of the five cases. Fifty-eight percent of voters believe that government “threatens our personal freedoms,” while 42 percent believe that it “protects our personal freedoms.” Sixty-eight percent of voters say government “has policies that generally do not reflect [their] values,” compared with 32 percent who feel that government policies do reflect their values.
Voters are nearly uniform in their belief that the federal government “serves the special interests”—at 78 percent—rather than “serves the public interest”—at 22 percent. Likewise, 73 percent of voters feel that the government “operates secretly and makes little information available to the public,” with only 27 percent feeling that the government “operates openly and makes most information available to the public.” Interestingly, and continuing the partisan divides seen throughout the study, self-identified Democrats report higher percentages of negative sentiments about the government than do self-identified Republicans, though both are mostly negative in their evaluations.
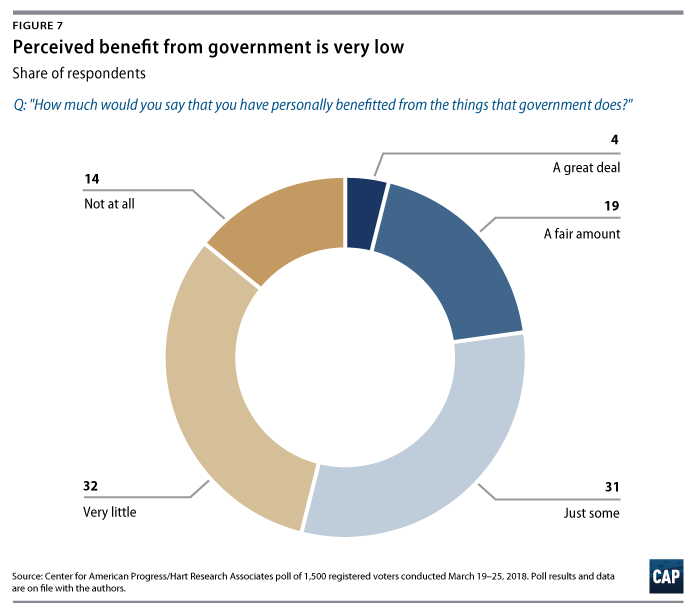
The perceived lack of tangible benefits from government is a major reason why voters feel so negatively toward the federal government. Asked, “How much would you say that you have personally benefitted from the things that government does?” less than one-quarter, or 23 percent, of voters say that they benefit either “a great deal” or “a fair amount” from government actions, with around 3 in 10 voters saying that they derive “just some” benefit from government. Forty-six percent of voters say they benefit “very little” or “not at all” from what the government does.
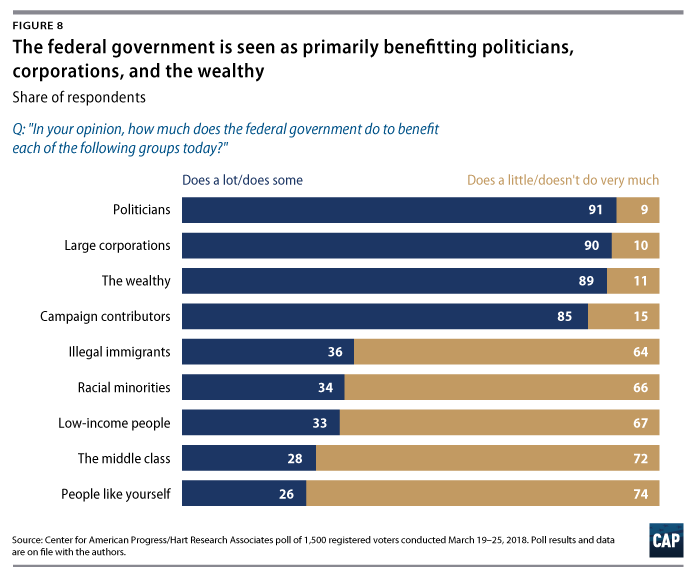
Who does benefit from government policies and actions? As Figure 8 shows, voters overwhelmingly believe that “politicians,” “large corporations,” “the wealthy,” and “campaign contributors” benefit a great deal from the government, while “low-income people,” “the middle class,” and “people like yourself” get little to no benefit. The verdict on the political class and the wealthy benefiting from government is almost unanimous, with anywhere from 85 percent to 91 percent of voters overall saying the government does “a lot” or “some” to benefit these groups, with the emphasis much more on the former.
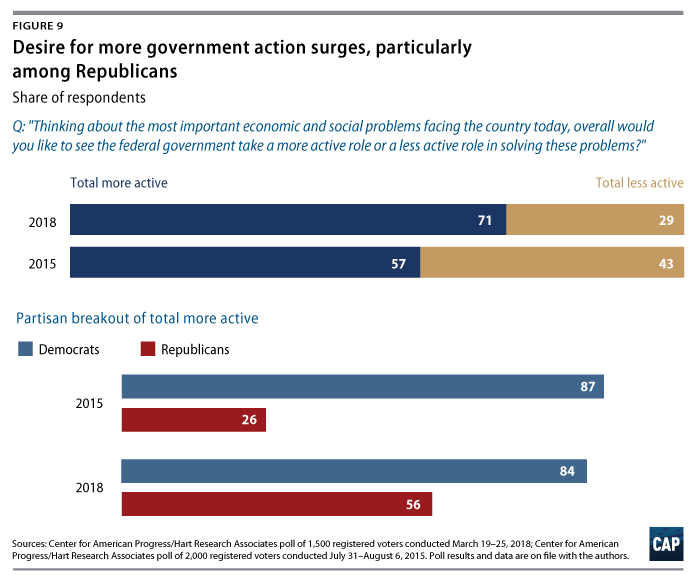
Despite these negative views about how the government operates and whom it benefits, voters have not lost all faith in it. In fact, they express a desire for it to do much more to take on the country’s biggest challenges. A full 71 percent of voters overall say they would like to see the federal government take either a “much more active role” or a “somewhat more active role” in solving the most important economic and social problems facing the country. This is compared with just 29 percent of voters who would rather see it take a less active role. The desire for a more active government has surged 14 points since 2015, primarily driven by a 30-point increase in the desire for more government action from self-identified Republicans—from 26 percent in 2015 to 56 percent in 2018. Self-identified Democrats express the greatest desire for more government action on pressing problems at 84 percent, with majorities of both self-identified independents, at 65 percent, and Republicans, at 56 percent, sharing this desire.
Also encouraging for defenders of the public sector, voters overall are in broad agreement that the federal government is not destined to be a mismanaged, low-performing institution. Seventy-five percent of voters believe that the government “could be more effective if it were better managed,” compared with just 16 percent who feel it is “bound to be ineffective no matter what.” Although voters express serious concerns and doubts about some of the current actions of the government and whom it is primarily serving, they are not fatalistic about the ability of citizens and their government to fix these matters.
President Trump is having a corrosive effect on public confidence in government
As seen throughout this report, Republicans are generally reacting in more positive ways to the federal government than are Democrats with the change of leadership from Obama to Trump. However, the public’s verdict on the Trump administration to date is far from positive. Many of his actions and decisions are causing deep concerns among voters across the spectrum.
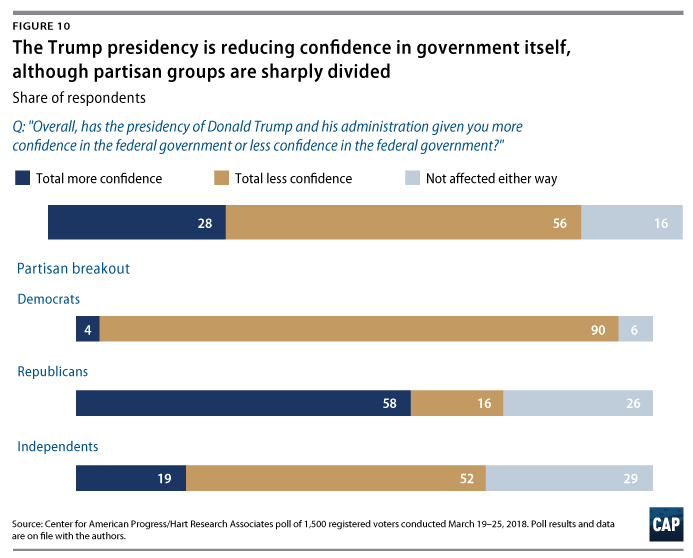
The survey asked respondents, “Overall, has the presidency of Donald Trump and his administration given you more confidence in the federal government or less confidence in the federal government?” By a 56 percent-to-28 percent margin, voters overall say that the Trump presidency has given them less confidence in government rather than more confidence, with 16 percent saying his presidency hasn’t affected their confidence in government either way. Not surprisingly, partisan views on the Trump presidency are deeply divided: 90 percent of self-identified Democrats say the Trump presidency has given them less confidence in the federal government, while 58 percent of self-identified Republicans say it has given them more confidence in government. (see Figure 10)
To better understand the dynamics of people’s confidence in government or lack thereof under President Trump, we asked respective respondents to express in their own words why they feel the way they do about Trump and his administration. Among the 28 percent of voters who say the Trump presidency has given them more confidence in government, responses are fairly straightforward. Thirty percent of those voters describe Trump and his administration as “doing a good job,” “getting things done,” or “on the right track.” Another 24 percent of these voters express agreement with Trump’s views on the economy or on a range of issues. Eighteen percent of these voters say that Trump “is keeping his promises,” “working for us,” or “working for the American people.”
On the other side, the 56 percent of voters who say that the Trump presidency has given them less confidence in government offer a range of negative assessments based on the president’s character and direct actions. Twenty-three percent of these voters report that Trump is “incapable of doing the job”; “doing a poor job”; or is “inept,” “ignorant,” and “unprepared.” Another 18 percent say that Trump is a “liar,” that he is “not honest,” or that they “can’t believe anything he says.” An additional 10 percent cite the numerous “people being fired” or “resigning” from his administration or mention that his administration is constantly “under investigation” and represents a “revolving door.” Other terms and phrases that these voters employ include: “acts like a child”; “an embarrassment”; “egotistical”; “selfish”; “looks out for his own interests”; “dangerous”; and “out of control.”
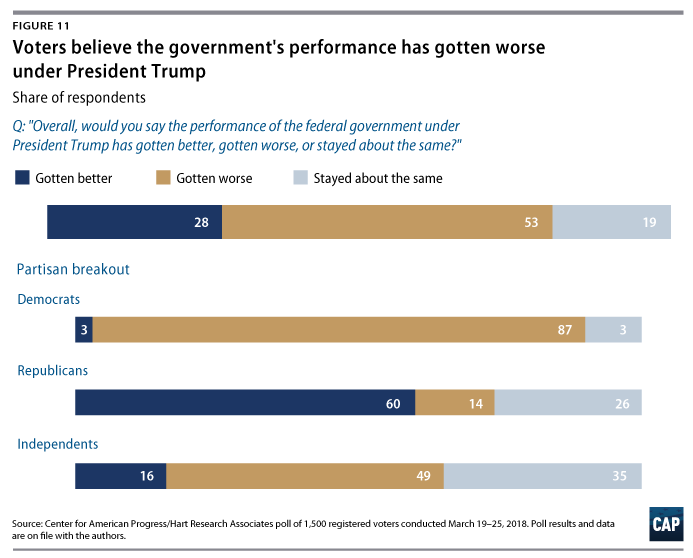
Perceptions of Trump’s management of government are also predominantly negative. Asked, “Overall, would you say the performance of the federal government under President Trump has gotten better, gotten worse, or stayed about the same?” 53 percent of voters say that it has gotten worse, and 28 percent say that it has gotten better, with 19 percent saying that it has stayed about the same. As with the confidence measure, partisan views of government performance under Trump split dramatically: 87 percent of self-identified Democrats believe government performance has gotten worse under Trump, while 60 percent of self-identified Republicans believe it has gotten better. Likewise, a plurality of self-identified independents says that government performance has gotten worse in the Trump years—49 percent reporting it has worsened versus 16 percent reporting it has improved.
On more specific evaluations of Trump’s stewardship of government, voters give him relatively more credit on certain issues central to his campaign platform but offer mostly negative evaluations on a range of other issues. The study presented voters with a list of goals people might have for the government and asked them to assess whether the Trump administration was making government perform better or worse on each goal. As seen in Figure 12, pluralities of voters overall say the Trump administration is making things better in terms of “creating jobs and strengthening the economy,” at 43 percent; “reducing illegal immigration,” at 43 percent; and “strengthening national defense,” at 42 percent. Republicans are very positive about the Trump administration’s impact on government performance in these three areas, while independents are more positive than negative. Democrats are less negative on this goal than they are on every other goal tested.
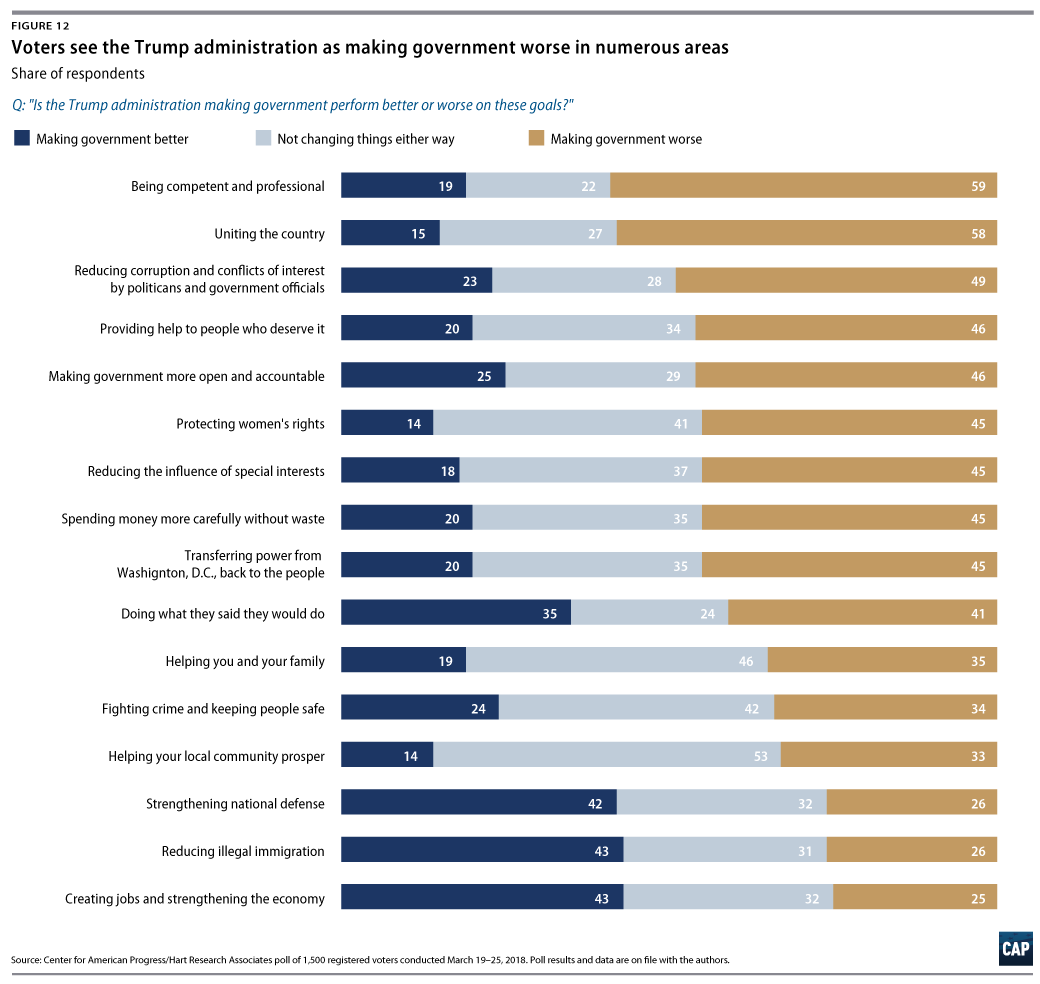
In contrast, pluralities of voters overall say the Trump administration is making government performance worse on the goals of “protecting women’s rights,” at 45 percent; “making government more open and accountable,” at 46 percent; “providing help to people who deserve it,” at 46 percent; and “reducing corruption and conflicts of interest,” at 49 percent. Majorities of American voters feel that the Trump administration is making things worse on the goals of “uniting the country” and “being competent and professional,” at 58 percent and 59 percent, respectively.
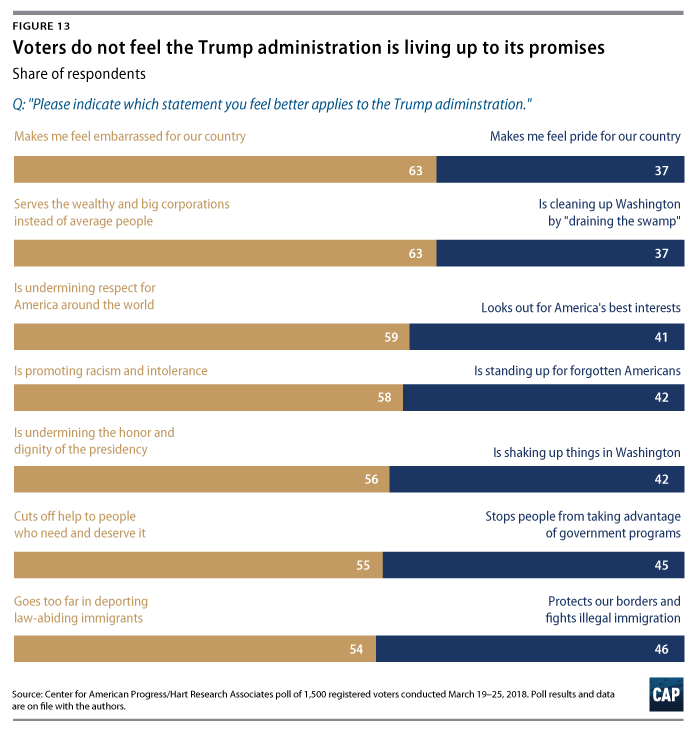
Compounding these views, majorities of American voters hold negative views of the Trump administration in all seven items tested in a series of statement choices. At the top of the list, 63 percent of voters say that the Trump administration “makes [them] feel embarrassed for our country,” versus 37 percent who say that the administration “makes [them] feel pride for our country.” Fifty-nine percent of voters say Trump “is undermining respect for America around the world,” versus 41 percent who think he “looks out for America’s best interests.” Fifty-eight percent say the Trump administration “is promoting racism and intolerance,” compared with 42 percent who believe Trump “is standing up for forgotten Americans.” On the issue of money in politics, 63 percent of voters say Trump “serves the wealthy and big corporations instead of average people,” versus 37 percent who believe that he “is cleaning up Washington by ‘draining the swamp.’” (see Figure 13)
As expected, self-identified Republicans choose the more positive description presented by wide margins, while self-identified Democrats choose the more negative one by similarly wide margins. Self-identified independents fall on the more negative side of nearly all of these statements, with more positive ratings for Trump on immigration and shaking things up in Washington.
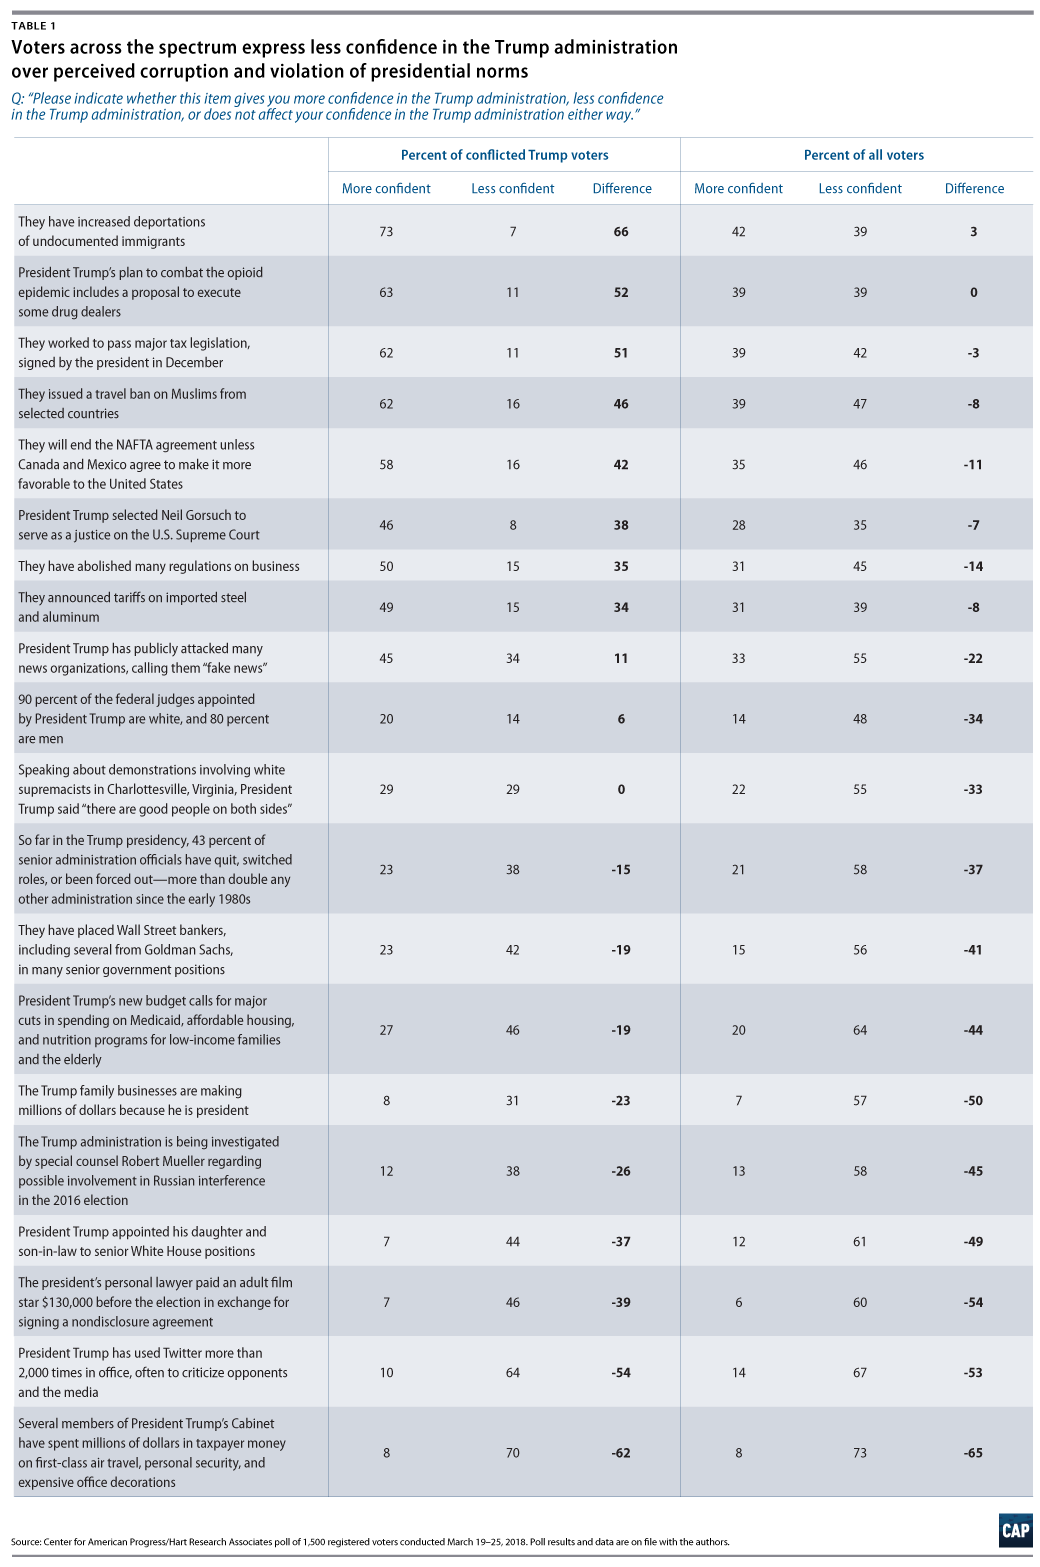
Beyond these basic tests of values and goals for government under Trump, the survey presented respondents with 20 specific actions or decisions that the president and his administration made since taking office and asked whether they give them more, less, or the same level of confidence in the Trump administration.
As seen in Table 1, on 19 of the 20 items presented, voters overall report less confidence in the Trump administration rather than more confidence.
To isolate which of these actions and decisions matter most across a range of Democratic, Republican, and independent voters, one column in the table shows the opinions of “conflicted Trump voters”—the 43 percent of Trump voters who report “having mixed feelings about voting for Trump.” Comparing the results of this group with voters overall—who are mostly negative across the board—there is tremendous variation in reactions to the president’s actions.
Although voters overall report having less confidence rather than more confidence on nearly every action tested, Trump’s steps on immigration, the travel ban, trade, tariffs, the Supreme Court, taxes, and regulation produce large double-digit advantages in confidence among the subset of conflicted Trump voters. Less confidence starts to outpace more confidence among conflicted Trump voters on matters related to the turnover of people in his administration, the Wall Street connections of many of his advisers, and his proposed budget cuts to Medicaid and other social safety net programs.
Opinions turn noticeably negative among these conflicted Trump voters on issues related to his personal behavior and possible illegal actions and corruption. By large double-digit negative margins, conflicted Trump voters express less confidence in the president on matters such as special counsel Robert Mueller’s investigation into the Trump campaign’s possible involvement with Russian interference in the 2016 presidential election; Trump businesses making millions because he is president; the appointment of Trump’s daughter and son-in-law to senior White House positions; and the $130,000 payment his lawyer made to adult film actress Stormy Daniels.5
The two actions with the largest negative gap in confidence among these conflicted Trump voters involve the president’s use of Twitter to criticize opponents and the media as well as the various emerging scandals among Cabinet members—including Environmental Protection Agency Administrator Scott Pruitt, Interior Secretary Ryan Zinke, and Housing and Urban Development Secretary Ben Carson, who have been in the news recently for alleged malfeasance.6
In sum, therefore, the president retains support among conflicted voters on many of his nationalist economic and cultural positions that defined the 2016 presidential campaign—including those related to the economy, trade, and immigration. When comparing results across conflicted Trump voters and voters overall, however, there is clear consensus that the president’s personal behavior and the perceived corruption and illegality of his administration cause a great deal of concern and lead to less confidence in Trump and his administration across the board.
Voters desire strong action to address government corruption and money in politics
Given significant voter concerns about the Trump administration’s potential conflicts of interest, misuse of taxpayer money, and policies that favor the wealthy and corporations, it makes sense that voters’ greatest concerns about government are centered on issues of corruption, political self-dealing, and the outsized influence of special interests in policymaking.
Survey respondents were asked to assess a series of potential concerns about the federal government using a 0-to-10 scale, with 0 meaning it “does not concern you at all” and 10 meaning it “concerns you a great deal.” As seen in Figure 14, three of the top concerns—those receiving either a 9 or 10 ranking—involve political corruption and the undue influence of special interests. Fifty-nine percent of voters are concerned a great deal that “there is too much government corruption and [that] many politicians are corrupt”; 57 percent express a great deal of concern that “government too often benefits the bureaucrats and politicians instead of the people”; and 56 percent are concerned a great deal that “government often looks out for the wealthy special interests instead of average people.”
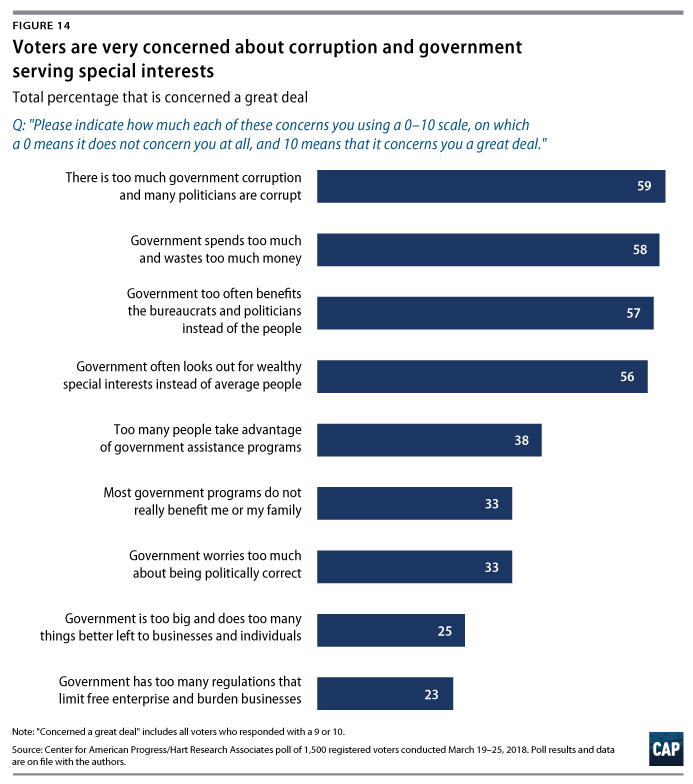
A majority of voters—58 percent—also register a great deal of concern that “government spends too much and wastes too much money,” but other, more traditional criticisms of government do not emerge as great concerns. For example, only 25 percent of voters express a great deal of concern that “government is too big and does too many things better left to businesses and individuals,” and only 23 percent report a great deal of concern that “government has too many regulations that limit free enterprise and burden businesses.”
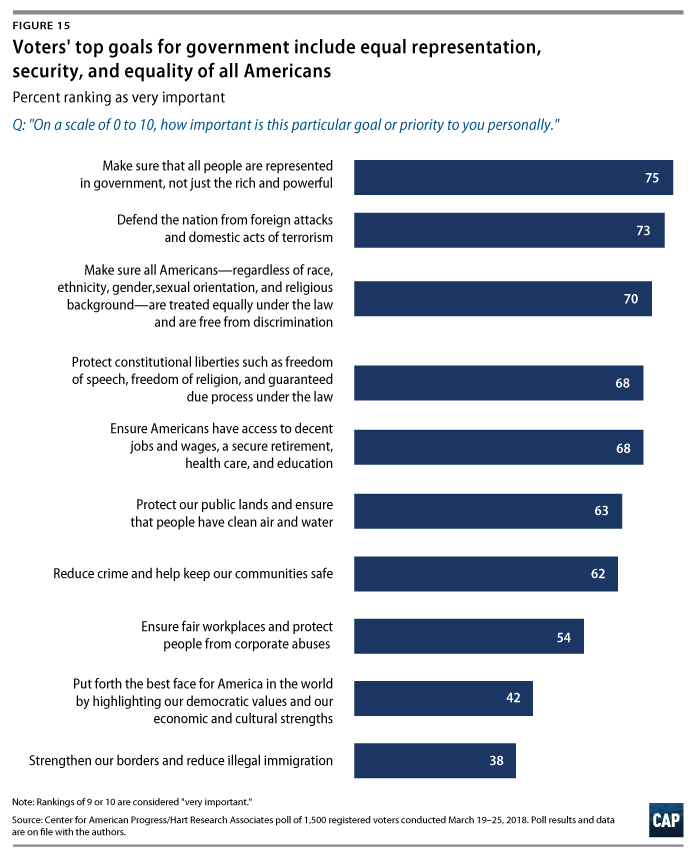
On the flip side, the survey asked people to rank a series of affirmative goals for government in terms of how important each goal is to them personally using a 0-to-10 scale, with 0 meaning that goal is “not important at all to you,” and 10 meaning that goal is “very important to you.” At the top of the list, and consistent with voters’ stated concerns around corruption and whom the government serves, is the goal that government should “make sure that all people are represented in government, not just the rich and powerful.” Seventy-five percent of voters rate this goal a 9 or 10 in terms of personal importance. This concern about balancing the representation of regular voters and powerful interests scores as high or higher than other core goals for government, such as the government’s duty to “defend the nation from foreign attacks and domestic acts of terrorism” and to “protect constitutional liberties such as freedom of speech, freedom of religion, and guaranteed due process under law,” which 73 percent and 68 percent of voters rank as very important, respectively.
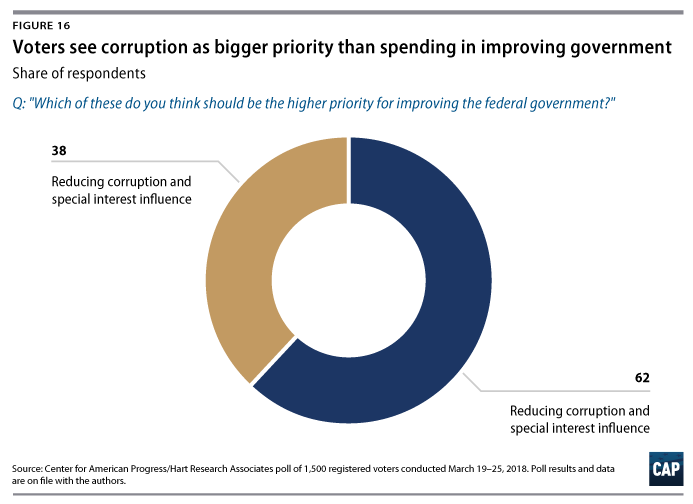
To further highlight the importance of government integrity in voters’ minds, the study asked people specifically whether “reducing corruption and special interest influence” or “reducing wasteful spending and inefficiency” should be the higher priority for improving government. By a 62 percent-to-38 percent margin, voters choose reducing corruption over reducing spending as their preferred priority for fixing government. In a follow-up question asked of those who chose reducing corruption as the higher priority, voters cite concerns that “there is no punishment for corrupt politicians,” that “special interest groups pay politicians to do their agenda,” or that there is “too much lying and deception.”
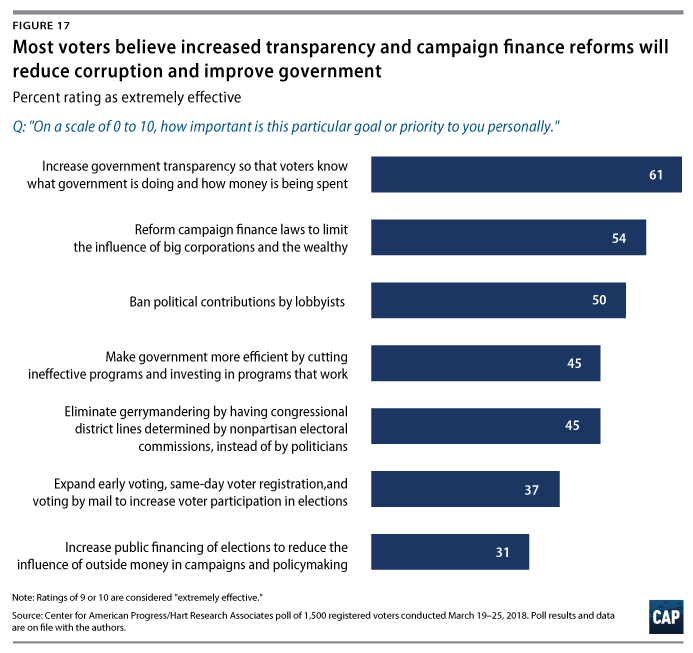
What do voters think will actually address the issue of corruption and improve government overall? As Table 3 highlights, concrete steps related to increasing transparency, reforming campaign laws, and even banning political contributions from lobbyists are all seen as “extremely effective” actions that could be taken according to voters overall. These steps score higher in terms of perceived effectiveness than other, more traditional proposals for improving government, such as cutting ineffective programs or increasing voter participation in elections. This underscores how cynical voters have become on issues of corruption and influence, and how ready they are for serious yet practical steps to break these forces that are degrading government and democracy.
Finally, the study measured voter reactions to a series of potential positions that a candidate for Congress might take or personal qualities they might possess, and asked whether each one would make voters more, less, or equally likely to support this candidate. This study finds clear evidence that candidates who take specific steps to ensure their own integrity and accountability will be eminently more appealing to voters than any status quo politician.
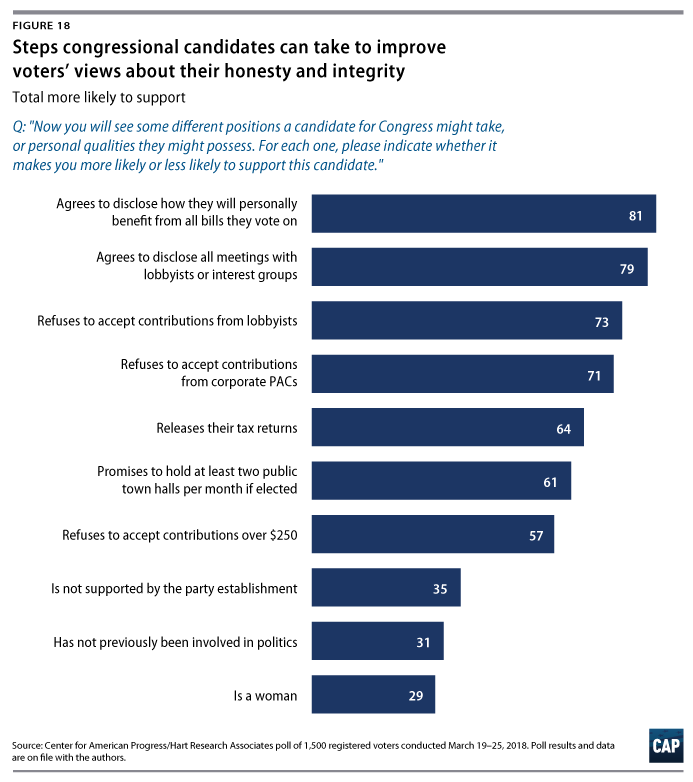
For example, 81 percent of voters overall say they are more likely to vote for a candidate who “discloses how they will personally benefit from all bills they vote on”; 79 percent of voters are more likely to support a candidate who “discloses all meetings with lobbyists or interest groups”; 73 percent are more likely to support a candidate who “refuses to accept contributions from lobbyists”; and 71 percent are more likely to back a candidate who “refuses to accept contributions from corporate PACs.”
Majorities of voters are also more likely to vote for a candidate who “promises to hold at least two public town halls per month if elected” or if they refuse “to accept contributions over $250.” Personal attributes such as being a political outsider or not being supported by the party establishment generate less intensity in terms of voters’ being more likely to vote for a candidate, with voters mainly saying that these attributes don’t make a difference either way.
Conclusion
As seen throughout this report, Americans are deeply divided along partisan lines in their evaluation of the Trump administration and their subsequent trust and confidence in government itself. At the same time, voters express consensus criticism of the president and his administration for their personal behavior and their numerous violations of public rules and standards set up to prevent abuses of power and corruption by public officials.
So what should proponents of reform do in the future to ensure that government serves the public interest?
At an individual level, candidates for office will need to show voters that they are personally and politically the opposite of Trump’s profile—that they are decent, stable, and rational people who are not corrupted by money and who do not violate the rules and norms of U.S. democracy. At a structural level, those who want to improve public confidence in government—and restore the belief that government can help people and serve the common good—will need to devise and fight for a serious set of policies to end the unsavory link between money and politics. This will require pro-government forces to take seriously the need for an anti-corruption agenda; electoral reforms that restore the balance between corporate money and democracy; and much bolder steps to repair public trust in government in order to complement longstanding political commitments on health care, education, and other public benefits.
The evidence presented in this study suggests that voters across the spectrum will react positively to such steps and will view these policies as effective means for improving the purpose and functioning of the federal government.
About the authors
John Halpin and Ruy Teixeira are senior fellows at the Center for American Progress and are the co-directors of the Progressive Studies Program at CAP.
Navin Nayak is the executive director of the Center for American Progress Action Fund.
Geoff Garin is the president of Hart Research Associates and Guy Molyneux is a partner at Hart.
Acknowledgments
The authors would like to thank Emily Haynes, Meghan Miller, Shanée Simhoni, Tricia Woodcome, Erin Whalen, Bill Rapp, and Chester Hawkins for their excellent editorial and graphic design work on this report.