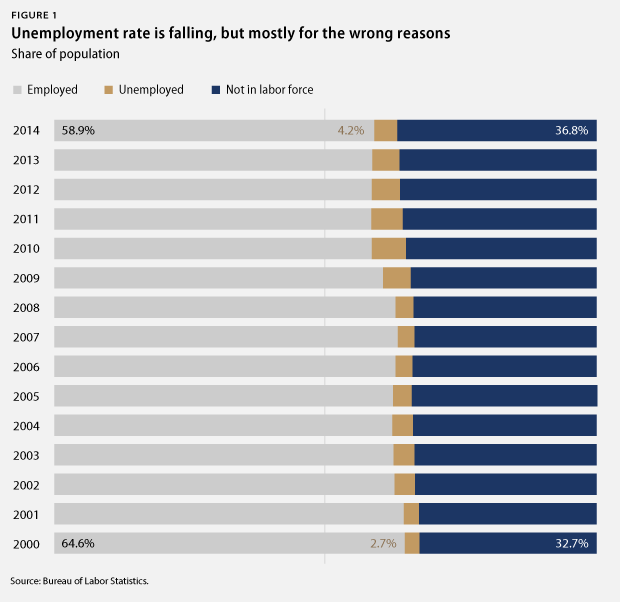
Since the end of the Great Recession, the economy has added 8.3 million jobs, and the unemployment rate has fallen from 10 percent to 6.7 percent. But beneath these top-line numbers, the labor market is still quite fragile. In March, the Federal Reserve tacitly acknowledged the widening gap between the reality of the labor market and its most well-known measures by switching from a quantitative unemployment threshold to more comprehensive “measures of the labor market” in its forward guidance. The question, then, is this: What are some of these broader labor-market indicators the Federal Reserve will be looking at? Here’s a quick tour of the most important jobs data you never see in the headlines.
Who’s working, who isn’t, and why
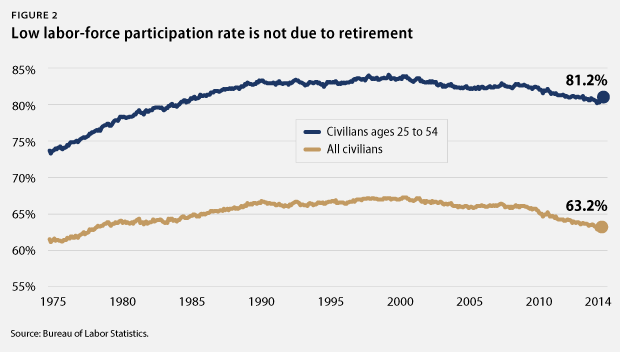
When the economy is doing well, more people typically enter the labor market because there are more jobs available. So we should expect the labor-force participation rate to be increasing in the aftermath of the recession. It hasn’t been. Instead, it’s declined steadily since the end of the recession and is as low today as it was in the late 1970s, when women were entering the workforce for the first time.
One explanation for the decline in labor-force participation is that as Baby Boomers age, more Americans are in retirement. The fact that we see the same postrecession trend among 25- to 54-year-olds, people in their prime working years, makes this theory hard to support.
Underemployed and uncounted job hunters
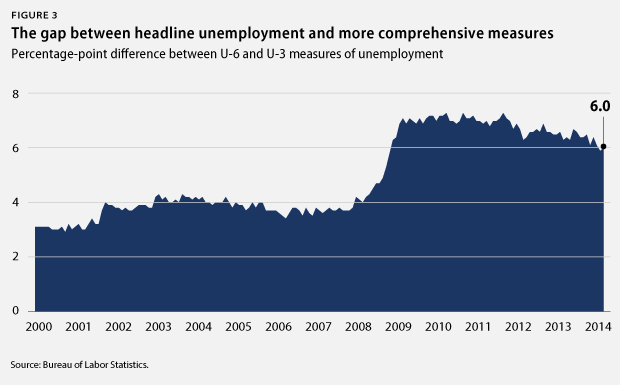
Policymakers and pundits have taken far too much comfort in the decline in the headline unemployment rate. The extent to which unemployment has dropped depends on how it’s measured, especially in this recovery. The typical measure, called U-3 by economists, is pretty restrictive: It counts the percentage of people who are actively looking for work but cannot find it. There are other, broader measures we can look at. Perhaps the most complete picture, called U-6, includes marginally attached workers—those who have looked for work recently but are not looking currently—and those working part time who would prefer full-time work. U-6 is always higher than U-3, but it has gotten a lot higher since the recession.
Long-term unemployment
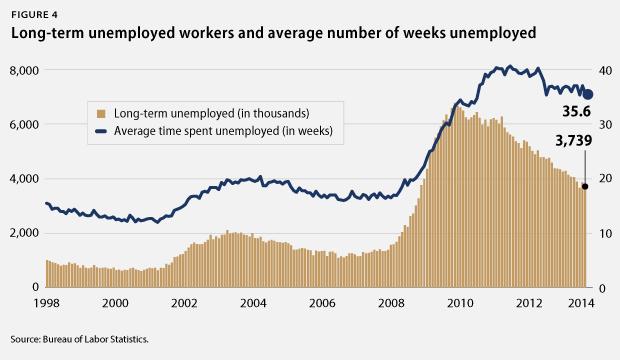
Another reason that the traditional unemployment rate is less informative about the overall health of the labor market is the fact that today the number of long-term unemployed is at its highest level on record dating back to 1948. There are approximately twice as many Americans—now 3.7 million—who have been unemployed for half a year or longer and are still actively searching for work. Thirty-six percent of all unemployed fall into this long-term unemployed category. The average length of time someone has spent unemployed is now more than eight months, roughly double what is was before the recession.
Weak job growth
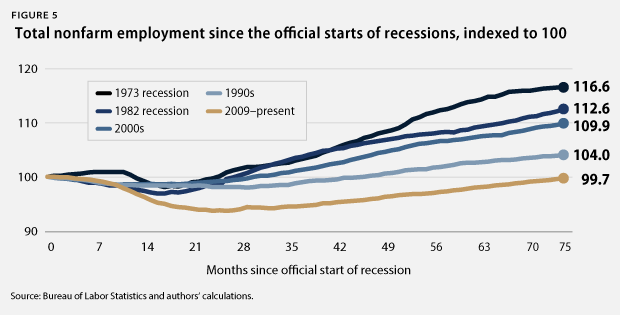
As for job growth, during the economic expansion of the 1990s, the economy added at least 250,000 jobs per month 48 times. During the current expansion, which has now lasted roughly half as long, we have seen only 6 months of job growth greater than 250,000, which includes abnormal hiring involved with conducting the decennial census. Meanwhile, at the average rate of job growth over the past three years, The Hamilton Project estimates that we will not reach our former level of employment, when factoring in new labor-force entrants, until mid-2019.*
Insecure labor force
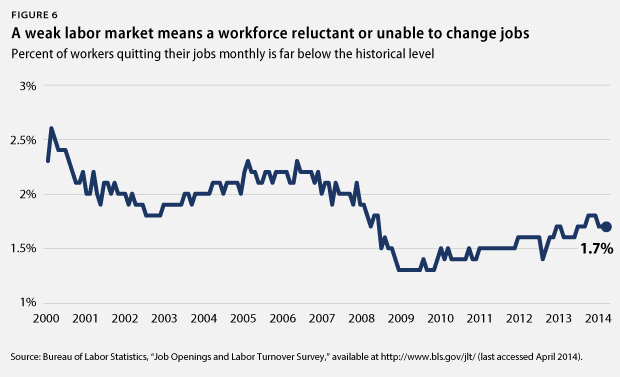
Another approach is to think about what data we would expect to see if the labor market were healthy and look for that data—or the absence of that data. In a healthy labor market, there is a tremendous amount of churn, with roughly 2 million workers flowing in and out of jobs each month. This is crucial for the U.S. economy, as it represents workers and firms finding better, more productive matches. During times of economic uncertainty, however, people are hesitant to leave their jobs. We cannot directly measure something such as overall job fit, but we can make reasonable inferences about these things by looking at the rate at which workers quit their jobs. As you might expect from the rest of the data we have explored, quit rates are conspicuously low, yet another indicator of a still sluggish labor market.
Declining real wages mean labor demand is depressed
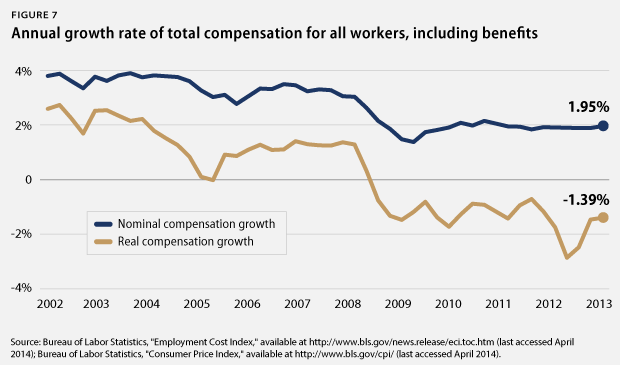
One other way of analyzing the health of the labor market is to treat it like any other market, where supply and demand determine prices—or wages, in this case. We want a labor market that is improving and adding more jobs. If the market is improving, we should see more jobs and upward pressure on the cost of labor. Is there evidence of rising real compensation? Hardly. The Employment Cost Index, a more complete measure than basic hourly wage growth, shows falling real wages since the recession. Negative real wage growth means the amount of slack in the market is still considerable.
Conclusion
We have been living with the effects of the Great Recession for nearly six years, and the unemployment rate has never told a story of the labor market as incomplete as it does today. When policymakers talk about the need to let off the gas pedal and start tightening policy, which Congress has been proudly doing since 2010, they are consciously or unconsciously taking a myopic view of the labor market’s recovery and causing permanent damage to the economy.
Complacency among policymakers has become increasingly entrenched as the recovery lumbers on. Recent data does show that we are headed in the right direction but not nearly fast enough, and we have certainly not arrived at our destination. People usually assume that restraint and caution is safer, but there are situations in which this instinct makes one much less safe. During recovery from a deep recession, speed is safety. If we do not aggressively act to reintroduce the workers who have left the labor force and reduce the number of long-term unemployed, not only would it be an injustice to them, but it would also be a huge, permanent shrinking of the American economy as a whole.
* Note: Authors’ calculations are based on data from the Bureau of Labor Statistics and The Hamilton Project’s Jobs Gap tool. See The Hamilton Project, “Closing the Jobs Gap,” available at http://www.hamiltonproject.org/jobs_gap/ (last accessed April 2014). The methodology for the authors’ estimates of labor-force dynamics is detailed in the following source: The Hamilton Project, “Understanding the ‘Jobs Gap’ and What it Says About America’s Evolving Workforce” (2012), available at http://www.hamiltonproject.org/papers/understanding_the_jobs_gap_and_what_it_says_about_americas_evolving_wo/.
Michael Madowitz is an Economist at the Center for American Progress. Matt Markezich is an intern with the Economic Policy team.