Deferred Action for Childhood Arrivals (DACA) recipients, their families, and their communities are waiting for the U.S. Supreme Court to announce its decision regarding whether the Trump administration’s termination of DACA was lawful. Since 2012, more than 825,000 people—who on average came to the United States in 1999 at the age of 7—have been protected from deportation and able to work under DACA. These individuals grew up and built their lives in the United States, able to pursue higher education, launch careers, and start families under the protections afforded by DACA. And now, with more than 200,000 DACA recipients working alongside their neighbors in essential roles to keep their communities safe amid the COVID-19 pandemic, the stakes could not be higher.
For demographic estimates and economic contributions for the metropolitan areas—and major cities located within them—that are home to more than 1,000 DACA recipients, please see this downloadable
spreadsheet.
As the Center for American Progress has detailed, the nearly 650,000 current DACA recipients in the United States today are deeply rooted community members whose fiscal and economic contributions are felt broadly. Across the country, 1.5 million individuals live in households with DACA recipients, including their quarter-million U.S.-born children. Each year, DACA recipients pay $566.9 million in mortgage payments and $2.3 billion in rental payments, and their households pay $5.6 billion in federal taxes and $3.1 billion in state and local taxes.
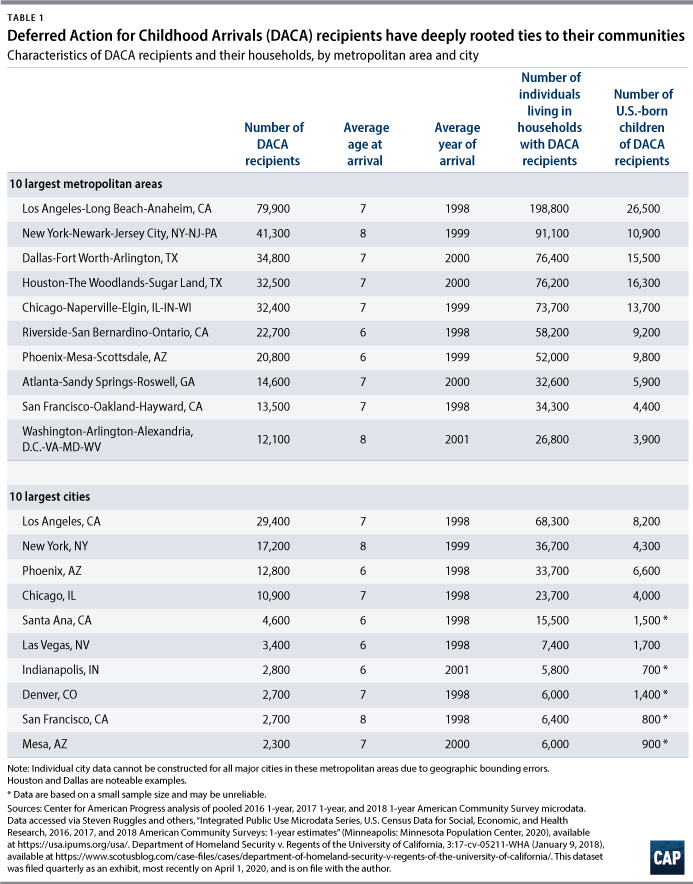
This column presents even more detailed data, highlighting DACA recipients in cities and metropolitan areas across the United States.
Nationally, 84 metropolitan areas are home to at least 1,000 DACA recipients. Among their many roles, they are teachers and entrepreneurs, doctors and nurses. In each of these places across the country, thousands of DACA recipients have familial ties and make important fiscal and economic contributions that keep the nation running.
The United States is DACA recipients’ home
Most DACA recipients have lived in the United States for the majority of their lives. They have deep ties to the social fabric of the United States and to their communities, including their families. Take, for example, the 10 largest metropolitan areas for DACA recipients; in each of these places, more than 25,000 individuals live in a household with a DACA recipient. In Los Angeles, the largest metropolitan home for DACA recipients, 198,800 people, including 26,500 of their U.S.-born children, live with DACA recipients.

DACA-recipient households pay taxes and housing payments that support national, state, and local economies
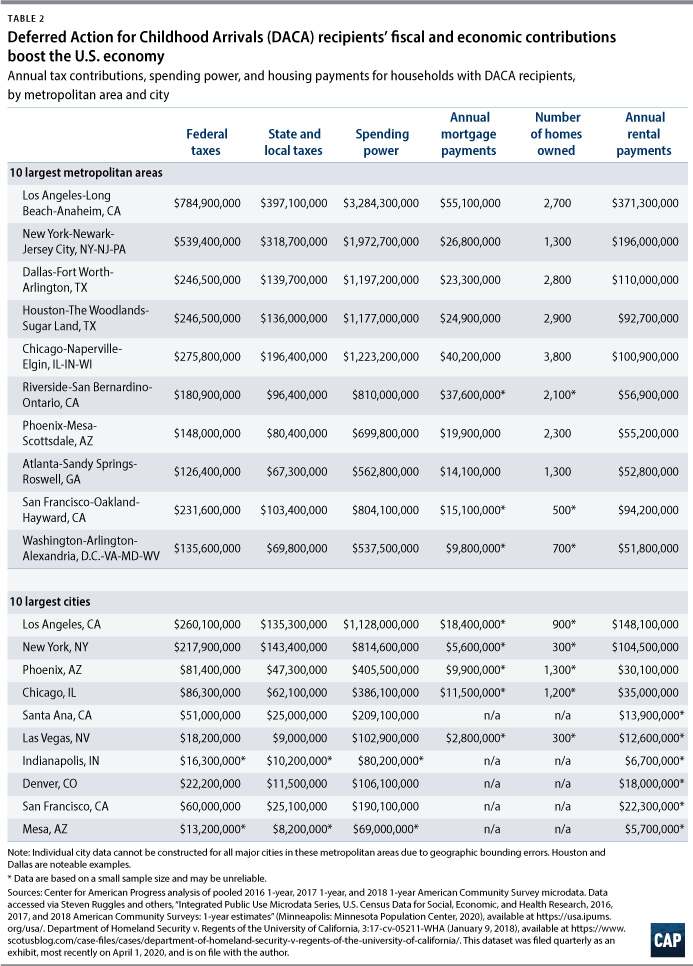
In addition to their roots in their communities, DACA recipients make important economic and fiscal contributions to their communities in the form of tax revenue. DACA recipients and their households pay tens of millions of dollars in taxes to the federal government each year. They also pay state and local taxes: DACA recipients and their households pay at least $2.5 million in state and local taxes each year in 79 metropolitan areas. In 19 metropolitan areas, that tax revenue is more than $25 million.

In a dozen metropolitan areas, DACA recipients pay more than a combined $50 million in rental payments annually in each of those metro areas. They own at least 1,000 homes in 10 metropolitan areas, contributing millions of dollars in annual mortgage payments.
Conclusion
A Supreme Court ruling that allows the Trump administration to terminate DACA would throw the futures of hundreds of thousands of DACA recipients into question. But the impact would extend beyond these young people, also throwing into jeopardy their families and the communities who rely upon their fiscal and economic contributions. For these reasons, it is all the more imperative that DACA recipients remain protected.
Nicole Prchal Svajlenka is the associate director for research on the Immigration Policy team at the Center for American Progress.
Methodology
The data in this column are based on CAP analysis of three years of pooled American Community Survey (ACS) microdata: the 2016 1-year, 2017 1-year, and 2018 1-year ACS, accessed via the University of Minnesota’s IPUMS USA. This column also contains data on the number of DACA recipients filed as evidence in Regents of the University of California, et al. v. U.S. Department of Homeland Security, et al.; the data show 643,430 active DACA recipients as of March 31, 2020, and are on file with the author. Some of the numbers presented here are lower than in previous iterations of this analysis, which can likely be attributed to the quarterly decline in the number of active DACA recipients.
More information on the economic contribution calculations can be found in an earlier iteration of this analysis: “What We Know About DACA Recipients, by Metropolitan Area” by Nicole Prchal Svajlenka.