The economic and labor-market outlook have brightened over the past few months, but there is still a lot of work to be done to build a stronger economy that creates real opportunities for economic security and mobility for everyone. The incoming data for June mark the fifth anniversary since the end of Great Recession and highlight a number of clear weak spots that policymakers can address in the short term. The data for the economy, for instance, show that uncertainty in the housing market related to possible future interest-rate changes is holding back economic growth. Moreover, the trade deficit is widening, which will dampen economic growth over time unless U.S. exports accelerate.
In addition to housing-market uncertainty and a widening trade deficit, some groups of people still suffer severe economic hardships, even as the labor market strengthens. Persistent long-term unemployment, relatively high unemployment rates for communities of color and those with less education, widespread poverty, and lack of decent benefits for many workers are among the most noticeable weaknesses.
Policymakers can do more to build an inclusive economy that does not leave behind those who have suffered economically for many years. Crucial steps include infrastructure spending that boosts construction and lays the foundation for stronger export growth; extended long-term unemployment benefits to help those looking for jobs for more than six months; a higher minimum wage to make it easier for families to climb out of poverty; protection of the Affordable Care Act’s, or ACA’s, critical benefits to give families meaningful access to health care; and expansion of desperately needed benefits at work such as paid time off to care for a sick family member so that breadwinners no longer have to choose between work and family. Congress can and should do more right now to ensure that there is a brightening economic and labor-market outlook for everyone.
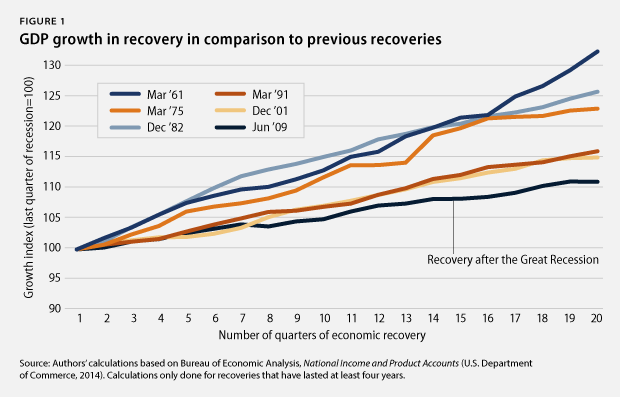
1. American middle-class families deserve a Congress that takes their struggles seriously—not a Congress that is still working for the lucky few instead of for the middle class five years after the end of the Great Recession. Economic growth lags behind similar points in prior business cycles. Gross domestic product, or GDP, fell sharply in the first quarter of 2014 at an inflation-adjusted annual rate of 2.9 percent. Domestic consumption increased by an annual rate of 1 percent, and housing spending substantially shrank by 4.2 percent, while business investment growth fell at a rate of 1.2 percent. Exports decreased by 8.9 percent in the first quarter, and government spending increased by 0.6 percent. The economy expanded by 11 percent from June 2009 to March 2014—its slowest expansion during recoveries of at least equal length. Policymakers need to strengthen growth, as the economy’s momentum is still too low to end the struggles of America’s middle class. Policies could include investments in infrastructure and education to overcome lackluster private business investments.
2. Improvements to U.S. competitiveness lag behind previous business cycles. Productivity growth, measured as the increase in inflation-adjusted output per hour, is key to increasing living standards, as it means that workers are getting better at doing more in the same amount of time. Slower productivity growth means that new economic resources available to improve living standards are growing more slowly than would be the case with faster productivity growth. U.S. productivity rose 6.5 percent from June 2009 to March 2014, the first 19 quarters of the economic recovery since the end of the Great Recession. This compares to an average of 12.4 percent during all previous recoveries of at least equal length. No previous recovery had lower productivity growth than the current one, and policymakers need to strengthen education, research and development, and infrastructure investments as important first steps to lay a foundation for faster future productivity growth.
3. The housing market continues to recover from historic lows. New-home sales amounted to an annual rate of 406,000 in June 2014—an 11.5 percent decrease from the 459,000 homes sold in June 2013 but well below the historical average of 698,000 homes sold before the Great Recession. The median new-home price in June 2014 was $273,500, up from one year earlier. Existing-home sales were up by 2.6 percent in June 2014 from one year earlier, but the median price for existing homes was up by 4.3 percent during the same period. Home sales have to go a lot further, given that homeownership in the United States stood at 64.8 percent in the first quarter of 2014, down from 68.2 percent before the 2007 recession. The current homeownership rates are similar to those recorded in 1996, well before the most recent housing bubble started. A strong housing-market recovery can boost economic growth, and there is still plenty of room for the housing market to provide more stimulation to the economy more broadly than it did before the recent slowdown. The fledgling housing recovery could regain its strength if policymakers support policies that encourage faster income growth—such as a hike in the minimum wage—and have a greater emphasis on good jobs, such as an expansion of apprenticeships.
4. The outlook for federal budgets improves. The nonpartisan Congressional Budget Office, or CBO, estimated in July 2014 that the federal government will have a deficit—the difference between taxes and spending—of 3 percent of GDP for fiscal year 2014, which runs from October 1, 2013, to September 30, 2014. This deficit projection is down from 4.1 percent in FY 2013. This projected deficit for FY 2014 is slightly worse than what CBO predicted in March 2014, when it estimated a deficit of 2.8 percent of GDP for FY 2014. The estimated deficit for FY 2014 is much smaller than it was in previous years, due to a number of measures that policymakers have already taken to slow spending growth and raise a little more revenue than was expected just last year. The slowdown in health care costs—a result partially attributed to provisions within the ACA—has significantly contributed to these shrinking deficit projections. The improving fiscal outlook generates breathing room for policymakers to focus their attention on targeted, efficient policies that promote long-term growth and job creation as well as deficit reduction.
5. Moderate labor-market recovery shows less job growth than in previous business cycles. There were 7.8 million more jobs in June 2014 than in June 2009. The private sector added 8.5 million jobs during this period. The loss of some 567,000 state and local government jobs explains the difference between the net gain of all jobs and the private-sector gain in this period. Budget cuts reduced the number of teachers, bus drivers, firefighters, and police officers, among others. The total number of jobs has now grown by 6 percent during this recovery, compared to an average of 11.9 percent during all prior recoveries of at least equal length. Although employment has finally reached its prerecession peak, policymakers need to do much more to create jobs as Millennials—those born roughly between 1980 and 2000 and currently the largest generation of Americans—begin to reach working age.
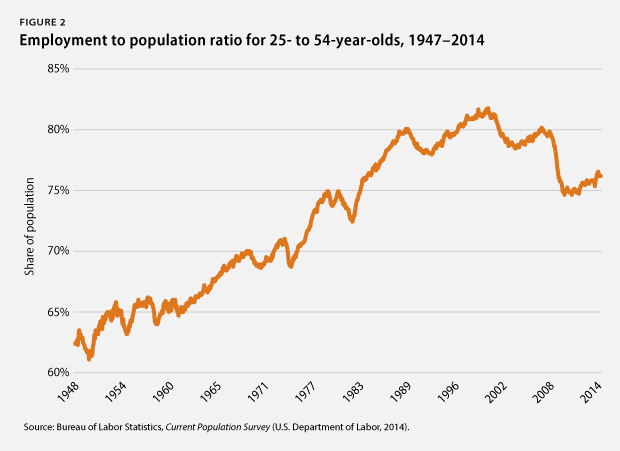
6. Employment opportunities grow very slowly for people in their prime earning years. The employed share of the population from ages 25 to 54—which is unaffected by the aging of the overall population—was 76.7 percent in June 2014. This was just above the level recorded in June 2009 and well below the levels recorded since the mid-1980s and before the Great Recession started in 2007. The employed share of the population has, on average, grown by 3.1 percentage points at this stage during previous recoveries of at least equal length. Waiting for a healthy recovery simply is not enough to help workers. Policymakers need to step in to generate faster growth that can result in more jobs for all workers.
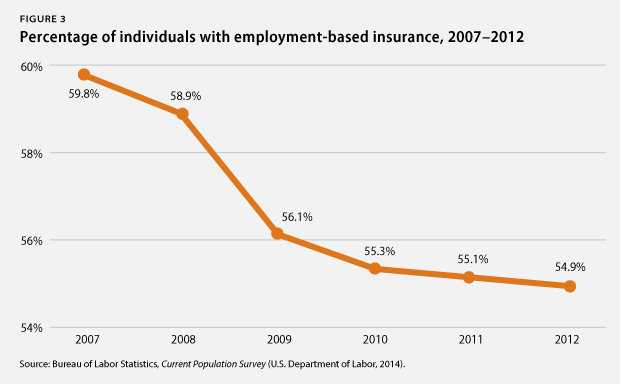
7. Employer-sponsored benefits disappear. The share of people with employer-sponsored health insurance dropped from 59.8 percent in 2007 to 54.9 percent in 2012, the most recent year for which data are available. The share of private-sector workers who participated in a retirement plan at work fell to 39.4 percent in 2012, down from 41.5 percent in 2007. Families now have less economic security than in the past due to fewer employment-based benefits, which requires them to have more private savings to make up the difference. The ACA appears to set a welcome counterpoint to the trend of disappearing health insurance benefits. Since the ACA’s marketplace open enrollment period began in October 2013, the uninsured rate has dropped to 13.4 percent, the lowest monthly rate recorded since 2008. Moreover, uninsured rates continue to decline among communities of color and low-income Americans. Since January 2014, the uninsured rate has dropped by 7.1 percent for African Americans, 5.5 percent for Hispanics, and 5.5 percent for lower-income Americans.
8. Some communities continue to struggle disproportionately from unemployment. The unemployment rate fell slightly to 6.1 percent in June 2014: The African American unemployment rate was 10.7 percent; the Hispanic unemployment rate was 7.8 percent; and the white unemployment rate was 5.3 percent. Meanwhile, youth unemployment rose to 21 percent. The unemployment rate for people without a high school diploma remained steady at 9.1 percent, compared with 5.8 percent for those with a high school degree, 5 percent for those with some college education, and 3.3 percent for those with a college degree. Population groups with higher unemployment rates have struggled disproportionately more amid the weak labor market than white workers, older workers, and workers with more education. Targeted policy interventions such as extended unemployment insurance benefits would offer much-needed help for some population groups, such as struggling youth and communities of color.
9. The rich continue to pull away from most Americans. Incomes of households in the 95th percentile—those with incomes of $191,000 in 2012, the most recent year for which data are available—were more than nine times the incomes of households in the 20th percentile, whose incomes were $20,599. This is the largest gap between the top 5 percent and the bottom 20 percent of households since the U.S. Census Bureau started keeping records in 1967. Median inflation-adjusted household income stood at $51,017 in 2012, its lowest level in inflation-adjusted dollars since 1995. And the poverty rate remains high—at 15 percent in 2012—as the economic slump continues to take a massive toll on the most vulnerable citizens. Higher minimum wages, an improved Earned Income Tax Credit and the closure of tax loopholes for the rich would be critical first steps for policymakers to address income inequality.
10. Corporate profits stay elevated near precrisis peaks. Inflation-adjusted corporate profits were 100 percent larger in March 2014 than in June 2009. The after-tax corporate profit rate—profits to total assets—stood at 3.4 percent in March 2014—higher than any profit rate recorded since September 1979. Corporate profits recovered quickly toward the end of the Great Recession and have stayed high since then. Addressing income inequality that arises from the rich receiving outsized benefits from their wealth through tax reform is a crucial policy priority.
11. Corporations spend much of their money to keep shareholders happy. From December 2007—when the Great Recession started—to December 2013, nonfinancial corporations spent, on average, 97 percent of their after-tax profits on dividend payouts and share repurchases. In short, almost all of nonfinancial corporate after-tax profits went to keep shareholders happy during the current business cycle. Nonfinancial corporations also held, on average, 5.3 percent of all of their assets in cash—the highest average share since the business cycle that ended in December 1969. Nonfinancial corporations spent, on average, 167 percent of their after-tax profits on capital expenditures or investments—by selling other assets and by borrowing. This was the lowest ratio since the business cycle that ended in 1960. U.S. corporations have prioritized keeping shareholders happy and building up cash over investments in structures and equipment, highlighting the need for regulatory reform that incentivizes corporations to invest in research and development, manufacturing plants and equipment, and workforce development.
12. Poverty is still widespread. The poverty rate remained flat at 15 percent in 2012—the most recent year for which data are available—which is an increase of 0.7 percentage points over the three years of the recovery, 2009 to 2012. The poverty rate has fallen, on average, by 0.7 percentage points in previous recoveries of at least equal length. Moreover, some population groups suffer from much higher poverty rate than others. The African American poverty rate, for instance, was 27.2 percent, and the Hispanic poverty rate was 25.6 percent, while the white poverty rate was 9.7 percent. The poverty rate for children under age 18 stood at 21.8 percent. More than one-third of African American children—37.9 percent—lived in poverty in 2012, compared with 33.8 percent of Hispanic children and 12.3 percent of white children. Strengthening economic security by adopting measures such as the Universal Savings Credit and the expansion of social safety net programs—such as SNAP and Medicaid—can help us reduce poverty and provide opportunities to Americans who need them most.
13. Household debt is still high. Household debt equaled 103.4 percent of after-tax income in March 2014, down from a peak of 129.7 percent in December 2007. A return to debt growth outpacing income growth, which was the case prior to the start of the Great Recession in 2007, from already-high debt levels could eventually slow economic growth again. This would be especially true if interest rates also rise from historically low levels due to a change in the Federal Reserve’s policies. Consumers would have to pay more for their debt, and they would have less money available for consumption and saving. Policymakers should therefore focus on creating high-quality jobs so that people do not need to borrow as much money as they did in the past and on regulatory reform to help millions of families avoid high and detrimental costs of credit.
Christian E. Weller is a Senior Fellow at the Center for American Progress and a professor in the Department of Public Policy and Public Affairs at the McCormack Graduate School of Policy and Global Studies at the University of Massachusetts, Boston. Jackie Odum is a Research Assistant for the Economic Policy team at the Center.