Introduction and summary
“Prediction is very difficult, especially if it’s about the future.” 1
—Niels Bohr
The goal of the U.S. surface transportation system should be to safely, sustainably, and cost-effectively facilitate the movement of people and goods. Yet for the past six decades, governments at all levels have focused almost exclusively on roadway and highway investments intended to carry cars and trucks in ever larger numbers and at higher speeds.2 This approach has resulted in a transportation system that is hostile to and dangerous for pedestrians and other nonautomotive users.
Data from the National Highway Traffic Safety Administration show that 5,987 pedestrians and 840 cyclists were killed in roadway accidents in 2016.3 These numbers are especially troubling because walking and cycling represent only 2.8 percent and 0.6 percent of commuting trips, respectively.4 And while people walk and bike more often for social and recreational reasons, these percentages serve as a useful proxy for risk exposure, since more than 70 percent of fatalities occur on arterial roadways, which pedestrians are more likely to cross on a commute to a job center rather than on a walk around a residential neighborhood.5
Unfortunately, the lack of dedicated facilities and operational policies intended to support pedestrians, cyclists, and other nonautomotive users means that many roadways are dangerous by design. Moreover, the risk of serious injury and death that pedestrians face every day pushes most people to drive. Without safe and efficient transportation options, people become dependent on their vehicles for all mobility needs, which imposes significant costs on the economy, environment, and public health.
In recent years, technology companies and traditional automotive manufacturers have poured billions of dollars into the development of autonomous vehicles (AVs). The AV revolution promises to substantially reduce motor vehicle fatalities for both passengers and pedestrians. Yet reducing the number of fatal pedestrian accidents solves only half the problem. Even after AVs reached their full potential, the surface transportation system would still fail to accommodate nonautomotive users. Furthermore, the operational characteristics of AVs may push transportation planners to adopt infrastructure design elements and system management policies that further prioritize vehicles over pedestrians. In short, reducing accidents does not increase nonautomotive access.
It may be tempting to view pedestrian, bicycle, and other nonautomotive mobility options such as electric scooters and e-bikes as a niche segment of the overall surface system unworthy of serious investment and attention. However, this view is incorrect. Improving the accessibility of the surface transportation system for nonautomotive users is a transportation and urban development imperative.
This report details how the current approach of prioritizing vehicle mobility is unsustainable in three ways: space, emissions, and cost. The sustainable and cost-effective solution to these related challenges is to prioritize infrastructure design and operational policies that support nonmotorized users, combined with robust investment in public transportation. Next, the report shows that the coming autonomous vehicle revolution will not resolve these pressing challenges. The report concludes by arguing that the advanced capabilities of AVs have the potential to lead to a surface transportation system that is even more hostile to nonmotorized users than the current one. Unless planners make pedestrian and nonmotorized access a top priority, metropolitan regions risk repeating the same mistakes that occurred with the rise of automobiles more than a century ago.
Urban space
The most precious urban commodity is space. In 1930, 56 percent of Americans lived in urban areas.6 Today, the share has climbed above 80 percent and is expected to continue to rise.7 Moreover, data from the Census Bureau show that annual population growth rates in large metropolitan areas outpace growth rates in small metropolitan and nonmetropolitan areas.8
One result of rapid urban population growth and infrastructure investments that largely ignore transit and nonautomotive users is rising roadway congestion. Data from Texas A&M University show that since 1990, the average commuter living in one of the 101 largest metropolitan areas in the United States has seen their total annual roadway delay rise from 34 hours to 52 hours—an increase of 53 percent.9 In 2014—the most recent year for which comprehensive data are available—drivers collectively faced a total of 6.9 billion hours of roadway delay, which cost the economy $160 billion in lost productivity and wasted fuel.10
Without a change in investment priorities, roadway congestion is likely to worsen substantially in the coming decades. For instance, in the past 15 years, the total number of registered vehicles in the United States has grown at 1 percent annually.11 If this trend holds, the United States would add approximately 90 million vehicles over the next 30 years.12 Given existing levels of congestion, it’s hard to envision how the roadway system will be able to accommodate tens of millions of additional vehicles.13
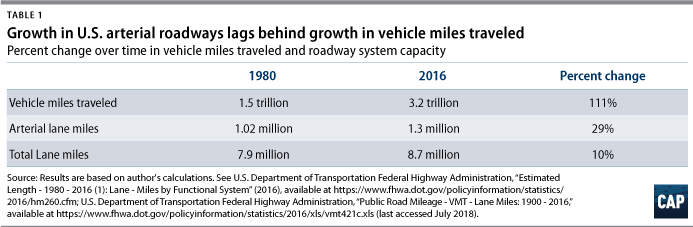
From 1980 to 2016, total vehicle miles traveled (VMT) increased by 111 percent, from 1.5 trillion miles annually to 3.2 trillion miles annually. By comparison, the arterial roadway network, which includes the interstate system, state highways, and other major roadways, grew by only 29 percent during the same period.14 The modest growth in arterial roadways compared with VMT is the result of two barriers: cost and politics.
Over time, commercial and residential development builds up around arterial roadways and highways. This means that many potential expansion projects would necessarily involve a high level of eminent domain. The cost of tearing down homes and businesses is often prohibitively expensive. Moreover, community opposition to large-scale eminent domain is typically fierce. And while a state department of transportation may succeed in expanding the network in less dense exurban areas, these projects have little if any impact on congestion levels within the urban core.
 In short, the upper bound that commercial and residential development places on expanding the roadway system means that planners must look for ways to move people and goods more efficiently. Stated differently, planners need to figure out how to increase the productivity of the existing roadway system. Walking, cycling, and public transportation are the most efficient and sustainable alternatives. Moreover, they are mutually reinforcing. After all, most transit riders are pedestrians at the start and end of their journey.15 A surface transportation system that is safe and supportive of nonautomotive users is also one that is primed to increase transit ridership.
Each lane of an access-controlled highway can carry roughly 2,200 vehicles per hour before speeds decrease to the point that the flow of traffic slips from stable to stop-and-go conditions.16 According to the Federal Highway Administration, the average light-duty vehicle carries 1.7 passengers.17 This means that at peak capacity, each highway lane is able to carry roughly 3,700 people per hour. By comparison, a single subway line can carry substantially more. For example, the Washington Metropolitan Area Transit Authority’s (WMATA) Orange Line that connects Northern Virginia to Washington, D.C., carriers 15,400 passengers per hour during the peak period, or the same number of people as four lanes of an access-controlled highway.18
For signalized arterial roadways, the efficiency of transit compared with that of light-duty vehicles is also impressive, but the story is more complex, as the design characteristics of signalized roadways vary considerably. For instance, the frequency of signalized intersections, density of surrounding development, lane width, and the presence of on-street parking, among other factors, affect vehicle throughput per lane per hour.19 Given the heterogeneity of signalized urban arterial designs, it helps to simplify the comparison.
A standard 40-foot city bus takes up roughly as much space on the roadway as two light-duty vehicles. On average, two light-duty vehicles will carry fewer than four total passengers. A 40-footbus operating at full capacity can carry as many as 75 passengers.20 The full capacity of an articulated bus is more than 100 passengers.21 These numbers are not theoretical. Data from the WMATA show that many of its bus routes operate at or near full capacity during the morning and evening peak periods.22 Thus, the average WMATA bus is carrying nearly 20 times as many passengers on the same amount of roadway space as two cars.23 The productivity of buses is not limited to the morning and evening commute. Overall, many WMATA bus routes operating within Washington, D.C., experience continuous crowding throughout the day.24
Emissions
According to data from the Environmental Protection Agency, the transportation sector is now the largest source of greenhouse gas emissions in the United States.25 Most mobile emissions come from the nearly 190 million registered light-duty vehicles26 in the United States that collectively travel 2.8 trillion miles each year.27 On average, each of these vehicles emits about 4.6 metric tons of carbon dioxide annually.28 In addition to heat-trapping gases, vehicles emit harmful pollutants, such as tiny particulate matter that embeds deep in people’s lungs, nitrogen oxides, and volatile organic compounds.29 These and other pollutants from the transportation sector cause or exacerbate a host of health problems, including asthma and heart and lung disease, to name only a few.30 The Environmental Protection Agency estimates that approximately 123 million residents live in counties with air pollution levels that exceed the National Ambient Air Quality Standards, with mobile sources serving as a major contributor.31
The U.S. Department of Transportation estimates that over the next 30 years, total vehicle miles traveled will rise by 1 trillion miles annually.32 Promoting the adoption of battery electric and other clean technology vehicles is vital to combating harmful mobile-source emissions. However, current technology adoption projections indicate that most of these miles will be traveled by vehicles with combustion engines.33 Building facilities and implementing policies to support transit, walking, and other nonautomotive use must be part of a comprehensive approach to combating air pollution.
Cost
The United States faces a tremendous surface transportation infrastructure repair backlog.34 Many highways and bridges have simply come to the end of their useful life and need to be reconstructed or replaced. The continued functioning of the highway system depends on all levels of government making the necessary investments to maintain these critical assets in a state of good repair. Beyond repair and maintenance, the case for substantial highway expansion is surprisingly weak.
Research by the Federal Highway Administration (FHWA) indicates that investing in additional pavement does not yield significant roadway performance improvements. The FHWA looked at six different highway expansion investment scenarios—from $19.9 billion annually at the low end and up to $30 billion annually at the high end.35 The results from the scenario analysis are sobering. Increasing investment from $19.9 billion to $30 billion, or 51 percent, raised average vehicle speeds by less than 1 percent and reduced annual hours of roadway delay by only 5 percent.36
There are two reasons why increasing spending for highway expansion offers such a paltry return on investment. First, the United States has already reaped most of the efficiency gains from past highway investments. Prior to the Federal-Aid Highway Act of 1956, the United States lacked a comprehensive network of limited-access highways capable of rapidly carrying people and goods over long distances or even across town. The existing roadway network consisted of two-lane rural roads and state highways that typically had many signalized intersections and at-grade crossings. These roads simply could not move large volumes of vehicles at high speeds. The completion of the interstate highway system unlocked real efficiency—albeit at an enormous social and environmental cost. Yet expanding the current system of interstate and other highways produces only incremental improvements.
Second, highway expansion projects fail to significantly reduce congestion and delay due to induced demand. Essentially, a desire to avoid congested roadways means that people don’t take trips they otherwise would. Professor Susan Handy at the University of California, Davis, states, “The basic economic principles of supply and demand explain this phenomenon: adding capacity decreases travel time, in effect lowering the ‘price’ of driving; and when prices go down, the quantity of driving goes up.”37 Unfortunately, this means that once the state has completed a highway expansion project, people take additional trips up to the point that roadway congestion and delay reach their prior level.38
Taken together, highway and roadway investments that lock people into automobile dependence produce harmful emissions, consume precious urban space, and yield only marginal system performance improvements. State and local planners must begin to move in a more efficient and sustainable direction. Walking, cycling, and other nonautomotive options in combination with transit are the best approach—especially in the largest metropolitan regions. Yet to unlock the full potential of these options, planners need to develop infrastructure facilities and operational policies that are truly supportive of nonautomotive users. In smaller urban areas and rural communities with more stable populations and less need for expansion, supporting nonautomotive users will require retrofitting existing facilities in combination with operational changes.
Technology, economics, and behavior
The technological sophistication of autonomous vehicles (AVs) often leads to a form of extreme techno-utopian thinking that assumes AVs are the self-evident solution to all transportation challenges. Recently, The Atlantic published a piece that suggested the New York City subway system was so broken that the transit authority should rip up its tracks and allow autonomous vehicles to use the existing tunnels instead.39This policy prescription boggles the mind, given that the New York City subway system is the most heavily patronized subway system in the United States, providing 5.5 million trips every weekday and more than 1.7 billion trips annually.40
The New York City subway continues to be an indispensable part of the city’s transportation system not because electrified trains are the newest technology but because the subway is affordable; convenient; and, during morning and evening commutes, often faster than other options. Stated differently, the subway system offers comparative advantages over automobiles when it comes to capacity and efficiency in a dense urban area.
Similarly, bicycles have been around for more than a century and continue to serve a critical mobility role. For instance, in June 2018, the New York City bike rental company known as Citi Bike provided more than 1.9 million trips, or roughly 65,000 trips per day.41 These trips had a combined distance of almost 3.6 million miles.42 The average trip distance was 1.84 miles with a duration of approximately 15 minutes. Not only are bicycles sustainable and efficient, but Citi Bike data also indicate that bicycles often have an advantage in speed and ease of use compared with other modes for middle-distance trips.
What extreme techno-utopian pronouncements often miss is that technological advancement alone is not sufficient to produce a true mobility revolution. Three forces shape transportation change: technology, economics, and behavior. Consider the Concorde airliner. The Concorde could maintain a cruising speed of 1,350 miles per hour, cutting the flight time between cities roughly in half compared with standard commercial jet airplanes.43 Yet high ticket prices and high operation and maintenance costs—excluding the initial acquisition cost as the British and French governments purchased the airplanes for their major carriers—made the service unaffordable for too many flyers.44
The Concorde stopped flying altogether in 2003, but not because the technology didn’t work or because travel behavior shifted away from aviation.45 In fact, international aviation growth has outpaced population growth for decades. Since 1970, total international boardings in the United States have increased by 4 percent each year.46 Over this same period, the U.S. population has grown at an annual rate of roughly 1 percent.47
The early years of automobile production also demonstrate that price and behavior are not trivial matters. In 1900, the average handmade automobile cost around $1,000.48 By the early 1920s, Henry Ford was selling cars for $265.49 Ford did not invent the automobile, but his production line made a previously unaffordable, bespoke technology accessible to many more people. Historical vehicle registration records show that automobile sales grew exponentially as prices declined. According to the U.S. Department of Transportation, there were 8,000 cars in the United States in 1900.50 By 1930, there were more than 23 million.51 Compared with a horse and buggy, automobiles allowed the same on-demand mobility but with several clear advantages, including no longer needing to feed and stable horses, among others.
Proponents of autonomous vehicles as the solution to all transportation challenges are asserting that technology, price, and consumer behavior will come together in a way that improves the performance of the surface transportation system. Yet research indicates that autonomous vehicles may exacerbate metropolitan congestion.
In 2015, the Organisation for Economic Co-operation and Development (OECD) modeled the effects of AVs on Lisbon, Portugal. The study produced two critical findings. First, when compared with the existing number of registered vehicles, a smaller fleet of AVs operating on a near continuous basis could provide equivalent mobility for city residents.52 This makes intuitive sense since most private light-duty vehicles sit unused roughly 95 percent of the time.53
Second, and more importantly, total vehicle kilometers traveled (VKT) increased by 89 percent when researchers removed public transportation from the model and assumed that most AV trips would be taken by single riders.54 The huge spike in VKT results from AVs having to run empty—also known as deadheading—back to designated waiting areas or to pick up the next rider.
This finding is especially problematic because roadway congestion grows exponentially. This means that as roadways become full, the added delay caused by each additional vehicle or mile of travel is substantially greater than when roadways are relatively empty. For instance, adding vehicles to a highway at 2:00 a.m. has no measurable effect on travel speeds or delay. However, adding vehicles to an already congested highway during the morning peak period may cause traffic flow to break down from slow and steady to stop-and-go.
SAE International has developed a 0 to 5 scale to describe different levels of vehicle automation:55
- Level 0: Driver performs all tasks.
- Level 1: Vehicle principally operated by the driver with driver assistance features.
- Level 2: Vehicle has multiple automation features but still requires continuous driver engagement.
- Level 3: Vehicle operates autonomously under certain limited conditions; driver must be ready to take control with short notice.
- Level 4: Vehicle operates autonomously under most conditions.
- Level 5: Vehicle operates autonomously under all conditions.
When the OECD researchers assumed that nearly all trips would be through ride-sharing, total VKT still increased by 22 percent.56 Given the current level of congestion and delay in many U.S. cities, a 22 percent increase in vehicle travel would create significant challenges. Yet even this result rests on an enormous behavioral assumption: that people will be willing to shift from mostly driving alone to sharing rides as AVs become ubiquitous.
It’s fair to question whether this is a realistic assumption. According to the most recent census data, 76 percent of commuters drive alone to work, while just 9 percent carpool.57 Since 2000, the share of people who carpool to work has fallen by 3 percent, even as roadway congestion and delay have increased considerably.58
There is another reason to assume that ride-sharing levels in the United States will not reach those of the OECD model: insufficient density. Lisbon has an average population density of approximately 17,300 people per square mile.59 Given this high level of density, researchers assumed that route deviations—when an AV takes a route that is not the shortest travel path from origin to destination to pick up and drop off additional riders—would be relatively modest. The paper estimated that most detours would be shorter than 2.5 kilometers and fewer than 6 minutes in duration.60
Yet in the United States, only San Francisco and New York City proper have equivalent or greater density than Lisbon. Even large U.S. cities have far lower population densities. For example, Washington, D.C., has a density of 9,857 residents per square mile. Houston and Atlanta fall well below the Lisbon test case at 3,502 and 3,154 residents per square mile, respectively.61 Lower population density translates into longer and more time-consuming route deviations. The average American driving commute now takes almost 27 minutes each way.62 This suggests most Americans make commuting trips that cover distances that would require greater deviations to bundle multiple trips together through ride-sharing. Lower population density also increases wait times as AVs must deadhead over longer distances between fares.
- Ride-hailing: Typically involves one person requesting a car that makes one pickup and one drop off.
- Ride-sharing: Typically involves two or more people riding in one vehicle with multiple pickups and drop-offs.
At issue is the fact that demand and behavior are related but distinct concepts. In the future, U.S. consumers may use autonomous vehicles frequently, choosing to forgo vehicle ownership altogether. However, this does not mean that consumers will want to engage in ride-sharing. Heavy consumer demand would result in a successful business opportunity for companies tied to the production, operation, repair, and management of AV fleets. But this does not necessarily translate into improved roadway performance in the form of reduced congestion.
One objection to the OECD paper is that comparing analog cars driven by people to autonomous vehicles is like comparing apples to oranges, since autonomous vehicles will have performance characteristics that are beyond the average human driver. For instance, onboard cameras and sensors working in combination with streaming data from other vehicles and the underlying infrastructure will allow AVs to travel at higher speeds and in closer proximity than current passenger vehicles. As a result, both limited-access highways and signalized arterial roadways will be able to carry a larger number of vehicles per hour per lane. This increased capacity would improve the overall economic productivity of roadways and lessen the impact of additional vehicle miles traveled from deadheading.
This criticism is compelling, but it overlooks that the capacity gains from AVs represent a one-time bump as opposed to an ever-increasing benefit. There is no Moore’s Law for autonomous vehicles. Moreover, the capacity bump is likely to be greater for highways than signalized arterial roadways due to both urban design and political limitations. Even if autonomous vehicles could safely travel at 60 miles per hour on a signalized arterial, such an operational change would lead to jarring incongruity with the surrounding residential and commercial land uses. This would likely lead to speed limits on AVs that largely mirror current speed limits in cities, meaning that the capacity bump on signalized arterials is likely to be modest. And limited-access highways and signalized arterials are connected. No matter how many AVs a limited-access highway may be able to carry, those vehicles must eventually exit onto surface roadways.
The clear comparative advantage of autonomous vehicles is safety. With more than 34,000 fatal motor vehicle crashes in 2016, the safety improvements of AVs cannot come fast enough.63 Yet the potential for AVs to reduce congestion in the United States is strongly tempered by low population densities and the strong preference of consumers to drive—and likely ride—alone.
Autonomous vehicles are not the solution to every transportation challenge. Government at all levels must continue to invest in the deep efficiency of walking, cycling, and other nonautomotive options in combination with public transportation. Moreover, planners need to look for design elements and operational policies that support and reinforce nonautomotive users.
Hostile and dangerous by design
Today, roadways are designed and used almost exclusively by cars and trucks. But this was not always the case. Historically, many roadways were used for social and commercial purposes as much as transportation. The following photo shows the Little Italy neighborhood in New York City around the turn of the 20th century. The photo illustrates a wide range of users and purposes. Given that walking and riding on horseback or in a carriage were the most prevalent forms of transportation, it’s easy to understand how a diverse mixture of users and purposes could easily coexist.
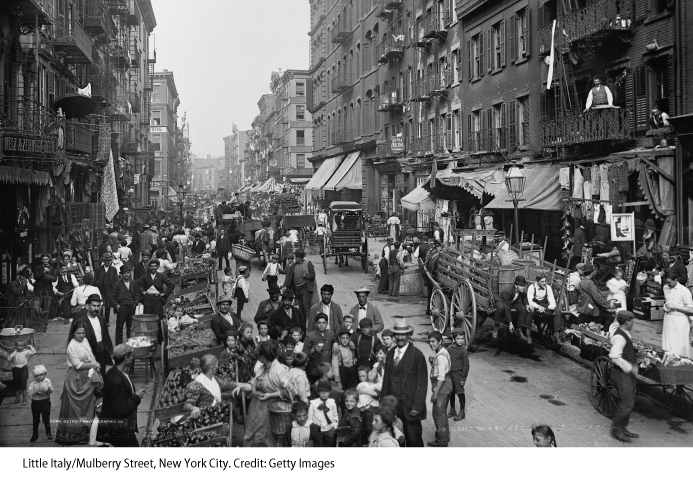
The equanimity of the Little Italy street scene would soon give way to an intense competition over street use as automobile ownership transitioned from a hobby for a wealthy few to a mass-market form of transportation. According to historian Peter Norton of the University of Virginia in his excellent article “Street Rivals: Jaywalking and the Invention of the Motor Age Street,” many people “regarded the city street as a public space, open to anyone who did not endanger or obstruct other users.”64 For this reason, “before the city street could be physically reconstructed to accommodate motor vehicles, it had first to be socially reconstructed as a motor thoroughfare.”65 In other words, vehicle owners had to secure a political victory that rested on a normative claim about which users should be on the road.
Part of the political project of vehicle owners involved labeling pedestrians with derogatory terms. Pedestrians became “jaywalkers.” This may not seem particularly offensive by current standards, but at the time a “Jay” was a pejorative term for an ignorant or foolish person who talked at length.66 By demeaning pedestrians, vehicle owners sought to diminish pedestrians’ claim to be rightful users of the roadway system. As Norton demonstrates through his work, the change in public attitudes did not come overnight.
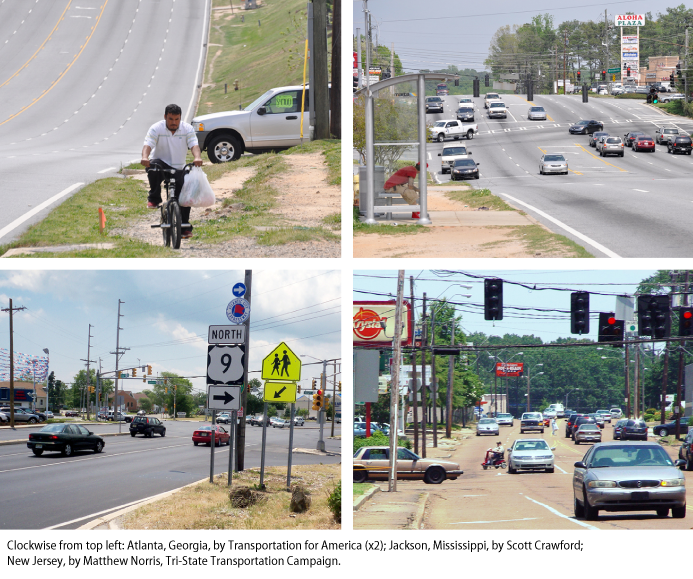 Though delayed, the triumph of vehicles over other users has been overwhelming. Outside of some residential neighborhoods and downtown business districts, pedestrians have all but vanished from America’s surface transportation system. Those pedestrians, cyclists, and transit riders that do try to use the system must confront a hostile and dangerously built environment. The following images from Atlanta, Georgia; Jackson, Mississippi; and Atlantic City, New Jersey, show how moving vehicles have become the focus of planning and investment.
Norton’s article on the competition for streets contains another important insight that is very relevant for a future full of autonomous vehicles: The fight over roadways was political, but it’s origin was technological change. Prior to the rise of automobiles, streets successfully accommodated very different modes, including pedestrians; horses; and, later, streetcars. These three modes could hardly be more different. Yet they worked well together, in part because they moved slowly. The same could not be said of automobiles. Norton states: “Thus the automobile’s essential attributes put it at odds with prevailing perceptions of legitimate street use.” Automobiles were designed for speed; driving slowly enough to remain compatible with multiuse streets was to negate the very purpose of purchasing a vehicle in the first place.
Similarly, autonomous vehicles will have performance characteristics that allow planners to design infrastructure facilities and operational policies that are even more deeply hostile to pedestrians and other nonautomotive users than the current surface transportation system. To understand how, it helps to differentiate design and operational elements that are principally about assisting drivers to better control vehicles, as opposed to directly supporting pedestrian and other nonautomotive access.67
A basic premise of designing roadways is that human drivers—through a combination of willful disobedience and incompetence—often fail to comply with traffic laws. In response, planners look for design strategies that maximize safety and compliance. A simple example is the speed bump. A city government may institute a reduced speed limit within a school zone, but posted limits are often ignored. A speed bump is a modest physical barrier that forces drivers to slow down. A driver that attempts to drive over the barrier at an excess speed risks serious damage to their vehicle.
Similarly, elements such as traffic lights, road signs, raised crosswalk pavement, and lane widths are visual cues that provide the driver with critical information about what lies ahead and what action they must take. In theory, once AVs become ubiquitous, many of the design and traffic control elements directed at improving driving quality and compliance with the law will disappear. State and local rules of the road will be uploaded to vehicles based on highly accurate geolocation information.
From the perspective of nonautomotive access, the loss of these elements would likely have little, if any, negative effect. After all, a speed bump isn’t needed to enforce a school zone speed limit if AVs are programmed to follow the law. Instead, the threat to nonautomotive access comes from design and operational changes intended to take advantage of the performance characteristics of AVs not directly tied to accident avoidance.68 For instance, human drivers must leave a significant distance between vehicles to allow for safe reaction times in response to unexpected stops, turns, and other disruptions to the flow of traffic. By comparison, AVs will be able to use deep situational awareness from onboard systems and streaming data from other vehicles to dramatically reduce spacing. The operational possibilities of AVs don’t stop there.
In the future, AV fleet operators will have real-time origin and destination data on thousands of riders. During the morning and evening peak periods, these operators could bundle together multiple vehicles with similar destinations in a tightly spaced line, forming a type of road train.69 Furthermore, to reduce peak-period congestion in areas of high demand, the local government may adopt traffic management policies that provide these road trains with priority passage. Imagine a policy that designated certain principal arterials as priority corridors and banned left turns during the peak period so that many lights could be synchronized to stay green for AV road trains.
A multivehicle road train would present a substantial barrier to nonautomotive users. First, pedestrians take advantage of regular light cycle changes to cross the street. Lengthy waits in the name of increasing AV throughput would penalize nonautomotive users by increasing their overall travel times. Second, eliminating left turns and synchronizing stretches of traffic lights could mean designating certain streets as cross streets. When highway planners designed the interstate system, not every cross street received an underpass or overpass. Similarly, prioritizing outbound traffic from downtown during the evening peak period could mean designating certain streets as cross streets. For someone riding in an AV, the added time needed to deviate from the shortest route to cross a priority corridor at a designated cross street would likely be modest. But for a pedestrian, such deviations would mean much longer trips.
Even mundane operational policy changes could prove antagonistic to nonautomotive users. Currently, cities dedicate a large share of their curb space to parking. This policy reflects the fact that most private vehicles sit unused roughly 95 percent of the time.70 For cyclists, parked cars become dangerous when the driver returns and attempts to merge their vehicle with flowing traffic. The process of merging causes the parked car to cross the nonautomotive right of way. Sometimes this right of way is formally marked with a bike lane, but many times the right of way is whatever space a cyclist can carve out of the active travel lane. A future filled with autonomous vehicles will require less street parking. However, if parking spaces are replaced by the constant entry and exit of AVs picking up and dropping off riders on a mass scale, cyclists could end up facing an untenable gauntlet.
A counterargument to this scenario is that many collisions between cyclists and vehicles pulling into traffic stem from driver inattention—for instance, the driver checking a side mirror quickly for approaching cars without also looking for cyclists. In theory, the sensors onboard an AV will eliminate this type of collision, with advanced AV systems able to accurately recognize oncoming cyclists in all weather conditions and adjust accordingly.
This argument has merit, but it conflates safety with access and implicitly assumes that cycling levels in the future will roughly mirror current levels. If cycling were to increase to or exceed the level of some European cities today, the conflict between vehicle and rider would return—not as a matter of safety but priority. Would state and local laws require cyclists to yield to AVs exiting the curb mid-block, or would AVs have to wait for a light cycle change to create a break in the flow of cyclists? Will AVs be able to drop off or pick up anywhere, or will they be clustered in certain designated zones away from heavily patronized bike lanes?
Given the early stage of AV development, these examples remain hypothetical. Yet they demonstrate how the unique capabilities of AVs could give rise to a surface transportation system that is even more hostile to nonautomotive users than the current one. In the absence of a clear intention to value and prioritize nonautomotive users, the past will likely repeat itself with a system dominated by vehicles.
Conclusion: Complete streets, trade-offs, and the meaning of progress
The automobile facilitated enormous economic productivity gains that helped create, along with unionization and other industrial advances, a robust middle class. Nevertheless, it is wrong to view the loss of multiuse roads as either “Darwinian evolution by technological selection”—as Norton suggests—or simply a necessary sacrifice to achieve the economic progress of the 20th century.71 The choice facing planners is not binary—vehicles and progress or pedestrians and poverty. After all, someone who takes a subway or bus to work isn’t less economically productive than someone who chooses to drive. Inclusively designed and managed transportation facilities can safely and efficiently support the needs of all users.
An inclusive approach will necessarily involve trade-offs.72 The political challenge is to advance a definition of transportation progress based on access and not technology. There are two reasons for defining progress in terms of access. First, on a philosophical level, public dollars should not build a system that limits mobility choice and excludes or subordinates certain categories of users. Second, on a practical level, defining progress narrowly as promoting the adoption of the newest technology is to ignore the negative secondary effects of that technology and of vehicle mobility more generally. The exigencies of air quality, limited space, and cost-effectiveness demand a balanced, sustainable transportation system.
Planners should begin developing design and operational strategies that advance complete streets for the autonomous age. These are streets that are safe and accessible to all users, regardless of age or ability level. The first two photos below show a before and after of the same intersection following street improvements intended to better accommodate pedestrians. The third photo shows a street with wide sidewalks, dedicated bike lanes, and clearly marked crosswalks. Similarly, the fourth photo shows robust pedestrian design elements.
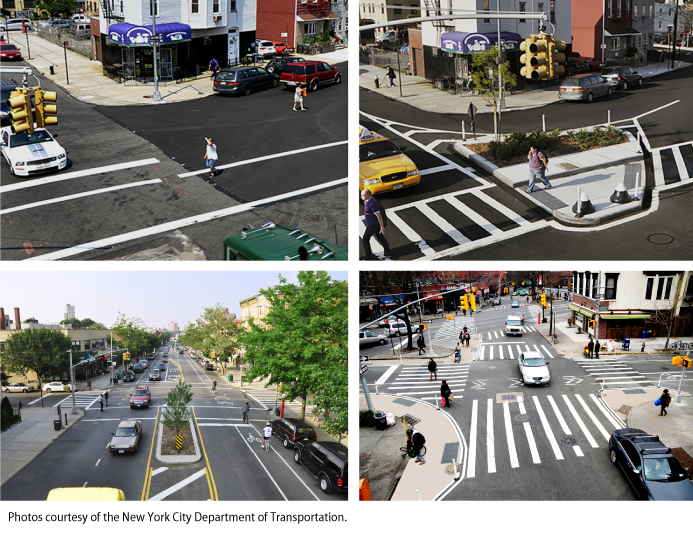 Importantly, the design concepts presented in these photos represent best practices for a transportation system dominated by analog vehicles and human drivers. Over time, planners will find that best practices evolve to reflect the abilities of AVs. Yet what should never change is the space and priority given to nonautomotive users.
Autonomous vehicles have the potential to dramatically reduce serious roadway injuries and fatalities. Whether fully autonomous vehicles arrive in 5 years or 25 years, the choice facing planners is how to allocate and manage limited roadway space. Planners should learn from the mistakes of the past century and design a transportation system that supports all users.
About the author
Kevin DeGood is the director of Infrastructure Policy at the Center for American Progress.