On Friday, the U.S. Bureau of Labor Statistics will release the employment report for the month of December. This is the first report since the Federal Reserve’s Federal Open Market Committee, or FOMC, voted to raise interest rates on December 16. This monthly ritual has recently shed light on two very important but notably clashing forces in discussions on the labor market. The first is that, undoubtedly, the labor market is economically healthier today than at any other point since the Great Recession. The national unemployment rate for the month of November registered at 5 percent, a record low in this recovery and half its peak of 10 percent in October 2009. And, in the past year alone, the labor market has seen robust job growth at an average rate of about 235,000 new jobs per month. The flip side of the coin, however, shows that there is considerable room for growth in the labor market. This recovery has set records, yet the depth of the recession means that the labor market recovery is far from complete by historical standards.
Here’s a quick look at the labor market trends to watch for as we approach the release of the upcoming report.
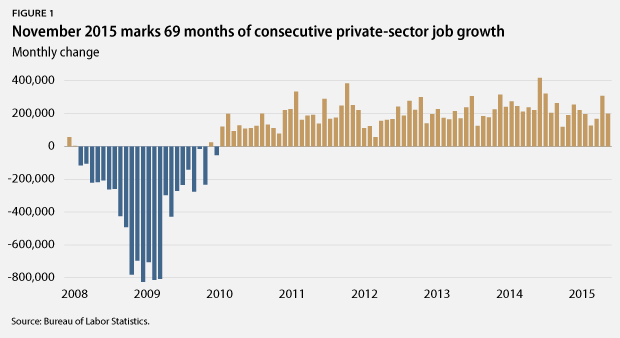
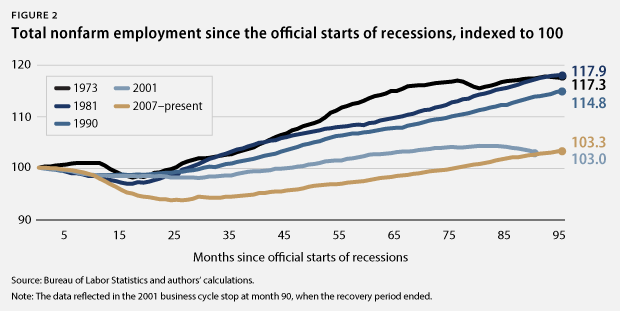
Job growth has picked up, but the depth of the Great Recession means that employment growth since before the recession still lags behind historical standards
There were 12 million more jobs in November 2015 than in June 2009, when the recession officially ended. During this same time period, the private sector added 12.5 million jobs. In November 2015 alone, the private sector added 197,000 jobs to the economy, marking 69 months of consecutive private sector job growth.
Overall, job growth has been particularly robust over the past year, with average growth of about 235,000 jobs per month. However, job growth in this recovery has not been especially robust relative to previous economic expansions. During the economic expansion of the 1990s, for example, the economy added at least 250,000 jobs per month 49 times. During the current expansion, which has now lasted more than half as long, we have seen only 14 months of job growth greater than 250,000, which includes abnormal hiring involved with conducting the decennial census. Meanwhile, at the average rate of recent job growth, The Hamilton Project estimates that we may not reach our former level of employment, when factoring in new labor-force entrants, until as late as mid-2017.* Combined with the extraordinary job losses that the U.S. economy sustained during the recession, the pace of both job and wage growth suggests that there is much more slack in the labor market than the headline unemployment rate may indicate.
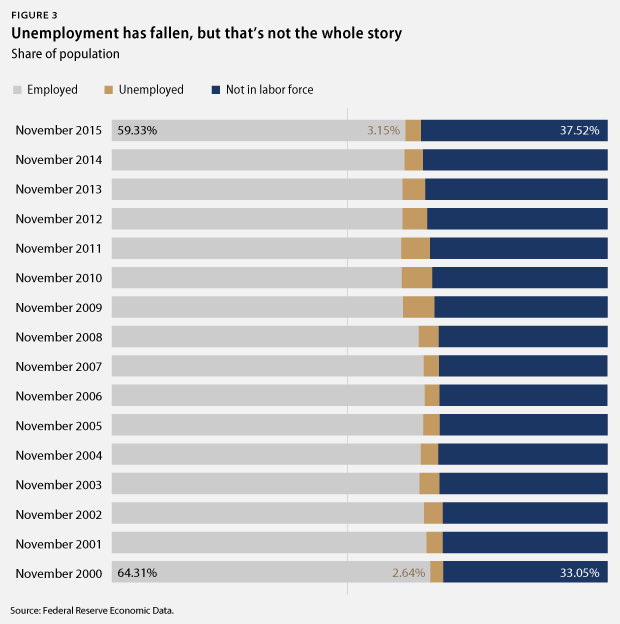
Headline unemployment hits a record low, but other economic measures show room for improvement
November 2015 marked the 15th consecutive month that the headline unemployment rate—otherwise known as U-3—was less than 6 percent, as it stayed flat at October’s 5 percent rate. This is a record low since the end of the Great Recession in June 2009. While this does mark significant progress in the recovery, it is important to remember that there are broader measures of unemployment that paint a clearer picture of the employment situation.
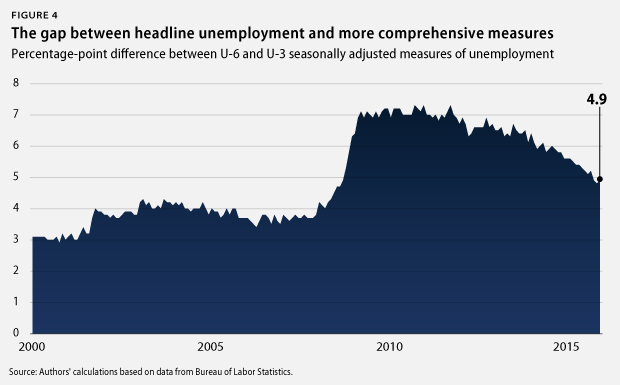
U-3, the typical measure, is pretty restrictive, as it counts the percentage of people who are actively looking for work but cannot find it. U-3 does not, however, capture the millions of people who want jobs but have given up looking or who would like full-time work but cannot find it in this economy. Perhaps the most comprehensive unemployment measure, called U-6, alleviates this problem by including marginally attached workers—those who have recently looked for work but are not currently looking—and those working part time but who would prefer full-time work. U-6 is always higher than U-3, but the gap grew much larger than usual during the recession and has remained above or near prerecession records over the course of the recovery.
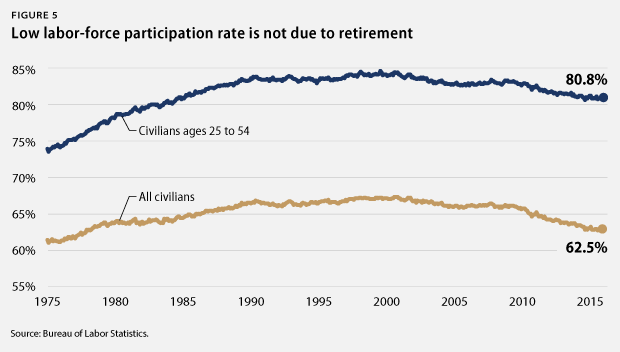
Another important measure is the labor-force participation rate. When the economy is doing well, more people typically enter the labor market because there are more jobs available. So one should expect the labor-force participation rate to be increasing in the aftermath of the recession. However, it hasn’t been. Rather, it has declined steadily since the recession’s end and is as low today as it was in the late 1970s, when women entering the workforce became the norm. Even with the recent economic gains, labor-force participation is still stuck near where it was at the end of 2013.
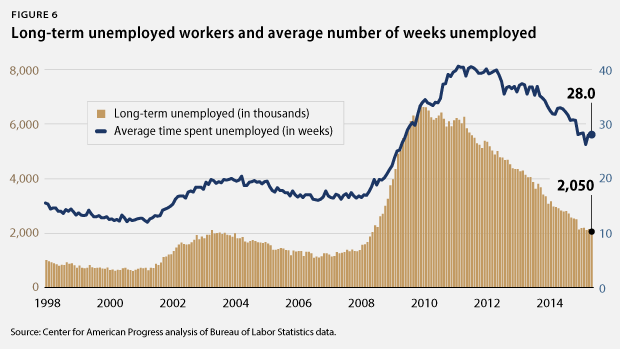
Long-term unemployment is down sharply but still remains high
In November 2015, long-term unemployment was at a record low since the end of the recession, hitting less than one-third of its postrecession peak. Today, while down sharply, the number of long-term unemployed people is still almost as high as its highest prerecession level in 2003. There are still more than 2 million Americans who have been unemployed for more than half a year and are still actively searching for work. 25.7 percent of all unemployed workers fall into this long-term unemployed category. The average length of time someone has spent unemployed is about seven months, well above what it was right before the recession.
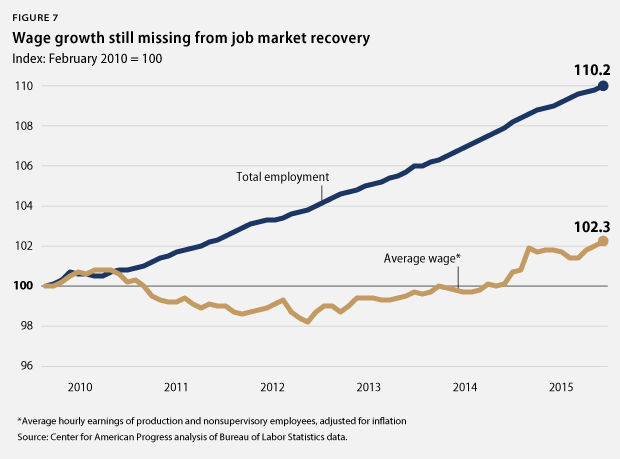
Americans are still waiting for a raise. Due to the slack caused by slow employment growth, real wage growth remains essentially stagnant. As depicted above, the labor market has experienced significant gains in employment in this recovery, but growth remains slow by historical standards. Slow employment growth has caused slack in the labor market, thereby leading to stagnation in real wage growth. Continuing the trend of the past 30 years, while corporate profit growth has been strong, middle-class workers continue to grapple with the challenges of rising costs and slow wage growth.
Conclusion
While meaningful progress has been made since the end of the Great Recession, it is important to remember that many Americans are still suffering from its effects. It’s not exactly a secret that the Great Recession was much deeper than any other recession in recent memory, and slack in this recovery still remains. Identifying the exact cause of the considerable slack in the labor market is a challenge—maybe it’s the underperformance of the housing sector or of Congress—but the slack in the economy is real. Many people who want full-time work are still missing from the labor force or are working fewer hours than they would like. These workers are the key to raising the nation’s potential economic output and future gross domestic product, or GDP. Beyond employment gains, wages had stalled before the recession and they have yet to accelerate in the recovery.
This is the real challenge that the Federal Reserve faces: It’s hard to predict what wage and price growth will do as the economy picks up steam, but so far, workers seem to be slowly coming off the sidelines, raising employment but tempering wage growth. However, this cannot happen forever. Unfortunately, the Fed has already shown it will raise interest rates to fight nonexistent inflation. Given this recent move, markets are understandably concerned about what the Fed will do in 2016. Historically, the Fed tends to increase rates gradually, suggesting that December’s rate increase is a sign of things to come. Yet economic fundamentals suggest that policymakers should wait to increase rates for some time—just as they suggested last month.
* Note: Authors’ calculations are based on data from the Bureau of Labor Statistics and The Hamilton Project’s Jobs Gap tool. See The Hamilton Project, “Closing the Jobs Gap,” available at https://www.hamiltonproject.org/jobs_gap/ (last accessed June 2015). The methodology for the authors’ estimates of labor-force dynamics is detailed in the following source: The Hamilton Project, “Understanding the ‘Jobs Gap’ and What it Says About America’s Evolving Workforce” (2012), available at https://www.hamiltonproject.org/papers/understanding_the_jobs_gap_and_what_it_says_about_americas_evolving_wo/. An explanation of an updated analysis can be found here: The Hamilton Project, “An Update to The Hamilton Project’s Jobs Gap Analysis” (2014), available at https://www.hamiltonproject.org/papers/an_update_to_the_hamilton_projects_jobs_gap_analysis/.
Michael Madowitz is an Economist at the Center for American Progress. Shiv Rawal is a Research Assistant for Housing Policy at the Center. Danielle Corley is a Special Assistant for the Economic Policy team at the Center.