Economic revival and job growth continue at a moderate pace in the fourth year of the recovery from the Great Recession of 2007–2009. The economy and the labor market are being held back in part by the uncertainty over what will happen to the federal government’s debt ceiling—the amount the federal government can borrow without Congress’s approval—and to the already-enacted automatic spending cuts now set to begin in March 2013.
The fact that the economy is still growing amid this uncertainty shows the tremendous resilience of the recovery created by the smart, targeted economic policies of the past few years. The resolution of the fiscal showdown, which prevented the onset of massive tax increases and spending cuts on January 1 and 2 of this year continued this approach at least in part by extending long-term unemployment insurance benefits. More needs to be done, however, as the federal government approaches the debt ceiling in February and as already-enacted automatic cuts to defense and nondefense programs are set to start on March 1, 2013, unless Congress enacts new legislation to ease the fiscal burden on the economy.
There is hope for the economy and the labor market. Policymakers have already resolved part of the fiscal dilemma by avoiding the immediate onslaught of tax increases and spending cuts in early January 2013. Another resolution to the remaining fiscal issues—the debt ceiling and spending cuts—will likely boost growth and job creation by creating economic certainty for businesses and consumers, particularly if done quickly.
1. Economic growth remains positive. Gross domestic product grew at an annual rate of 3.1 percent in the third quarter of 2012. Government spending grew by 3.9 percent due to a boost in defense spending, but consumption grew by only 1.6 percent, and exports expanded by only 1.9 percent. Business investment actually fell by 1.8 percent in the third quarter of 2012. Slowing growth overseas led to slower export growth in the United States, as well. Less domestic consumption and declining investments are due in part to the economic uncertainty created by the fiscal showdown. Policymakers can help strengthen the recovery by quickly removing the remaining fiscal uncertainty over the debt ceiling and the spending cuts in a balanced fashion.
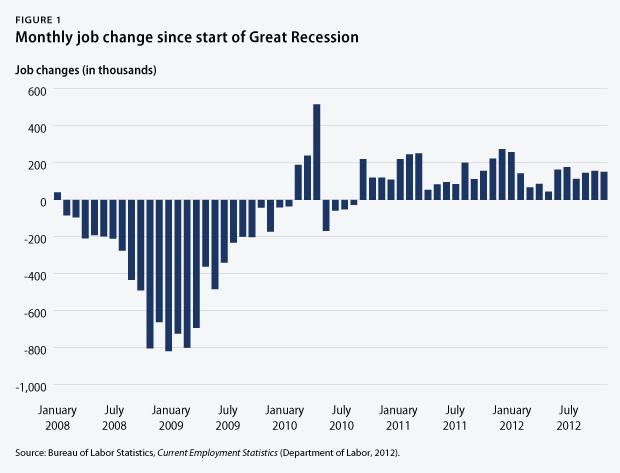
2. The moderate labor market recovery continues in its fourth year. There were 3.5 million more jobs in December 2012 than in June 2009, when the economic recovery officially started. The private sector added 4.2 million jobs during this period. The difference between the net gain and private-sector gain is explained by the loss of nearly 625,000 state and local government jobs in this period, as budget cuts reduced the number of teachers, bus drivers, firefighters, and police officers, among others. Job creation is a top policy priority since private-sector job growth is still too weak to quickly overcome other job losses and rapidly lower the unemployment rate. Once again, removing the uncertainty over fiscal changes is a key step toward strengthening economic and job growth.

3. Suffering of the unemployed stays high. The unemployment rate stood at 7.8 percent in December 2012, matching its lowest level since January 2009. But even with the drop in overall unemployment, long-term unemployment—defined as those out of work and looking for a job for more than six months—remained high. In December 2012, 39.1 percent of the unemployed were considered long-term unemployed, the lowest share since October 2009. The average length of unemployment also dropped in December 2012, falling to a still-comparatively-high 38.1 weeks, the lowest level since February 2011. Those out of a job for a long time struggle to regain employment because their skills atrophy and re-entry into a new job becomes increasingly harder. The continuation of extended unemployment insurance benefits as part of the resolution to the fiscal showdown on January 1, 2013, was thus a welcome policy measure that helped many of those most vulnerable to economic shocks.
4. Labor-market troubles fall, especially for communities of color, young workers, and those with less education. The African American unemployment rate in December 2012 was a high 14 percent; the Hispanic unemployment rate was 9.6 percent; and the white unemployment rate was 6.9 percent. Youth unemployment stood at a high 23.5 percent. The unemployment rate for people without a high school diploma stayed high at 11.7 percent, compared to 8 percent for those with a high school degree, 6.9 percent for those with some college education, and 3.9 percent for those with a college degree. Population groups that typically have low incomes and little wealth have struggled disproportionately more amid the weak labor market than white workers, older workers, and workers with more education, creating greater need for progressive policy actions to strengthen job creation for everybody.
5. Household incomes continue to drop amid prolonged labor market weaknesses. Median inflation-adjusted household income—half of all households have more, and the other half has less—stood at $50,054 in 2011, its lowest level in inflation-adjusted dollars since 1995. Median income fell by 1.5 percent in 2011, dropping for the fourth year in a row. American families experienced no income gains during the current economic recovery after 2009, exacerbating the losses that occurred during the Great Recession.
6. Income inequality on the rise. Households at the 95th percentile, with incomes of $186,000 in 2011, had incomes that were more than nine times—9.2 times, to be exact—the incomes of households at the 20th percentile, whose incomes were $20,262. This is the largest gap between the top 5 percent and the bottom 20 percent of households since the U.S. Census Bureau started keeping records in 1967.
7. Poverty stays high. The poverty rate fell to 15 percent in 2011, down from 15.1 percent in 2010. The African American poverty rate was 27.6 percent, the Hispanic rate was 25.3 percent, and the white rate was 9.8 percent. The poverty rate for children under the age of 18 stood at 21.9 percent. More than one-third of African American children—38.8 percent—lived in poverty in 2011, compared to 34.1 percent of Hispanic children and 12.5 percent of white children. The prolonged economic slump, following an exceptionally weak labor market before the crisis, has taken a massive toll on the most vulnerable.
8. Employer-sponsored benefits disappear. The share of people with employer-sponsored health insurance dropped from 59.8 percent in 2007 to 55.1 percent in 2011. The share of private-sector workers who participated in a retirement plan at work fell to 39.2 percent in 2011, down from 42 percent in 2007. Families have less economic security than in the past due to fewer employment-based benefits, requiring more private savings to make up the difference.
9. Family wealth losses linger. Total family wealth is down $9.1 trillion (in 2012 dollars) from March 2007—its last peak—to September 2012. Homeowners on average own only 44.8 percent of their homes, compared to the long-term average of 61 percent before the Great Recession, with the rest owed to banks. Homeowners still have a lot of debt. This slows consumption growth, as households still do not have a lot of collateral for banks to loosen their lending standards.
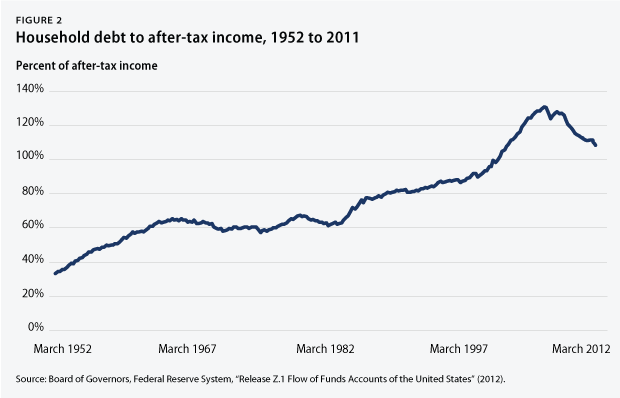
10. Household debt is still high. Household debt equaled 107.7 percent of after-tax income in September 2012, down from a peak of 126 percent in March 2007. The unprecedented fall in debt over the past few years has resulted from tight lending standards, falling interest rates, massive foreclosures, and increased household saving. But further deleveraging will likely slow unless incomes rise faster than they have in the past. Most factors that helped to reduce household debt in the past have slowed or disappeared. This high debt could continue to slow economic growth, as households focus on saving rather than on spending more.

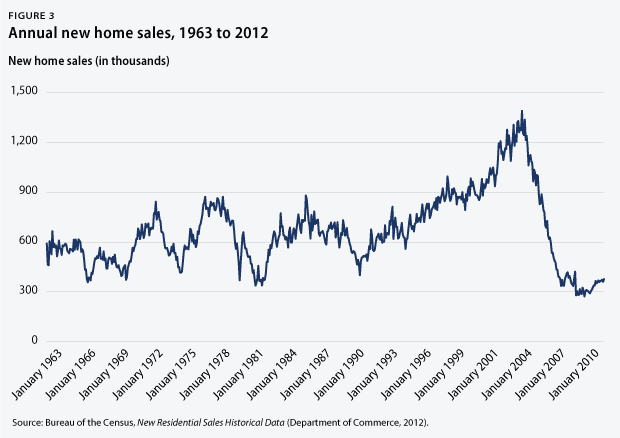
11. The housing market is finally and slowly recovering from historic lows. New home sales amounted to an annual rate of 377,000 in November 2012, a 15.3 percent increase over the 327,000 homes sold in November 2011, but well below the historical average of 698,000 before the Great Recession. The median new house price in November 2012 was 14.9 percent higher than one year earlier. Existing home sales were up by 14.5 percent in November 2012 from one year earlier, and the median price for existing homes was up by 10.1 percent during the same period. The housing market has a lot of room to grow and to contribute to economic growth because the recovery in the spring of 2012 started from historically low home sales, and the housing market fell throughout most of the recovery. The fledgling housing recovery, however, could be derailed by greater economic uncertainty, especially over future interest rates, if Congress fails to quickly and unconditionally raise the debt ceiling.

12. Homeowners’ distress remains high. Even though mortgage troubles have gradually eased since March 2010, one in nine mortgages is still delinquent or in foreclosure. In the third quarter of 2012, the share of mortgages that were delinquent was 7.4 percent, and the share of mortgages that were in foreclosure was 4.1 percent. Many families delayed and defaulted on mortgage payments amid high unemployment and massive wealth losses. This caused some banks to be nervous about extending new mortgages, which further prolonged the economic slump. Policymakers could accelerate economic growth by helping households lower their debt burdens through refinancing help and debt forgiveness.
13. Near precrisis peak profits are not reflected in investment data. Inflation-adjusted corporate profits were 87.7 percent larger in September 2012 than in June 2009, when the economic recovery started. The after-tax corporate profit rate—profits to total assets—stood at 3.1 percent in September 2012, nearing the previous peak after-tax profit rate of 3.2 percent that occurred prior to the Great Recession. Corporations used their resources for purposes other than investments in plants and equipment. The share of investment out of GDP stayed low, with 10.2 percent in the third quarter of 2012, compared to an average of 10.9 percent during the prior business cycle from March 2001 to December 2007.
Christian E. Weller is a Senior Fellow at the Center for American Progress and a professor in the Department of Public Policy and Public Affairs at the University of Massachusetts Boston.