See also
Introduction and summary
U.S. surface transportation policy is premised on federal aid to states. Apart from a few discretionary grant programs controlled by the U.S. secretary of transportation, the federal government distributes most surface transportation funding to states each year, leaving system planning and project selection decisions to state departments of transportation. This federal aid structure matters because the Infrastructure Investment and Jobs Act (IIJA)—also known as the bipartisan infrastructure law—will provide states with more than $300 billion in highway funding over the next five years.1 The choices that states make with these funds will substantially determine the degree to which the bill advances the Biden administration’s climate, equity, and inclusive growth goals.
![]()
Unfortunately, many states have constitutional provisions, laws, and rules that either favor or require state and federal transportation funds to be spent on highway construction—including highway expansion—that deepens expensive auto dependence, increases greenhouse gas (GHG) and Clean Air Act criteria pollution emissions, and creates barriers to economic opportunity.2 State constitutional provisions, laws, and rules that lock in highway spending can hamper progressive governors from implementing their vision for inclusive growth. They can also effectively penalize metropolitan regions that try to advance progressive infrastructure programs focused on robust transit, active transportation—including biking and walking—and sustainable land use.
This report uses the recently adopted long-range transportation plan for the Durham-Chapel Hill-Carrboro (DCHC) and Capital Area (CAMPO) metropolitan areas—known as Connect 2050—and the state of North Carolina’s Strategic Transportation Investments (STI) law as a case study to demonstrate how state laws and rules can constrain local attempts at progressive reform. In addition to the DCHC/CAMPO long-range plan, the report looks at the North Carolina Department of Transportation’s (NCDOT’s) long-range plan and Executive Order 246: North Carolina’s Transformation to a Clean, Equitable Economy, which was recently signed by Gov. Roy Cooper (D), to show how the STI law impedes progressive executive action as well.3
The STI law controls how the NCDOT spends most state and federal surface transportation funds. The STI law and its implementing rules determine how candidate projects are scored and prioritized throughout the state, channeling roughly 94 percent of all transportation funds to highway projects with a heavy focus on construction and expansion—especially of larger highway facilities.4
State mandates for highway and roadway expenditures
According to the American Association of State Highways and Transportation Officials, 27 states have either a constitutional provision or a law that restricts the use of fuel tax revenues to road and highway projects.5 For instance, Article 9 of Arizona’s constitution prohibits spending license, registration, or fuel taxes on anything “other than highway and street purposes.”6 Similarly, Article 11 of South Dakota’s constitution states that all license, vehicle registration, and motor fuel taxes “shall be used exclusively for the maintenance, construction and supervision of highways and bridges of this state.”7 Amendment 91 to Arkansas’ constitution requires a dedicated portion of state sales taxes go toward “state’s four-lane highway system, county roads, and city streets.”8
The STI law and its implementation rules act as a strong disincentive for metropolitan areas within North Carolina to adopt progressive transportation plans. The reason is simple: Adopting a metropolitan transportation plan that focuses on projects that provide a safe, affordable, and convenient alternatives to driving means likely losing out on state and federal transportation dollars. Because the STI law is not mode-neutral, when a metropolitan planning organization (MPO) chooses to prioritize nonhighway projects, it means that dollars exclusively reserved for highways are sent to other metropolitan areas. This is especially problematic because most of the federal transportation funding from the IIJA will be subject to the STI law, locking North Carolina into a business-as-usual investment pattern.
The state should amend the STI law to prioritize transportation projects that provide the greatest social, economic, and environmental return on investment regardless of mode.
The state should amend the STI law to prioritize transportation projects that provide the greatest social, economic, and environmental return on investment regardless of mode. This means that North Carolina should adopt a new project scoring process that evaluates projects based on criteria that flow from statewide goals, including climate mitigation and adaptation, safety, affordability, equity, and improved access to employment and essential services. The report concludes by offering alternative project selection criteria that align with these goals. Under a reformed STI system, projects would be evaluated based on their ability to reduce household transportation costs; reduce GHG emissions, Clean Air Act criteria pollutants, and vehicle miles traveled; increase the share of trips on transit or by biking and walking; and increase access to employment, education, and essential services for historically underserved communities, among others.
In the absence of STI reform, metropolitan regions such as Durham as well as future North Carolina governors will be significantly constrained in their ability to advance a more sustainable and inclusive transportation system. Continuing with STI in its current form will lock in decades of more auto dependence, climate emissions, and an imbalanced transportation system overly focused on moving more and more cars and trucks.
History of federal support for surface transportation
The roots of the federal aid structure date back to the Post Office Department Appropriations Act of 1913.9 The act appropriated a modest $500,000 to improve “the conditions of roads to be selected by [the U.S. secretary of agriculture and postmaster general] over which rural delivery is or may hereafter be established.”10 The attempt at roadway construction administration in Washington, D.C., did not go well. According to the Federal Highway Administration, the appropriation resulted in only “17 post road projects totaling 457 miles in 13 States.”11 Congress learned from the experience, and the Rural Post Road Act of 1916 stated that “the Secretary of Agriculture is authorized to cooperate with the States, through their respective State highway departments, in the construction of rural post roads.”12
Federal support for highway construction and maintenance remained modest for the next several decades. The Federal-Aid Highway Act of 1944 required states to plan for a 40,000-mile national network of interstate highways:
There shall be designated within the continental United States a National System of Interstate Highways not exceeding forty thousand miles in total extent so located as to connect … the principal metropolitan areas, cities, and industrial centers, to serve the national defense.13
As with earlier legislation, Congress reaffirmed that states should take the lead in choosing the location, size, and other essential highway design elements. With system plans in place, the Federal-Aid Highway Act of 1956 kicked off the interstate construction era, delivering billions of dollars to states.14
The more than $300 billion in highway funding that IIJA will deliver to state departments of transportation follows this basic federal aid structure. Federal highway funds come with few limitations or requirements, leaving states with nearly unlimited discretion over what to build. In fact, Section 145 of Title 23 of the U.S. Code clearly lays out state sovereignty in making project selections:
The authorization of the appropriation of Federal funds or their availability for expenditure under this chapter shall in no way infringe on the sovereign rights of the States to determine which projects shall be federally financed. The provisions of this chapter provide for a federally assisted State program.15
To understand how North Carolina will spend both state funds and the IIJA windfall, it is important to look at NCDOT’s long-range plan in combination with the STI law.
North Carolina Strategic Transportation Investments law
In 2013, North Carolina enacted General Statute 136.189.10 and .11—a Strategic Prioritization Funding Plan for Transportation Investments, the STI law.16 The purpose of the STI law was to establish a data-driven, transparent, and uniform process for assessing and prioritizing competing transportation projects from around the state.17 It is the foundation for a process of assessing and scoring potential transportation projects that is known by the acronym SPOT. The state is preparing for its sixth project submission and scoring cycle. MPOs anticipate submitting projects for scoring in late summer of 2023. The projects that score highly in this SPOT round will form the state’s 2024–2033 Statewide Transportation Improvement Program, which is the NCDOT’s official transportation project list and workplan.
The STI scoring system suffers from two substantial design flaws. First, STI and its implementing rules set minimum funding allocations for each transportation mode. According to NCDOT:
The non-highway minimum floor has remained 4% and highway 90% over multiple prioritization cycles. The remaining 6% is a direct competition between both highway and non-highway modes.18
And while nonhighway projects have done well compared with highway projects, the end result is that NCDOT overwhelmingly funds highway projects. Since 2018, 94 percent of all funding subject to STI has flowed to highway projects with an emphasis on construction and expansion.19 For fiscal year 2021–2022, maintenance projects accounted for only 28 percent of NCDOT’s budget.20 The STI law will ensure that NCDOT continues to build a transportation system focused on moving more and more cars and trucks for decades to come with only a handful of funds set aside for alternatives to auto mobility.
The STI law groups projects into three categories: statewide strategic mobility (40 percent of funds), regional impact (30 percent of funds), and division needs (30 percent of funds).21 Statewide mobility project funds may only support highway projects, freight rail projects for Class I railroads, and small amount for airports with more than 375,000 annual enplanements. Public transportation, passenger rail, ferry, and bike and pedestrian projects are ineligible. The problem with this approach to major mobility projects is that the STI law has already determined the mode before scoring candidate projects. It could be that a major passenger or commuter rail project would provide better mobility and economic growth than a highway alternative, but transit is simply ineligible within this category.
Table 1
Second, the STI scoring process double and triple counts certain project benefits, pushing highway funding toward highway expansion—especially of larger highway facilities. STI scores projects within the statewide mobility category based on nine project criteria. These include: benefit cost; congestion; safety; economic competitiveness; freight; multimodal; pavement condition; lane width; and shoulder width.
For mobility projects—which include a broad range of project types such as highway widenings, new roadway construction, and intersection improvements, among others—the STI scoring process looks at five of the nine criteria. The subset of five criteria include: congestion (30 percent); benefit-cost (25 percent); freight (25 percent); economic competitiveness (10 percent); and safety (10 percent). Each criteria score for a candidate project is based on one or more analytical measures. Importantly, expected congestion reduction shows up in the analytical measures for three of the categories: congestion, benefit-cost, and economic competitiveness. In addition, facility size is double counted.
Congestion
According to a NCDOT guidance document, a project’s congestion score is based on two measures: a volume-to-capacity (V/C) ratio—which measures the number of vehicles on a roadway segment as a ratio of roadway capacity—and overall vehicle volume (V). As a highway becomes more congested, the volume of vehicles approaches or even exceeds the design capacity of the roadway (i.e., the ratio can exceed 1.0). According to STI, the higher the V/C ratio, the higher the score. This measure is intended to direct dollars to those highways with high levels of congestion. The larger the highway expansion, the more the V/C ratio is expected to fall (i.e., congestion improves).
The V measure is intended to direct dollars to larger highway facilities as opposed to smaller ones. Including a measure for volume may seem redundant because V/C already contains volume in the numerator, but the V measure ensures that the STI scoring framework effectively captures facility size. After all, a small two-lane rural highway could have a high V/C ratio—meaning it is congested—but overall carry fewer vehicles than an eight-lane interstate segment, which might have a slightly lower V/C ratio but carry many thousands more vehicles each day. Thus, NCDOT designed the congestion category measures to efficiently direct statewide mobility funds to highways that are both large and congested.
Benefit-cost
The next project category is benefit-cost (B/C). Highway projects vary dramatically in terms of their total cost. A B/C measure allows NCDOT to compare projects of different sizes based on their relative benefits rather than total cost. This category consists of two measures: a B/C ratio that looks at project benefits relative to the cost to NCDOT and a second ratio that looks at the local funding contribution as a ratio to the total project cost.
The first B/C measure adds together the monetized value of anticipated travel time savings (TTS) for drivers during the first 10 years of operation and reduced injuries and fatalities over the same period. Total monetized benefits are expressed as a ratio to the cost to NCDOT for the project. The larger the ratio, the larger the benefit of the project relative to its cost. The second ratio looks at the local financial contribution relative to the total project cost. The higher the ratio, the higher the score. This is intended to reward project submissions that include a substantial local funding commitment, which lowers the state’s financial obligation and improves the B/C ratio from the state’s perspective.
In the short run, additional highway capacity reduces vehicle delay and generates TTS. The problem is that the monetized value of TTS is already effectively captured by the V/C ratio within the congestion measure. This makes the monetized travel time savings redundant. However, that is not the only shortcoming of the B/C measure. Congestion benefits tend to be short-lived. Over the medium term, the combination of induced demand and population growth pushes up vehicle volumes, reducing vehicle speeds and causing delays. But the measure avoids dealing with this complexity by only looking at the first 10 years of operations following project completion.
Economic competitiveness
The economic competitiveness category attempts to capture the economic benefits of highway projects. The category includes two measures: the change/increase in statewide economic production and the change/increase in total long-term employment. The data for this category come from an economic production estimating software known as TREDIS. The full set of calculations that generate TREDIS outputs are proprietary. However, according to the firm, the model “translates changes in traffic volumes, vehicle occupancy, speed, distance, reliability, and safety into travel efficiency changes and direct cost savings for household and business travel.”22
Depending on the project, a highway investment can increase travel times (TTS), reduce travel distance (TTS), and reduce vehicle operating costs while improving system reliability (TTS). The theory behind the model is that lowering transportation costs by reducing maintenance and increasing TTS encourages firms to relocate or expand their production, boosting statewide economic output and long-term employment. Given these factors, the TREDIS model—like V/C and B/C—captures the short-term congestion benefits from highway expansion projects.
Freight
The STI scoring process effectively double counts facility size by including multiple measures that are strongly correlated with facility size. This has the effect of pushing transportation funds to larger facilities, including interstates and other principal arterial highways. The freight criteria have two measures: freight truck volume and freight truck percentage. Projects with a higher volume and share of freight trucks receive more points. Additionally, the freight criteria award points if the project involves the completion of a future interstate segment.
According to data from the Federal Highway Administration, both single-unit trucks (i.e., those with only two axles) and combination trucks (i.e., those with at least one trailer, also referred to as semitrucks) travel a high percentage of their journey on arterial highways, including interstate highways.23 Yet, the congestion criteria already include the V measure, which is strongly correlated with facility size. Larger highways have a high volume of vehicles overall as well as a high volume and percentage of trucks. By double counting facility size, STI prioritizes larger highway construction and expansion projects.
Safety
Finally, the STI scoring process double counts safety benefits. For highway projects, STI has two different sets of measures—one for safety improvements to a highway segment and another for safety improvements at an intersection. For highway segments, STI looks at crash density (reported crashes per mile), crash severity, critical crash rate (a complex formula “to identify locations where crash rates are higher than should be expected for a given facility”), and monetized safety benefits over the first 10 years of operations following project completion.24 For intersections, STI looks at crash frequency and severity as well as the first 10 years of safety benefits.
The safety measures for both highway segments and intersections include the monetized safety benefits from the first 10 years of facility operations following project completion. Yet, this monetized benefit is already captured within the first B/C ratio in the benefit-cost criteria, resulting in double counting.
Triple counting congestion benefits and double counting facility size matter because these measures skew the types of projects that will score highly under the STI framework. For instance, imagine that two separate MPOs each submit a project for scoring. The first project is an expansion of a congested state highway from four lanes to six. In the short run, the additional highway capacity will improve the V/C ratio, generate TTS, and improve economic competitiveness through time savings and better system reliability. Under STI, these congestion benefits count within three separate criteria: congestion, benefit-cost, and economic competitiveness. Additionally, the expanded facility would have a substantial overall V measure under the congestion criteria as well as a strong freight volume and freight percentage under the freight criteria.
The second project is a redesign of an urban, signalized arterial to improve affordable and safe multimodal access. The project involves converting the curb lane to a bus-only lane, building new dedicated bike lanes and sidewalk improvements, and installing intersection signal prioritization for transit buses. The project is located within an urban area with dense commercial and residential uses, precluding the possibility of roadway expansion. As a result, the MPO has designed a project to boost the productivity of the roadway by increasing the person throughput. Instead of trying to move more vehicles, the project is designed to move more people with safe and affordable public transportation, biking, and walking.
Under STI, a highway project defined as multimodal can earn points for its proximity to other modes. Of the 13 possible multimodal points, nine of them are about proximity. For instance, a multimodal highway project can earn one point for being located within 1 mile of an Amtrak station. It can earn a point for being located within 1 mile of a park-and-ride lot or a ferry terminal, among other locations. A multimodal project can also earn one point for each of the following: the presence of bike and pedestrian facilities, transit signal prioritization, rail-highway grade separation, and running a bus on a highway shoulder. Assuming the candidate project is not located within 1 mile of anything that would generate points, the urban corridor project can only earn two multimodal points—one for transit signal prioritization and another for bike and pedestrian facilities. Compared with the triple counting of congestion benefits and double counting of facility size, it is easy to see why it can be difficult for multimodal projects to outcompete traditional highway projects.
Durham long-range plan
A metropolitan planning organization is a public agency that is responsible for developing a long-range transportation plan for the entire metropolitan region as well as short-term project implementation lists known as transportation improvement programs in every urbanized area with 50,000 or more residents.25 According to the U.S. Department of Transportation, there are 420 MPOs in the United States.26
The Raleigh-Durham area is served by two MPOs: the Capital Area Metropolitan Planning Organization and the Durham-Chapel Hill-Carrboro Metropolitan Planning Organization. These two MPOs jointly publish a unified long-range plan. The most recent version of the long-range plan is known as Connect 2050. This report will focus on the planning choices made by DCHC.
According to Connect 2050, the DCHC region is expected to add an additional 200,000 residents by 2050, which represents an increase of 42 percent or a compound annual growth rate of 1.2 percent.27 The plan notes that “[t]he Triangle Region is expected to accommodate substantial future growth … we need to plan for the region we will become, not just the region we are today.”28 This line touches on an essential concept in transportation planning: The future is not fixed, and the investment choices that regions—and states—make will determine the future of land use, growth, and mobility for decades.
In the plan, DCHC lays out a series of progressive mobility, land use, and public health goals. These include building a transportation system that meets the needs of “all populations, especially the aging and youth, economically disadvantaged, mobility impaired, and minorities.” Additionally, the plan calls for expanding affordable and multimodal transportation choice; reducing mobile GHG emissions and energy consumption from transportation; increasing safety; and promoting “public health through transport choices” such as safe and accessible bike and pedestrian facilities.
These are excellent and worthwhile goals for DCHC to pursue. The challenge is aligning actual project investments with high-level progressive goals: “A key challenge for our transportation plans is to match our vision for how our communities should grow with the transportation investments to support this growth.”29
For decades, the Raleigh-Durham area has grown rapidly by mostly expanding outward: “[T]he Triangle is a sprawling region and projections are for continued outward growth.”30 In the past 30 years, NCDOT and local governments have collectively spent more than $2.8 billion on major highway projects.31 This has resulted in significant greenfield land consumption for commercial and residential development, increasing congestion. Since the early 1980s, annual hours of delay for auto commuters have increased by 500 percent from roughly eight hours per year to 40 in 2019.32 The report notes that the Triangle area—like other regions with rapid population and job growth—cannot build its way out of congestion with mega highway projects.
DCHC has taken the bold step to better align its project list with its stated goals by eliminating a number of highway-widening projects. Specifically, DCHC deleted 19 highway projects from its long-range plan, totaling more than $500 million that would have added 51 lane miles of new or expanded roadways.33 Even if DCHC had decided to keep these projects in the long-rang plan, there is no guarantee that they would all score highly enough to receive state funding. However, the exact prioritization rank of these candidate projects is less important than the structure of the STI law and the disincentive it creates for other regions within the state to emulate DCHC’s choice.
The STI law sets expenditure minimums by mode, ensuring that roughly 95 percent of all funds subject to STI flow to highway projects. In short, STI does not allow metropolitan regions attempting to build a more balanced and multimodal transportation system to swap out highway dollars for transit dollars on a one-to-one basis. By removing candidate highway projects from its plan, DCHC risks that dollars that would have flowed to the region for highway construction and expansion will instead be directed to another region within the state.
North Carolina’s long-range plan
In February of 2021, the NCDOT released a new long-range transportation plan called NC Moves 2050.34 A careful read of the plan reveals a significant mismatch between the vision for the future of mobility in North Carolina and the projects that will receive funding as a result of the STI scoring and prioritization process.
According to the plan, the top objective of transportation investments over the next 30 years is to provide transportation access for all residents and to “[i]mprove quality of life and multimodal access to regional jobs and services.”35 The key word in the objective is “multimodal,” yet the STI process ensures that approximately 94 percent of transportation expenditures will flow to highway projects.36 In 2017, the most recent budget year profiled in the plan, just 28.3 percent of transportation expenditures went to maintenance projects, while 48.5 percent went to construction, which covers building or expanding highways and major roadways. The remaining 23.2 percent went to debt service with much of the debt originally issued to support highway construction projects.37 The budgetary data show a system heavily skewed toward building new over repairing old facilities and to favoring highways over other modes.
Predictably, residents of North Carolina drive a lot and will soon surpass the national average. According to NCDOT, “[v]ehicles miles traveled (VMT) in North Carolina is projected to surpass the U.S. average and reach 130 billion by 2025 and 183 billion by 2050.”38 This stark projection runs counter to the expressed desires of state residents. NCDOT conducted extensive public outreach during the planning process and found that “[t]oday most people travel by car, but in the future, there is a desire for more multimodal travel, with a greater number of people selecting modes other than car.”39 After asking residents about their preferences for the future, the state found that “[t]he importance of traveling by car in the future decreases by 51%” compared with the present.40
NCDOT conducted an analysis of more than 300 comments from residents and found that when thinking about the big picture of mobility—as opposed to specific projects or corridors—they overwhelmingly focused on options other than driving. Specifically, 60 percent of comments were about a desire for more public transit, passenger rail, biking and walking, and improvements to the environment, while only 11 percent were about roadway congestion.41
The long-range plan states clearly the importance of transit: “For many citizens, transit services mean the difference between being stuck in one place and getting to education, jobs, medical appointments and other needs.”42 This is especially the case for the 6.3 percent of households—about 254,000—without an automobile.43 Moreover, large portions of the state are aging rapidly. According to the state, in 76 of the 100 counties, the number of residents older than the age of 60 is greater than the number of residents younger than 18.44 This creates mobility and transportation affordability challenges that are not well addressed by a transportation system geared to support driving and private vehicle ownership.
The effective cap on multimodal project spending created by STI presents a significant barrier to building the balanced, safe, and affordable transportation system that residents clearly want. Again, the long-range plan states the challenges clearly when it comes to nonmotorized alternatives to driving. “Retrofitting North Carolina communities and roadways to include biking and walking facilities can be challenging and costly.”45 Moreover, “Many North Carolina communities built between the 1940s and the 1990s, especially suburbs, were built without bicycle and pedestrian infrastructure, leaving large gaps in bicycle and pedestrian networks.”46 Unfortunately, “Relative to the full NCDOT budget, bicycle and pedestrian transportation receives very little dedicated funding.”47 This is especially problematic for nonmetropolitan areas, which also tend to have older residents. “Rural communities lack the resources and funding to improve their communities for walking and bicycling on their own.”48
Finally, while NC Moves 2050 does not include reducing GHG emissions as an explicit goal, it does note the major challenges facing the state unleashed by climate change. “Sea level is projected to rise over the next 100 years. A moderate global sea level rise scenario suggests sea level along the North Carolina coast could increase by 4 to 5 feet.”49 Climate change will also bring about more acute and dangerous storms, causing damage and destruction to state transportation facilities. “It is likely there will be an increase in major hurricanes with higher amounts of rainfall.”50
NCDOT engaged in years of careful planning and community outreach to develop NC Moves 2050. The resulting product is a serious attempt to address the needs of residents in a sustainable and equitable way while supporting robust economic growth. However, the STI law effectively binds the hands of state officials due to its scoring and prioritization process, ensuring a gulf between those investments desired by citizens and what will be built over the next three decades.
Gov. Roy Cooper’s executive order on climate change
The current STI also hampers the policy goals of the governor. On January 7, 2022, Gov. Cooper signed Executive Order 246: North Carolina’s Transformation to a Clean, Equitable Economy.51 The order sets out multiple aggressive climate and equity goals, including requiring state agencies to undertake actions to “[r]educe statewide GHG emissions to at least 50 percent below 2005 levels by 2030 and achieve net-zero emissions as soon as possible, no later than 2050.”52 Additionally, Executive Order 246 requires North Carolina state agencies to “incorporate environmental justice and equity considerations and benefits in the implementation of this Executive Order.”53
Yet, the state’s STI law and its prioritization of highway projects—especially expansion—will substantially inhibit the accomplishment of these urgent, progressive goals. The principal reason is that the STI scoring process does not award points for many of the outcomes listed by Executive Order 246. The order states that cabinet agencies must invest federal and state transportation funds “consistent with applicable law” to “reduce GHG emissions and air pollution, promote resiliency, invest in historically underserved communities, increase affordability for low- and moderate-income households, advance health equity, and create jobs and economic growth through a clean North Carolina economy.”54
The “applicable law” for surface transportation is the STI law and its implementing rules, which direct 94 percent of funds to highway projects. These investments are intended to increase vehicle throughput by constructing and expanding signalized and controlled-access arterial highways. Depending on the project type, STI awards points to candidate highway projects based on factors such as lane width, congestion severity, travel time savings, commercial truck volumes, and crash rates, among others.55 Excluded from the scoring system are considerations for climate emissions, Clean Air Act criteria pollutants, resiliency, redressing underinvestment in historically disadvantaged areas, and reducing household transportation costs. In fact, the highway-centric approach to transportation locks residents into expensive vehicle ownership.
Additionally, Executive Order 246 directs the NCDOT to develop a clean transportation plan. The plan must include actionable strategies to reduce driving; expand equitable access to clean mobility options such as electric scooters and bicycles; and increase access to nonvehicle transportation modes, including transit, passenger rail, biking, and walking. Again, the limited pool of dollars set aside for nonhighway projects makes it difficult to provide safe and affordable mobility alternatives to driving. In fact, NCDOT is prohibited from using state transportation funds on independent bicycle and pedestrian projects.56 Only certain federal funds may be used for these projects, and they are scored within the division needs category.57
The STI law and its prioritization of highway projects undermines another aspect of Executive Order 246: carbon sequestration. Achieving the goal of statewide net-zero GHG emissions by 2050 will rely on preserving and even expanding the carbon sequestration provided by natural carbon sinks such as undeveloped forest lands, which the state calls “above ground biomass.”58 According to the most recent carbon emissions inventory by the North Carolina Department of Environmental Quality, “In 2018, net carbon sinks offset North Carolina’s GHG emissions by an estimated 42.1 [million metric tons of carbon dioxide equivalents], which is about 26% of the State’s gross emissions in that year.”59
The loss of pristine land serving as carbon sinks to exurban development in North Carolina is not a theoretical challenge. For instance, according to federal government data on land use, from 2001 to 2019, the total developed area of the Raleigh-Durham metropolitan area increased by 35.2 percent.60 This translates to an average annual growth rate of 2 percent.61 If this rate of growth were to continue, developed land within the metro area would increase by an additional 50 percent from 2022 to 2050.62
![The map shows that between 2001 to 2019 the total developed land of the Raleigh-Durham metropolitan area increased by 35.2 percent.]()
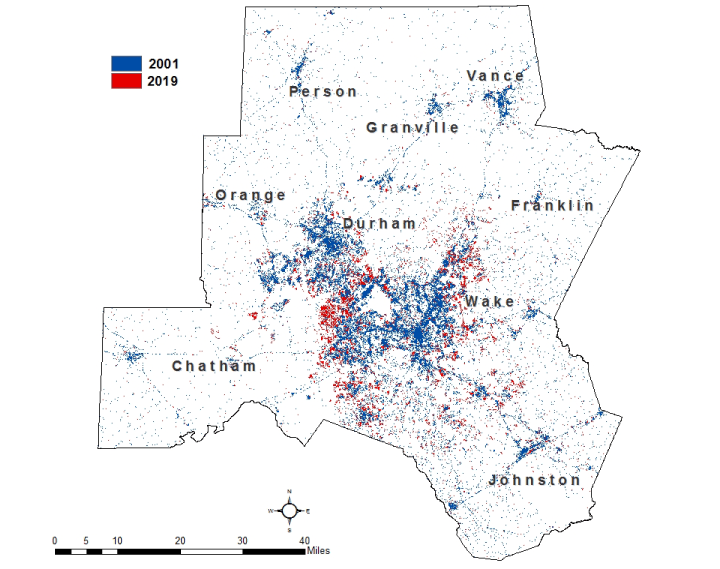
Raleigh-Durham-Cary, NC CSA developed land, 2001–2009. Source: Map produced with data from the Multi-Resolution Land Characteristics Consortium, “National Land Cover Database” (2001 and 2019).
North Carolina needs the carbon sequestration provided by nature to offset emissions that will be difficult, if not impossible, to mitigate by midcentury. This will require the state to slow the outward expansion of low-density development on the fringes of its urban areas by supporting economic growth within its existing metropolitan footprint. Growing in and up instead of out will require a fundamentally different project mix focused on moving people instead of cars. And that will require a significant reform of STI.
Gov. Cooper has laid out an ambitious vision for a future in which North Carolina has a truly sustainable and equitable transportation system. The roadblock to achieving that vision is STI.
Alternative project scoring
The STI scoring systems should eliminate the redundant congestion measures and replace them with measures that strongly correlate with improved sustainability, equity, and access. Additionally, the legislature should remove spending mandates tied to specific transportation modes. The purpose of transportation investments is to build a system that delivers the greatest economic, environmental, and social return on investments regardless of mode.
Importantly, this does not mean that transportation plans and project scoring systems should attempt to be neutral about mode but rather that the process of project selection should focus on outcomes as opposed to modal expenditure minimums or maximums.
For instance, North Carolina should adopt reducing vehicle miles of travel as a performance goal, rewarding projects that reduce both the frequency and distance of auto trips. Achieving this goal will require a mix of transit, highway, and system management projects. These could include better pedestrian and cycling infrastructure, automated speed enforcement, intersection signal prioritization for transit vehicles, dedicated bus lanes, and congestion pricing, among other system improvements. The essential characteristic that these projects all share is that they help to shift travel demand away from driving and toward transit and nonmotorized trips. The exact proportion of highway, transit, and system management expenditures is irrelevant.
The following list represents a sample of alternative system performance measures that would advance a more sustainable, equitable, and productive transportation system in North Carolina. Some of these measures are binary while others exist on a measurable continuum. For instance, a section of roadway may lack pedestrian and bicycle facilities and features. Under a reformed STI scoring system, a project to add those elements would receive a certain fixed allotment of points. By comparison, GHG emissions would exist on a continuum. A project to deploy automated speed enforcement cameras would have a different emissions profile than a project to convert a general-purpose travel lane into a dedicated bus lane. Under a reformed STI, those projects that would achieve greater GHG reductions would receive a higher environmental score. Alternative performance measures could include:
- Equity/historical disinvestment: A measure of historic patterns of discrimination, disinvestment, and geographic isolation with a goal of redressing historical inequity and barriers to opportunity.
- Household transportation cost: A measure of the cost burden of transportation, which is the second-largest expense after housing for most Americans. Its goal is to reduce household expenditures on transportation principally by reducing dependence on driving and the need for private vehicle ownership.
- Greenhouse gas emissions: A measure of total and per capita GHG emissions, with a goal of eliminating GHG emissions from surface transportation.
- Vehicle miles traveled: A measure of both the total and per capital amount of driving each year with a goal of reducing vehicle miles traveled on both a per capita and total basis.
- Grid connectivity: A measure of the extent to which the surface transportation system provides alternative routes or funnels users onto a limited number of arterial roadway corridors. Greater grid connectivity typically reduces trip distances and congestion. The goal of this measure is to increase grid connectivity.
- Efficiency/person throughput: A measure of the number of people who move through a corridor a particular interval of time. Transit and nonmotorized facilities move more people through a corridor than facilities designed to principally serve automobiles. The measure’s goal is to increase the person throughput of transportation corridors.
- Nonmotorized mode share: A measure of the percentage of trips taken other than by driving or public transportation, with a goal of increasing the share of trips taken by biking and walking.
- Transit mode share: A measure of the percentage of trips taken on public transportation with a goal of increasing the share of trips taken by transit.
- Transit accessibility: A measure of the share of jobs, housing, and essential services that may be reached by transit within a given travel time, such as 45 minutes. Greater transit accessibility increases ridership. The goal is to increase the share of jobs, housing, and essential services accessible by transit within a reasonable travel time.
- Average distance to transit: A measure that looks at the average distance from transit lines to commercial and residential parcels. Greater transit service proximity increases ridership. This measure’s goal is to reduce the average distance to high-frequency transit service.
- Transit headways: A measure of the peak period and off-peak period wait times between transit vehicles. Frequent transit service is useful transit service. The measure’s goal is to reduce transit headways.
- Nonmotorized facilities: A measure of the presence of infrastructure dedicated to nonmotorized users, with a goal of increasing the share of roadways with dedicated, robust nonmotorized infrastructure and traffic control systems.
- Safety: A measure of the extent to which a project would reduce major injuries and fatalities with additional weight given to those projects that would reduce injuries and fatalities for vulnerable roadways users. The goal is to reduce major injuries and fatalities from transportation accidents—especially those involving vulnerable users.
- Asset conditions: A measure of the state of disrepair of surface transportation facilities, including roadways, bridges, transit vehicles, and associated facilities, with a goal of increasing the share of transportation facilities in a state of good repair.
Finally, the availability and uniformity of certain data mean that easy-to-assess project elements have an outsize influence on project selection. There is an old saying that comes from the world of management science: Not everything that can be measured matters, and not everything that matters can be measured.
For instance, the STI process includes points for lane width when scoring candidate highway modernization projects. Lane width is a basic piece of information that NCDOT and local governments have about the entire highway network. The uniformity and availability of this data make it easy to include in the composite score of a proposed highway project. However, the role of lane width in transportation safety is at best contested.
A major study released by the Federal Highway Administration in 2021 summarized the overall findings on lane width as follows: “In the literature, there is consensus that narrower lane widths lead to reduced average travel speeds.”63 This is not a minor point. In recent years, roadway fatalities have risen dramatically. According to the National Highway Traffic Safety Administration, “the main behaviors that drove this increase include: impaired driving, speeding and failure to wear a seat belt.”64 Wider lanes encourage one of the major causes of roadway crashes that lead to major injuries and fatalities: speeding.
What if the best way to improve transportation safety is to narrow lanes? This would slow traffic and likely reduce crashes and crash severity. The state could use the savings from laying down less pavement to fund better enforcement of existing laws to combat impairment, speeding, and failure to wear a seatbelt.
The ubiquity and uniformity of certain project characteristics such as lane width can end up having an outsize—and even counterproductive—role in project selection. Conversely, NCDOT may not be able to predict with fine-grained specificity exactly how many more nonmotorized trips residents will take or how many lives will be saved by building sidewalks, protected bike lanes, and raised crosswalks, but this should not preclude a comprehensive build-out of these facilities.
The iron law of transportation is this: Building infrastructure for cars leads to more driving, while building infrastructure that supports safe and affordable transit, biking, and walking leads to more ridership and less driving. Data should supplement but not supplant this understanding. Focusing on data availability and uniformity can lose the forest for the trees.
Conclusion
The time for North Carolina to revise STI is now. The flow of IIJA money makes it essential that the state legislature make fundamental changes to how projects are reviewed and selected for state and federal funding. Without reform, STI will continue to funnel roughly 94 percent of surface transportation spending to highway projects with an emphasis on expansion. This will lock in driving and auto dependence for decades to come. The state legislature should adopt evaluation criteria that elevate transportation projects that move people safely and efficiently as opposed to projects focused on vehicle throughput. In short, STI should reward regions and projects that provide safe, affordable, sustainable, and equitable mobility.