Tomorrow, the U.S. Bureau of Labor Statistics (BLS) will release its Employment Situation Summary for the month of July. Since the employment recovery began in February 2010, the U.S. economy has added more than 21 million jobs, and the steady tightening of the labor market has finally started to deliver some modest wage growth for workers. Unfortunately, President Donald Trump has done nothing to further this economic progress; he has neglected to push for any economic policies that would help workers or create jobs. Economists and policymakers should take this into account when evaluating the health of the labor market after the BLS release. Although looking at the overall numbers is valuable, this lack of progress underscores the particular importance of considering workers who may be overlooked in broad summary statistics, including older workers.
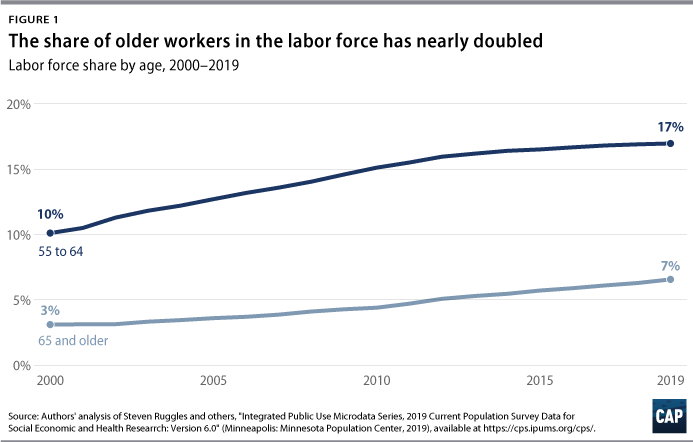
Older workers are more likely to be in the labor force today than ever before. Since the middle of 2018, there have been more than 10 million people above age 65 in the labor force, up from just more than 4 million in 2000. Baby Boomers, people who are currently ages 55 to 73, have continued to stay in the workforce at rates higher than those of previous generations. Therefore, understanding where the labor market is going today increasingly requires understanding the motivations and decisions of older workers. Unfortunately, understanding these decisions is complicated, and economists have typically focused more on the 25- to 54-year-old workers whose choices are simpler to model. There is a vast disparity in the opportunities and resources available to Americans in their late 50s, 60s, and above, whose differences in wealth, health, and opportunities have compounded for decades. But there are clear trends in the data that can provide a much richer understanding of what the most experienced Americans are confronting in the job market.
Older workers in the labor market
A combination of factors has made retirement harder, riskier, and costlier over the years, including policymakers’ continual push to raise Social Security’s full retirement age—a policy that has been proven to cut benefits for all retirees, with lower-income individuals being disproportionately affected. Thus, justifications centered around a healthier workforce and increased life expectancy spark reason for concern. In fact, improvements in life expectancy differ significantly by socio-economic status. For those at the bottom half of the income ladder, life expectancy has barely increased for the past 30 years. Financial insecurity is one motivator keeping older Americans in the labor force longer than in previous decades.
While workers ages 55 and older are the fastest-growing workforce population by age, numerous obstacles for this group persist. Age discrimination is prevalent throughout the labor market. A 2018 AARP workplace survey found that, “Nearly 2 out of 3 workers ages 45 and older have seen or experienced age discrimination on the job … Among the 61 percent of respondents who reported age bias, 91 percent said they believe that such discrimination is common.”
Additionally, older workers tend to work part time far more frequently than prime-age workers, and they are often the first to be pushed out of their jobs by employers.
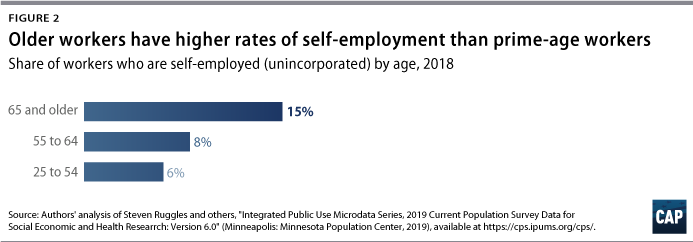
Workers above age 55 are disproportionately self-employed
In addition, the self-employment rate for older workers is higher than the self-employment rate for the rest of the workforce. While less than 6 percent of prime-age workers are considered self-employed, more than 8 percent of workers ages 55 to 64 are considered self-employed. This rate increases with age, rising to 15 percent for workers ages 65 and older.
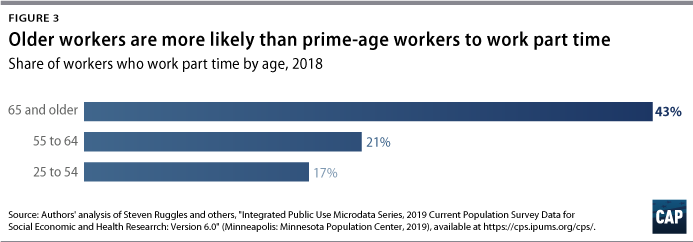
Part-time employment is common among older workers
Part-time employment also increases with age. Seventeen percent of prime-age workers are employed part time, while 21 percent of workers ages 55 to 64 are employed part time. Nearly half of all workers ages 65 and older are part-time workers.
Conclusion
Despite overall low unemployment rates and a welcome continuation of normal growth in U.S. gross domestic product, the reality behind wages—as well as the disproportionate hurdles that older and low-income groups face in the labor market—suggest that all workers may not be seeing the gains and opportunities of an economy that appears healthy from the headlines. There is still room for the economy to grow—and when considering economic priorities, it is essential that analysts and policymakers take a variety of indicators into account, instead of overstating the economic prosperity of the past few years.
Onyeka Obi is an intern at the Center for American Progress. Galen Hendricks and Daniella Zessoules are special assistants at the Center. Michael Madowitz is an economist at the Center.