Introduction and summary
Most children who grow up in the United States in the 21st century will be raised in households in which all of the adults work.1 They are most likely to be raised by a single working parent or two married parents who are both employed, and only a minority of children will grow up in families with a full-time, stay-at-home parent throughout their childhood.2 Although working parents are the modern norm and have been for years, the notion that most families already have a full-time caregiver available persists and continues to influence public policy as federal and, to a lesser extent, state policymaking has not prioritized work-family supports. In most families, every adult works; when a new child is welcomed into the family, when a child stays home sick from school, or when an aging parent suffers from a fall, someone must stay home to provide care—and this person is usually a mother, a wife, or an adult daughter.3
Gender norms are changing. There has been an increase in the number of stay-at-home fathers in recent years, and men report a strong desire to spend more time with their families.4 But women still carry the brunt of unpaid work within the home and spend more time caring for children and performing household labor than men with similar demographic characteristics and parental status.5 Women and the paid labor they perform are important economic drivers in the United States, but current policies do little to reflect this reality. Too many workplaces, and most existing public policies, are based on a faulty underlying premise: that most families have access to an unpaid caregiver and that if someone needs to take time away from work to provide care it will most likely be a wife, mother, or adult daughter—and that doing so will have no negative impact on her family’s economic well-being. Even though women make up nearly half of all U.S. workers6 and account for most consumer spending,7 there is still a deep and often unconscious belief that women’s earnings are not central to their families’ economic security. This same belief too often has created a tolerance for gender-based wage disparities that have resulted in fewer resources for families. Unfortunately, these views are still too widely held—even though research has consistently proven them wrong for years—and gives workplaces and lawmakers little incentive to pass policies that support working families.
The Center for American Progress first published a report on mothers as breadwinners for their families a decade ago, in a chapter titled “The New Breadwinners” in The Shriver Report: A Woman’s Nation Changes Everything.8 This groundbreaking research, authored by former CAP economist Heather Boushey, was among the first of its kind, quantifying the impacts of women’s increased labor force participation since the 1960s. Boushey’s work has been replicated over the years by a number of different authors, sometimes using slightly different variables and definitions.9
The research published in this report will continue the trajectory first laid out in Boushey’s original work, demonstrating that the same trends hold true 10 years on, although the national policy landscape remains largely unchanged. First, the report outlines changes in family composition and employment patterns. Then, it compares how rates of mothers’ breadwinning and co-breadwinning vary by marital status, family income, race and ethnicity, level of educational attainment, age of child, and state of residence.
Changes in family composition and employment patterns
A robust body of research proves that family composition in the United States looks very different than it did in previous generations. Married couples marry later and are less likely to have children than they were in previous generations, and households headed by unmarried parents—those who are single or cohabitating—are far more common than they used to be.10 In 1974, for example, a married couple headed 84 percent of all families with children, while in 2017, only 66.4 percent of families with children were headed by a married couple.11 At the same time, there was a corresponding increase in the rate of families headed by an unmarried parent. From 1974 to 2015, the percentage of families with children headed by a single mother nearly doubled—from 14.6 percent to 25.2 percent—while the percentage of families headed by a single father quadrupled from 1.4 percent to 8.3 percent.12
A note on terminology
To remain consistent with CAP’s previous research, the author uses the same definitions for variables in this updated report as in previous reports. The term “breadwinning mothers” refers to unmarried working mothers—which includes those who have never married, as well as those who are divorced, separated, widowed, or married with an absent spouse—and married mothers who earn as much as or more than their husbands. In the initial 2009 research, first published in The Shriver Report, co-breadwinning mothers were defined as “a working wife bringing home at least 25 percent of her family’s total earnings.”13
In addition to significant changes in the marital status of parents, there have also been large shifts in the percentage of mothers participating in the labor force. Fathers have always been very likely to work for pay, but mothers have dramatically increased their participation in paid labor over the past 40 years. In 1976, only 56.3 percent of married mothers worked for pay, compared with 69.6 percent in 2017.14
These shifts over time are substantial when looking at the population as a whole, but the changes have not been evenly felt by all groups. Significant differences have always existed in the family and labor force experiences of white women when compared with women of color, particularly black women. Women of color, and black women especially, have always been more likely to work outside the home than white women.15 This difference in labor force participation is deeply rooted in U.S. history around race, gender, and work. Black women were always expected to work, too often in undervalued jobs with low wages.
Women of color are also much more likely than white women to be raising children while unmarried, even though white women make up the majority of unmarried mothers. In 2016, for example, 40 percent of all births in the United States were to unmarried mothers.16 This included 17 percent of births to Asian or Pacific Islander women, 29 percent to non-Hispanic white women, 53 percent to Hispanic women, 66 percent to American Indian or Alaskan native women, and 70 percent of births to non-Hispanic black women.17
But race and marital status are not simply variables to be controlled for in analysis, nor do they provide simple explanations for differences across groups. Women of color, and black women in particular, have a complex history in relation to work and the institution of marriage, in part because of how racism, stereotypes, and structural biases have shaped policy decisions, opportunities, and the lives of people of color in the past and present day. This context shapes the experiences of women of color in the United States and should be taken into account when analyzing any data relating to their lives.
When looking at historic shifts in mothers’ earnings and labor force participation rates, it is important to keep in mind that while the overall trends point toward change, certain groups of women—especially women of color and working-class women—have always been more likely to contribute significantly to their families’ incomes while simultaneously providing the majority of family care.
Working mothers’ breadwinning rates and family income contributions
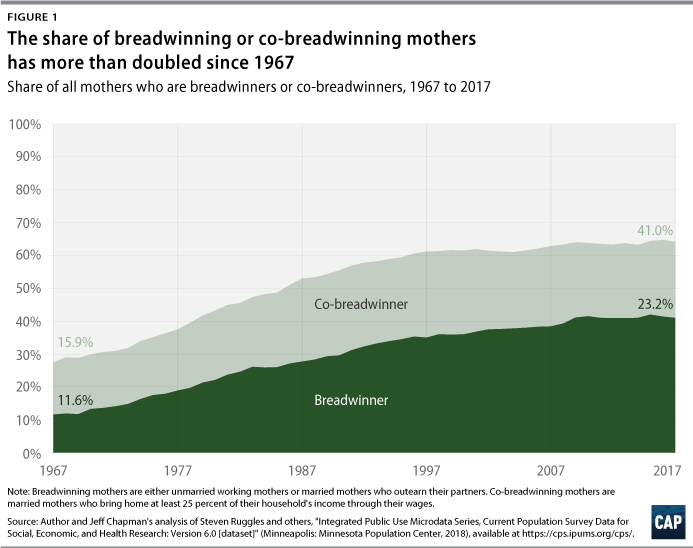
In 2017, the latest year with available data, 41 percent of mothers were the sole or primary breadwinners for their families, earning at least half of their total household income. (see Figure 1) This includes single working mothers and married mothers who out-earn their husbands. An additional 23.2 percent of mothers are what Boushey originally coined “co-breadwinners,” married mothers whose wages comprise at least 25 percent of their total household earnings. This represents a continuation of the previous trends seen in CAP’s research using data from 2009, 2010, 2013, and 2015, and there are no indications that the trend will reverse itself.18 Women’s high labor force participation rates and significant responsibilities for contributing to their household earnings are not something that is likely to change.
In most families with children at home, the majority of mothers work outside the home for pay. Among married couple families, two-thirds of mothers are employed (67.3 percent), as are the nearly three-quarters of unmarried mothers (73.2 percent).19 Employment rates for mothers are slightly lower among families where the youngest child is under 6 years old—61.4 percent for married mothers and 68.0 percent for unmarried mothers—but the majority of women with even very young children still work for pay.20 It is therefore unsurprising that so many women contribute significantly to their families’ total earnings.
While Figure 1 shows data for all women with children under age 18, not all mothers have the same patterns of labor force participation or experiences in the workplace, and these key differences contribute to different patterns of breadwinning and co-breadwinning when key demographic groups are analyzed independently.
Region and state
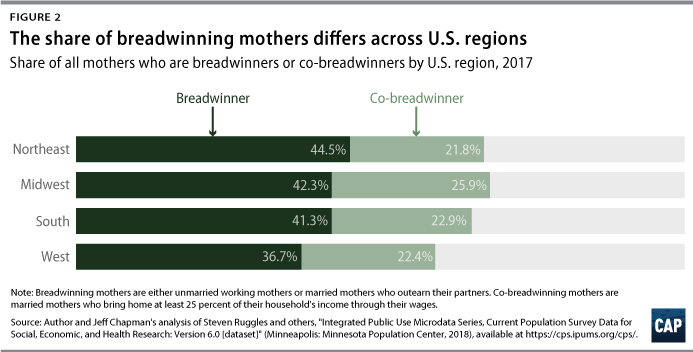
The number of breadwinning and co-breadwinning mothers is not evenly spread across different regions in the United States, with the highest concentration of breadwinners in the Northeast and the highest percentage of co-breadwinners in the Midwest.21 (See Figure 2)
These patterns also differ within states in each region. (see Table 1)
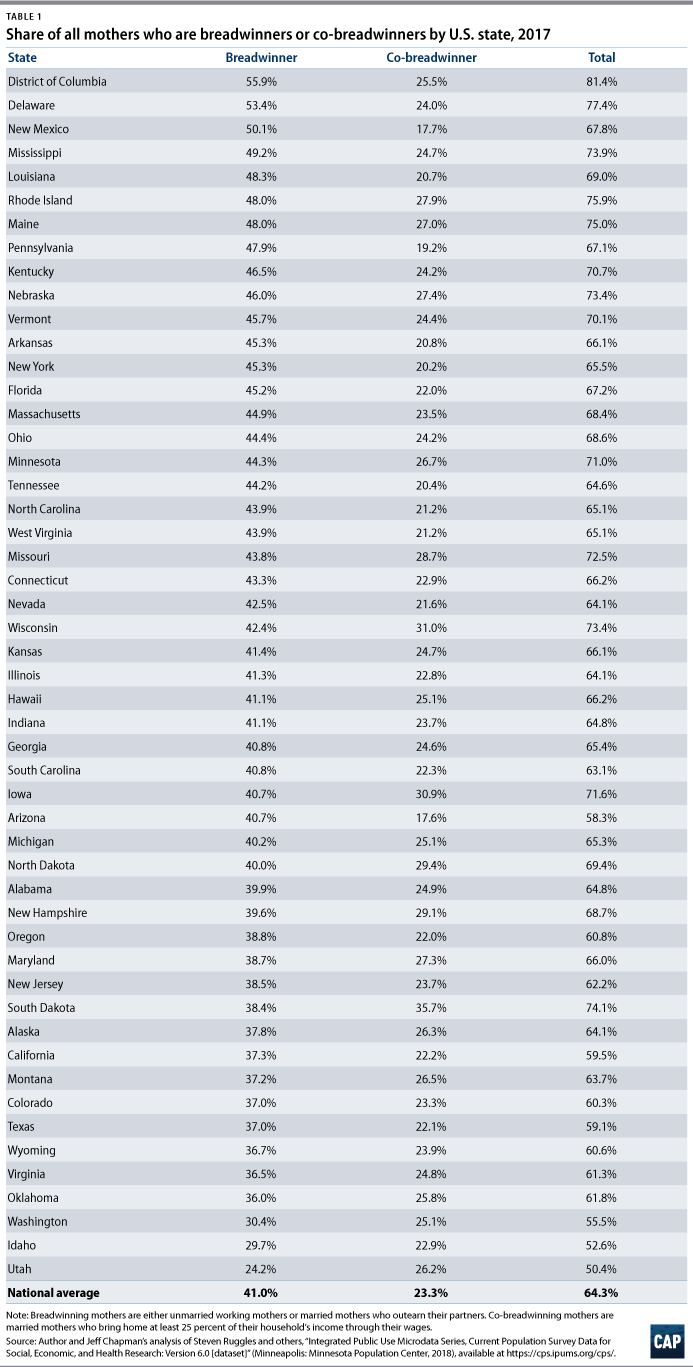
The states with the highest levels of breadwinning mothers are not necessarily the ones where the most high-earning households are located.22 For example, the state with the highest average household income—Maryland—has a lower than average rate of breadwinning mothers, although it does have a higher than average rate of co-breadwinning. And the state with the lowest average household income—Mississippi—has the fourth-highest rate of breadwinning mothers across all states. Mississippi has the second-highest share of black workers in the United States, after only Washington, D.C.,23 and black women’s labor force participation in the state outpaces white women’s,24 although their wages are much lower.25 This example highlights the fact that mothers’ breadwinning does not necessarily always correlate with higher incomes or greater economic security for working families, as discussed in greater detail in the following sections. As outlined below and in CAP’s previously published research, breadwinning mothers are more common in lower-income families, and are more likely to be women of color.26
Family income
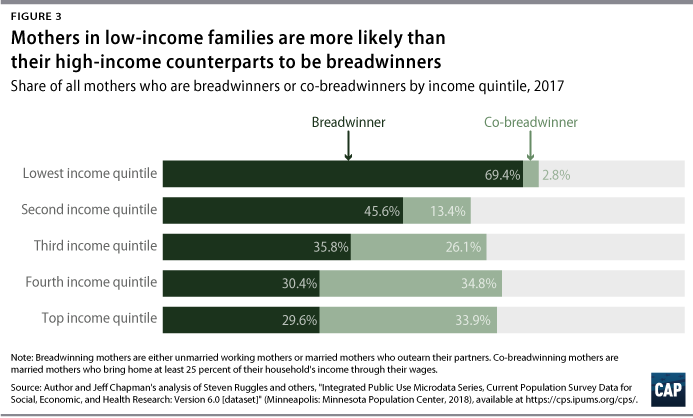
Breadwinning mothers include both married women who earn as much or more than their husbands and unmarried working women with children, while co-breadwinning mothers are all married. When comparing the incomes of families with breadwinning and co-breadwinning mothers, notable differences emerge. Families in the bottom two income quintiles were much more likely to have breadwinning mothers, while those in the higher income groups were more likely to include co-breadwinning wives. As family income increases, the rate of breadwinning mothers steadily declines, while the rate of co-breadwinning mothers generally increases. (see Figure 3)
One significant driver of these differences is the marital status of mothers by income group. There is a stark reversal of trends among breadwinning mothers—those earning all or the majority of their family’s income—between the bottom and top income quintiles. Among breadwinning mothers in the bottom quintile—the most common income group for breadwinning mothers—the vast majority are unmarried (87.3 percent of the total), while nearly 9 in 10 breadwinning mothers in the top quintile, where breadwinning is less common, are married (89.8 percent). It is important to note that both married and unmarried mothers are breadwinners for their families and that unmarried parents head families at all points in the income spectrum. (see Figure 4) As a robust body of research has shown, marriage is not an effective solution to poverty.27 Women consistently earn less than their male counterparts at all income levels and are more likely to work in the lowest-paying jobs. These disparities hold true regardless of whether women are married or unmarried. The discussion of unmarried breadwinning mothers in this report is intended to reflect the diversity of family structures—not to imply that marriage necessarily should be a goal for families.
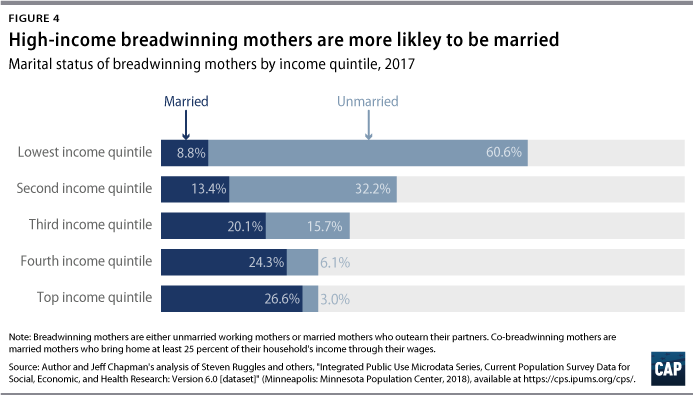
This likely reflects two separate trends. First, low-income women are generally less likely to be married than their higher-income peers. The reasons behind this are complex and beyond the scope of this report, but they are likely affected at least partially by the difficulties inherent to living close to or below the poverty line, including the chronic stress associated with poverty and lower reported subjective well-being scores.28 Second, due to structural factors such as the gender wage gap, lack of access to affordable child care, and lack of workplace supports for parents, unmarried mothers are more likely to work in low-wage jobs, which makes them more likely to end up in the lowest income quintile.
Race and ethnicity
As noted in previous reports, the majority—60.1 percent—of breadwinning mothers in 2017 were white; and the racial and ethnic breakdown of the remaining breadwinning mothers is as follows: 16.2 percent black; 16.4 percent Hispanic; and 7.3 percent non-Hispanic mothers of another race or ethnicity.29 White women also represent about two-thirds of co-breadwinning mothers and married mothers with zero earnings, at 63.9 percent and 61.2 percent, respectively.30
Part of this is driven by the fact that white women make up the majority of mothers in the United States. While ongoing demographic shifts have resulted in a more diverse U.S. population, there are still more white households with children than households of color with children, with non-Hispanic white families representing 56 percent of all households with children under 18 in 2017.31
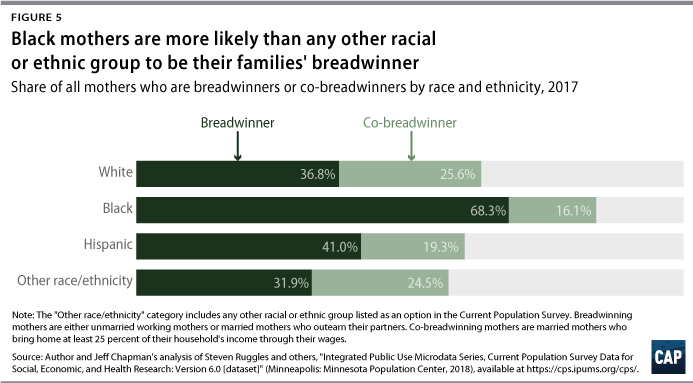
Although white mothers make up the majority of breadwinning and co-breadwinning mothers due to their overall greater numbers, when analyzing the data within racial and ethnic groups, it becomes clear that white women are less likely to be breadwinners than women of color. Black mothers are by far the most likely to be the primary source of economic support for their families; they are more than twice as likely as white mothers to be their family’s breadwinner, and more than 50 percent more likely than Hispanic mothers. (see Figure 5) White women, by contrast, are the most likely to be co-breadwinning wives, although the differences across racial and ethnic groups are not as large as those for breadwinning mothers.
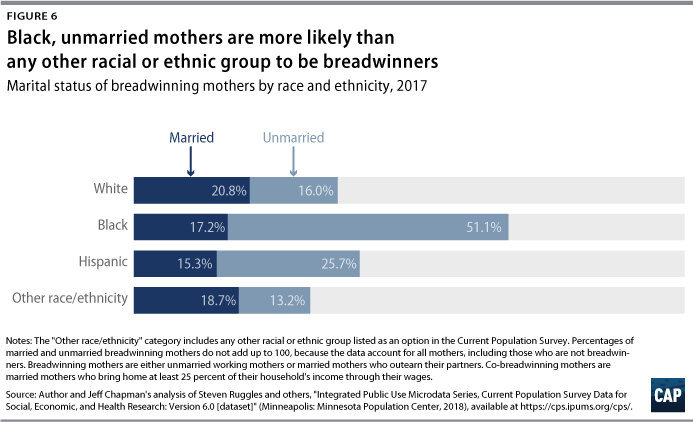
Black mothers are by far the most likely to be the primary economic support for their families, both because a higher percentage are single mothers and because when part of a married couple, they are more likely to earn as much as or more than their husbands. (see Figure 3b) Black mothers are also much more likely to be unmarried breadwinners (51.1 percent), compared with white (16.0 percent) and Hispanic (25.7 percent) mothers or mothers of another race or ethnicity (13.2 percent). Interestingly, there are not similarly large discrepancies by race or ethnicity across married breadwinning mothers, although white women are slightly more likely to be married breadwinners (20.8 percent) than black (17.2 percent) or Hispanic mothers (15.3 percent). (see Figure 6)
As discussed in CAP’s previous report, in 1970, black mothers were roughly as likely to be breadwinners or co-breadwinners for their families—36.4 percent and 22.2 percent, respectively—as white mothers were in 2017—36.8 percent and 25.6 percent, respectively.32 This illustrates that while the labor force participation and earnings of white women have changed significantly over the past several decades, white women today are contributing to their families’ incomes at roughly the same rate as black women were more than 45 years ago. Although an extensive discussion of the reasons for these differences is outside of the scope of this paper, it is important to note that economic and employment opportunity in the United States has always been both highly racialized and gendered. Black women’s participation in the labor market, for example, has been affected by entrenched racism that has limited their opportunities —as well as those of black men—and devalued their work through persistent pay disparities. This context has often meant that more black women have had to work to help ensure the economic stability of their families, even while facing ongoing discrimination. This highlights the importance of centering race within discussions of women’s economic issues to gain a better understanding of the unique challenges affecting women of color’s economic standing, including their labor force participation and breadwinning rates.
Slightly more than half, or 56.5 percent, of white breadwinning mothers are married and earn as much as or more than their husbands. However, 37.3 percent of Hispanic breadwinning mothers are married, as are 25.3 percent of black breadwinning mothers.33 The majority of black and Hispanic breadwinning mothers are single parents working to provide for their families.
It is well documented that black and Hispanic women have lower wages, on average, than white men, men of color, and white women.34 In 2018, non-Hispanic white women earned 81.5 percent of what non-Hispanic white men earned, while black women earned only 65.3 percent and Hispanic women earned only 61.6 percent of what non-Hispanic white men earned.35 These findings also reflect black and Hispanic women’s historically high labor force participation rates, as women of color have always been more likely than white women to work in the paid labor force.36
Education level
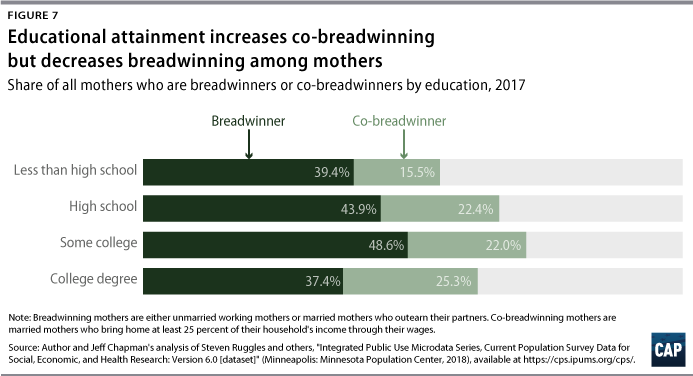
While generally higher levels of education are associated with higher earnings, this analysis shows that women with a college degree are the least likely to be breadwinners, although the likelihood of being a co-breadwinner increases along with educational attainment. (see Figure 7) On its face, this finding is counterintuitive; nearly half of women who have completed some college are breadwinners (48.6 percent), compared with slightly more than one-third of women with a college degree (37.4 percent).
However, the picture looks slightly different when comparing breadwinning mothers by marital status. Women with a college degree are the least likely to be unmarried breadwinners bringing home the primary income for their family, which accounts for their overall lower breadwinner numbers. But even among married mothers, those with a college degree have the same rates of breadwinning as women with only a high school diploma when compared with their husbands. (see Figure 8)
Two connected factors explain this, at least partially. First, people tend to marry partners with similar levels of education to their own, meaning that women who have completed college are more likely to marry men who have also graduated from college.37 And second, the gender wage gap is not completely closed by education, in spite of women’s increased educational attainment over recent years.38 On average, women need one additional degree to earn as much as men, meaning that a woman with a college degree will earn as much, on average, as a man with a high school diploma.39
Women’s age and the age of their children
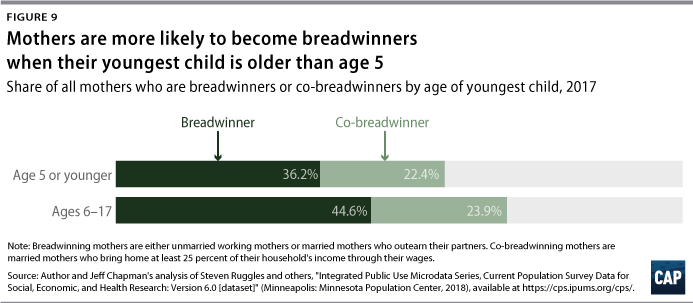
Rates of breadwinning differ by the age of mothers and the age of their youngest child. Because the ages of children and their mothers are highly correlated, it is not surprising to see similar patterns across both variables. Mothers whose youngest child is age 5 or younger are less likely to be breadwinners for their families, although they are roughly as likely to be married co-breadwinners. (see Figure 9)
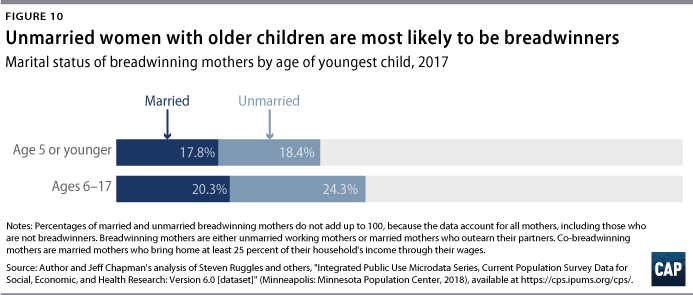
Mothers with young children are split roughly in half between married and unmarried mothers, while breadwinning mothers of older children are slightly more likely to be unmarried. This may reflect the fact that many unmarried mothers are divorced or otherwise estranged from their partners, rather than having never been married.
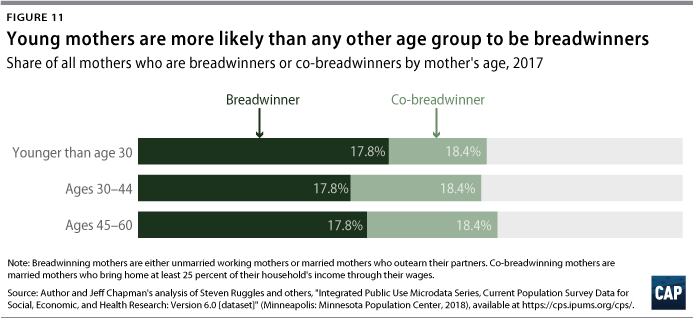
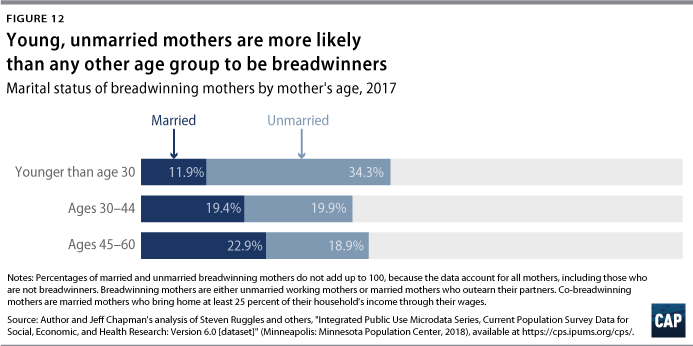
Younger women are more likely to be breadwinners but less likely to be married co-breadwinners. (see Figure 11) This is partly explained by the fact that younger women are more likely to be unmarried than women over 30, as the majority of younger breadwinning mothers are not married. (see Figure 12) Younger workers also earn less on average, and family caregiving responsibilities and life events such as pregnancy and childbirth can further depress workers’ wages, which may be part of why younger married mothers are less likely to earn as much relative to their husbands.
The United States needs modern workplace policies
Most mothers work for pay outside of the home, and in the majority of families, mothers’ earnings make up a significant portion of household income. Their labor also benefits society writ large: The increase in women’s work hours from 1979 to 2012 resulted in an 11 percent increase in gross domestic product (GDP), amounting to $1.7 trillion.40 But the fact that so many mothers work and earn a large portion of their families’ income does not mean that there are not problems and barriers to women’s employment that must be addressed. If women’s labor force participation matched that of men’s, the annual GDP would increase by 5 percent.41 Moreover, if women in the United States participated in the labor force at the same rates as in Germany or Canada, there would be 5.5 million more women in the labor force and more than $500 billion of new economic activity annually.42
Part of the problem—and one of the reasons why women’s labor force participation in the United States lags behind that of other advanced economies—is a lack of work-family policies to support working caregivers.43 A lack of work-family policies in the United States keeps too many women out of employment, working part-time involuntarily, or earning artificially lower wages. Women, and especially mothers, tend to do the most caregiving in their households, even when they are also employed.44 A previous CAP report on working parents found that mothers spend more combined time working, caring for children, and doing household labor than fathers—even though they are less likely to have access to affordable child care and workplace policies such as paid family and medical leave, paid sick days, and equal pay.45
One important caveat to keep in mind is that while a significant number of mothers are breadwinners or co-breadwinners for their families, women continue to receive artificially depressed wages as a result of the gender wage gap. In 2017, for example, the average full-time, year-round working woman earned 80.5 percent of what the average full-time, year round working man earned.46 Women of color and all mothers face even steeper pay gaps, the result of which is more than $500 billion a year in lost wages.47 The causes of the wage gap are multifaceted, but differences in pay can be largely traced back to differences in the ways that women and men are treated in schools, in workplaces, and in society writ large.48 While combating societal sexism is a vast and ongoing project, there are policies that could help to narrow the wage gap and ensure that women’s labor outside the home is valued equally to men’s.
Address the gender wage gap
Proposals such as the Paycheck Fairness Act—which would expand protections for women who experience pay discrimination, expand data collection, and increase accountability for employers who discriminate—are crucial to addressing gender wage inequality.49 Moreover, because women make up the majority of minimum wage earners, increasing the minimum wage to $15 an hour, as the Raise the Wage Act requires, would increase earnings and help narrow the wage gap for more than 4 in 10 working single mothers who make up a significant percentage of breadwinners.50
Support comprehensive paid family and medical leave
The lack of workplace policies to support family caregivers depresses mothers’ wages, pushes some women out of the labor force, and can make life more stressful than it needs to be. The United States remains the only advanced economy that does not guarantee women the right to paid maternity leave, and as of 2018, only 16 percent of private sector workers had access to paid family leave through their employers, with even lower rates for workers at the bottom of the wage distribution.51 Previous CAP analysis has found that families lose out on at least $20.6 billion in lost wages each year due to a lack of access to paid family and medical leave.52
Losing income or leaving the workforce after experiencing a serious medical event or the need to provide family caregiving should not be the norm, as happens often in the United States. To date, six states—California, New Jersey, Rhode Island, New York, Washington, and Massachusetts—and Washington, D.C. have passed laws to create temporary disability and comprehensive paid family leave programs administered at the state level. While states are at the vanguard of this issue, a national solution is necessary to level the playing field for workers in other parts of the country. The Family and Medical Insurance Leave (FAMILY) Act would create a national program to provide wage replacement to workers when they need time off to care for themselves, a seriously ill family member, or a new child.53 It is important to note that all the existing state programs and the FAMILY Act provide comprehensive paid family and medical leave that can be used to address a number of different qualifying life conditions, mirroring the unpaid job-protected leave that is currently offered under the Family and Medical Leave Act of 1993.54
Increase access to paid short-term leave
In addition to longer-term paid family and medical leave to address serious illnesses and care needs, workers also need access to short-term leave if they or a family member come down with a less serious medical problem, such as a cold or the flu. The Healthy Families Act, first introduced in 2004, would allow workers to earn up to seven paid sick days per year that could be used to recover from an illness, care for a sick family member, or access medical care.55 Ten states—Connecticut, California, Massachusetts, Oregon, Vermont, Arizona, Washington, Rhode Island, Maryland, and New Jersey—and Washington, D.C., as well as dozens of cities, have already passed paid sick day laws.56 A national policy would help to cover workers living in other areas who do not currently have access to paid sick leave.
Improve access to affordable, quality child care
Similarly, families need access to affordable, quality child care so that they can work. Child care is especially important to working mothers, who are much more likely to be employed when they find child care.57 For many families, the price of child care is out of reach and public assistance for child care is extremely limited, reaching only 1 in 6 eligible families. The Child Care for Working Families Act would guarantee child care assistance for all low-income and middle-class families, ensuring that they do not spend more than 7 percent of their total income on child care.58 In addition, the bill would improve quality options available to parents and boost wages for early educators.
Conclusion
The data analyzed here paint two different pictures. On the one hand, women’s labor force participation remains high, and most mothers are breadwinners or co-breadwinners for their families. This picture looks rosy and, notably, reflects decades of positive advances made by women in the workplace and the broader culture. However, these positive statistics exist in spite of the nation’s lack of work-family policies. Breadwinning mothers are likely to be in low-income families, to be young, and to have very young children, and they are disproportionately more likely to be women of color who must address the interconnected issues of sexism and racism in their daily lives. Yet these women persist in supporting their families, generally without access to affordable child care, paid family and medical leave, pay equity, paid sick days, or any of the other host of supports that allow people to better juggle the demands of working while also raising a family and caring for others. If women have come this far, and have made such great economic strides without sensible policy supports, the progress they could make if work-family policy in the United States caught up with the rest of the world is limitless.
Updating the country’s modern labor standards would provide all workers—mothers, fathers, family caregivers, and everyone else—with the supports they need to maintain their commitments at work and in their personal lives. Considering how far we have come without these policies in place, bringing the United States up to the same standards as other comparable economies would only further increase women’s earnings and the economic security of their families.
About the author
Sarah Jane Glynn is a freelance consultant and former senior policy adviser at the Center for American Progress. An expert in gender and family economic security, Glynn has a bachelor’s degree in women’s studies from UCLA and a doctorate in sociology from Vanderbilt University.