Introduction and summary
Many, if not most, workers experience times in their lives when their responsibilities at work conflict with their responsibilities at home. This is a problem that is felt acutely by all workers who have caregiving responsibilities at home—whether they are caring for a baby, a child, another adult with a disability, or an elder. While all working caregivers can experience similar struggles, this report focuses on working parents who need time to care for their children while also bringing home a paycheck. Unfortunately, due to a lack of national public policies to support the realities of working families’ needs, most parents have to find ways to meet all their obligations without access to employment policies that guarantee them common-sense supports such as paid leave, workplace flexibility, scheduling predictability, and affordable child care. Women, low-wage workers, and people of color—who are even less likely to have access to the policies that would help them to address their families’ caregiving responsibilities—disproportionately feel these effects.
While all workers are likely to experience time conflicts, working mothers are especially hard hit because, in addition to their paid labor, they take on the majority of unpaid household and care work. Most workers in the United States—including most working mothers—are employed full time, and most mothers are either breadwinners or co-breadwinners for their families. But in addition to their paid employment, most working mothers come home to a second shift of unpaid work that includes household labor and child care. While many are able to figure out ways to manage their time and responsibilities on the average day, when common but unexpected life events—such as a child running a fever or a broken appliance requiring a visit from a repairperson— upend schedules, too many workers are left without good options to address the competing needs of their employers and their families.
There is a general cultural awareness that in most families today, all of the parents in the home are employed, and labor that is done for pay—that is to say, work—is often the focus of conversations around work-family dynamics. While paid employment is an important and time-consuming aspect of most individuals’ lives, unpaid household labor and caregiving are also vital to the overall functioning of society. As this report will show, working women and men do not have equal experiences when it comes to how they spend their time on paid and unpaid labor. This has consequences for how advocates and policymakers should be thinking about gender equity; without public policies that reflect current gendered caregiving demands, women will continue to operate at a disadvantage in the paid workforce. The total demands and the time women and men spend across all spheres of their lives are simply unsustainable. Policy interventions are necessary to help workers address the responsibilities they have outside of paid employment. Prioritizing paid labor above all other forms of work not only subtly benefits men and promotes gender inequality in our current system, but it also negatively affects children who need their parents to have time to provide care. Working families need greater control over how they choose to divide their time, rather than have their choices constrained by a lack of workplace policies.
This report analyzes time-use data in order to establish a clearer picture of how working parents spend their time on workdays. The data presented in this report show that working parents spend most of their waking hours engaged in paid work or unpaid household and caregiving labor. Some key findings include:
- Having children that are younger than 6 years old reduces mothers’ work hours but does not have a statistically significant impact on fathers’ working time. One exception are black women, who maintain high work hours regardless of the presence or age of their children.1
- While mothers of young children spend less time on paid work, they are significantly more likely to engage in household labor and chores on days when they also work for pay. They spend significantly more time on these activities compared with fathers.2
- When time spent on paid employment and time spent on unpaid household labor and child care are combined for all workers, there is no significant difference in the total time spent between all women and all men.3 So, while women may spend slightly less time working for pay, they make up for this time in unpaid labor within the home.
- When total time use is compared between mothers and fathers of young children, mothers spend more combined time working, doing household labor, and caring for children than fathers.4
- Although mothers of young children spend more time on work, household labor, and child care than fathers, they are not more likely to have access to workplace policies such as paid family and medical leave, paid sick days, workplace flexibility, and affordable child care.5
Overall, there is not a strong relationship between earnings and family income and time use either in relation to paid employment or unpaid household work. This means that most low-wage workers and workers from lower-income families spend roughly the same amount of combined time on paid work, household labor, and child care responsibilities when compared with higher-wage workers and workers in higher-income families. This indicates that low-wage workers and those in low-income families are not in their economic situation because they work fewer hours; rather, they work roughly the same amount of time and simply earn less money while doing so. Therefore, increasing their labor supply by working longer hours alone is not necessarily a pathway to higher incomes. Because higher-earning workers and families are more likely to have access to paid leave policies and the ability to afford high out-of-pocket costs for child care, lower-earning workers and families who lack access to paid leave and cannot afford child care may be much more likely to experience work-family conflict.
As the analysis in this report will show, being the parent of a young child affects women’s work hours—but not men’s. Fathers and other men work the same total number of hours, but mothers of children under age 6 work fewer hours than men and women without small children.6 One notable exception are black women, who work longer hours compared with white and Hispanic women, and whose work hours do not change significantly when they have young children.7
Although mothers spend fewer hours engaged in paid labor, they are significantly more likely to engage in household labor and chores on days when they also work compared with fathers. The majority of working mothers with young children return home from work only to engage in a second shift of unpaid household labor—and they do so at rates and with time investments that far exceed those of working fathers.8 Mothers of young children, in addition to doing significantly more household labor, take on the majority of child care responsibilities within their families. Across nearly every demographic variable analyzed in this report, mothers of young children were significantly more likely to provide primary and secondary care for their children on days when they also worked. Fathers report more leisure time than mothers, and less of their leisure time is spent providing care to children.9
Across all workers, the majority of waking hours on work days are spent on a combination of paid and unpaid labor. When hours spent working for pay are combined with hours spent on unpaid household labor, there are no statistically significant differences in the total time spent between women and men.10 This means that while women spend less time working for pay, they make up for this time doing unpaid labor within the home. Because of their caregiving responsibilities, it is not surprising that parents of young children spend more time than the average worker on the combination of paid and unpaid labor. Compared with fathers of young children, mothers of young children spend significantly more total time on paid and household labor. With the exception of multiple jobholders, mothers with a child younger than 6 years old spend more time on paid and unpaid labor than fathers within every demographic group analyzed in this report.11
Women and mothers, however, are not more likely to have access to the full suite of work-supporting public policies that are necessary to help manage their responsibilities. As a result, working women—and especially working mothers—are among those hardest hit by a lack of work-family public policies. Work-family policies—such as access to paid family and medical leave, paid sick days, fair scheduling practices, workplace flexibility, and affordable child care—are not panaceas to the scheduling conflicts many working parents face, but they can go a long way toward ameliorating the untenable circumstances in which many working parents find themselves.
Working parents’ lived realities
Working families have a lot on their plates. Between responsibilities at work and caring for children and other family members—not to mention taking care of their own needs—most working parents are familiar with the feeling that there is too much to do and not enough hours in the day. While this is not a new phenomenon, as workforce demographics have changed over time, more families feel this time crunch today than in the previous generation.12 There have been changes to the gendered division of family care, but women remain disproportionately more likely than men to care for children and other family members. As a result, working mothers are especially likely to put in many hours at work and then return home to even more unpaid labor.
The nature of work has changed over time. While the percentage of workers reporting 40-hour work weeks is largely the same, the proportion of those reporting very long hours—defined as 49 hours or more per week—has increased from 13 percent in 1976 to 16.1 percent in 2017.13 Technological advances and the rise of the gig economy—where workers are hired to work on demand rather than having a traditional employment relationship—have also shifted the boundaries of work and blurred the line between work and other aspects of life for many.14 There has also been a significant shift in the makeup of the labor force over the past 40 years, with increasing numbers of women entering the paid labor force. This change has been largest for married white women, who were historically less likely to work outside of the home compared with women of color.15 As of 2017, women overall made up slightly more than half of the U.S. adult population as well as of all adults in their prime working ages of 25 to 64.16 And although women had lower labor force participation rates than men—70.9 percent for women ages 25 to 64 compared with 84.2 percent for men in 2017—their participation increased dramatically over the past several decades.17 In 1950, for example, only one-third of all women were in the labor force.18
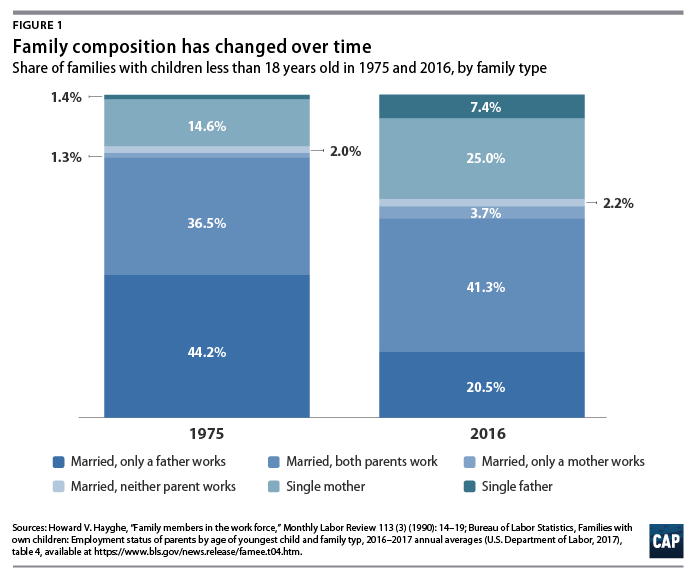
Family dynamics have been changing over time alongside changes in women’s—and particularly mother’s—labor force participation. In 1975, 84 percent of couples with minor children were married, compared with 67.6 percent in 2016.19 And in 1975, more than half, or 52.6 percent, of those married-couple families had a father who worked and a mother who stayed at home, while in 2016, less than one-third of married couples had this configuration.20 Single mothers were both less common in 1975—only 14.6 percent of all families with children compared with 25 percent in 2016—and were less likely to be in the labor force—59.9 percent versus 72.5 percent in 2016.21 All mothers, whether married or unmarried, have significantly increased their labor force participation rates since the 1970s, with mothers of very young children experiencing the largest increases.22
The majority of both male and female workers in the United States work full time, although women are more likely than men to have part-time positions.23 Women are twice as likely to work part time—24.4 percent compared with 12.1 percent of men—and make up the majority, or 64.1 percent, of part-time workers.24 Mothers whose youngest child is less than 6 years old are more likely to work part time than mothers of older children—26.3 percent compared with 22.1 percent.25 Rates of part-time work for fathers, however, are both lower overall and roughly the same regardless of their children’s ages—4.6 percent for fathers of young children compared with 4.4 percent for fathers of older children.26
Unsurprisingly, as mothers have increased their labor force participation and work hours, they have also increased their earnings and financial support to their families. Participation rates among women and mothers have increased for a number of reasons, including increased access to education and employment opportunities for women over the past several generations. One driving factor has been economic need, since many women have entered the labor force or increased their working hours in order to compensate for decades of stagnating wages for men across most of the U.S. economy.27 As of 2016—the latest year with available data—most mothers were either breadwinners earning the majority of their family’s income or co-breadwinners earning less than half but at least one-quarter of their families’ income.28 And rates are even higher for black and Hispanic mothers, driven in part by the fact that they are more likely to be single mothers and the sole income source for their households.29 The impacts of women’s increased work have been significant—and not just for individual families. If women had not increased their work hours from 1979 to 2012, U.S. gross domestic product in 2012 would have been 11 percent lower, with $1.7 trillion less economic output.30
Although most mothers work for pay and contribute significantly to their families’ incomes, working women earn less than working men on average—and wage inequality is even larger for working mothers. When the average wages of all women who work full time year-round are compared with the average wages of men working full time year-round, women earn 80.5 percent of what men earn.31 And if all men and women are compared using hourly wage data, regardless of whether they work full or part time, the wage gap amounts to 84 percent.32 The reasons behind this are complex, and parenthood has a significant negative impact on women’s wages—but not on men’s. Unmarried women without children earn 96 percent of what their male counterparts earn, while married women with a child at home earn only 76 percent of their male counterparts’ earnings.33
Because the majority of mothers work outside of the home for pay, families are less likely to have a full-time, stay-at-home caregiver.34 The work traditionally done by mothers at home, however, does not necessarily disappear. Employed women are more likely to return home at the end of their workday to what sociologist Arlie Hochschild has coined “the second shift,” which includes unpaid household labor such as cleaning, food preparation, and caregiving for children and other family members.35
Unpaid labor tends to receive less attention than paid employment, but it is vitally important. If this work is not done for free by family members, it must be outsourced at a cost. Take, for example, food preparation. Everyone has to eat, and when there is not a family member available to go grocery shopping and prepare meals, ready-to-eat meals must be purchased at a premium. Although somewhat tongue-in-cheek, Salary.com estimates that hiring someone to perform all the duties of a stay-at-home mother in 2016 would require a total annual salary of more than $143,000.36 Women’s housework and unpaid family care also provides the backdrop that supports men’s labor force participation, because when women in different-sex couples perform this labor, it frees up their partners’ time to engage in paid work.37 At one time this configuration may have worked for some families—particularly white, middle-class families—but this has never been the norm for all families. The fact remains that today, most women work for pay and still take on the majority of the second shift at home.38
It is also worth noting that when families outsource household labor, it is often to women of color and immigrants, who make up the majority of domestic workers and earn lower wages than their white counterparts.39 Domestic labor, while vital to the functioning of families, is devalued in American culture—whether it is unpaid work undertaken by family members or as a paid occupation.40 And while mothers’ unpaid household labor often supports fathers’ labor force participation, low-paid domestic labor helps to support the so-called work-life balance of high-income white women while largely denying those same benefits to low-wage female workers, who are disproportionately women of color.41
Virtually all working families—and indeed most single and childless working people—have at some point experienced a time when they felt there was too much to do and too few hours in the day. But this is not a universally felt experience. As previously mentioned, women take on more household and caregiving work than men. There is a culture of overworking in the United States, but very long work hours are not as common in other advanced economies.42 Among 38 Organisation for Economic Co-operation and Development (OECD) countries with available data, the United States ranks 10th in average weekly hours worked on the main job for workers ages 25 to 54.43 In 2017, the majority, or 76.3 percent, of workers in the United States were employed full time, which is defined as 35 hours or more per week.44 Most full-time workers report working 40 hours per week, but nearly one-third of full-time employees work more than 40 hours per week, with 8.6 percent reporting that they normally work 60 or more hours per week.45
The problem of long work hours is often framed as an issue that only highly paid professionals in occupations that require very long work hours face, and it is true that some high-paid jobs require very demanding work schedules. For example, full-time workers in management, business, and financial operations occupations work the most hours, with an average of 44.3 hours per week.46 However, research on average work hours found that in 2016, full-time, single jobholders earning more than $1,440 per week worked the same average number of hours as those earning $580 or less per week and that workers with earnings in the middle of that range put in more hours on average.47 Full-time workers in transportation and material-moving occupations work the second-highest number of hours per week at 43.4 hours in spite of earning median wages below the national average—$30,730 compared with a national median of $31,099.48
These numbers only focus on workers who are employed in one job, but 4.9 percent of workers in 2017 held multiple jobs.49 Among multiple jobholders, only about one-quarter, or 26.4 percent, work multiple part-time jobs.50 The remaining multiple jobholders work a part-time job in addition to holding down full-time employment, two full-time jobs, or multiple jobs where the hours vary.51 In addition, black men and women of all races and ethnicities are especially likely to be multiple jobholders.52 Juggling multiple jobs—especially those with variable schedules and hours—adds even greater complexity to workers’ available time.
Role overload versus role interference
Most workers, whether they work full or part time, will experience times when their obligations at work and in life outside of work are in conflict. One way to understand how work-life mismatches occur is to differentiate between role overload and role interference.53 When workers experience role overload, the aggregate responsibilities at work and at home are too time-consuming to allow workers to perform all of the necessary tasks, or at least to perform them all well. In this scenario, there is simply too much to do and too few hours in the day to get everything done. As a result, workers have to either postpone or refuse certain responsibilities. Role interference is related but refers to situations in which workers are either unable or struggle to fulfill multiple roles—such as employee and parent—because these roles often interfere with one another due to scheduling conflicts or competing expectations. Take, for example, a working parent who receives a call from their child’s school or daycare informing them that their child is sick and needs to be picked up at the same time that they are starting an important meeting at work. There is simply no way to be in two places at once, and that hypothetical worker is in a situation where they have to prioritize tasks. While some workers may have simple solutions for this and similar situations, those without access to work-family policies such as paid sick days, paid family and medical leave, and workplace flexibility—which includes fair scheduling—are often required to make choices between the wellbeing of themselves and their families as well as their income and job security. While working parents are the primary focus of this report, other categories of workers face similar challenges. Workers who hold multiple jobs, are enrolled in school, or have other responsibilities outside of work are also likely to experience role overload and role interference.
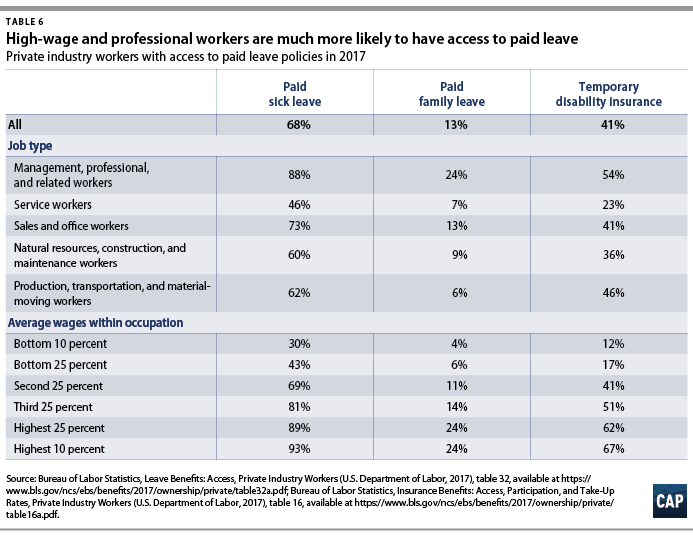
Unfortunately, too many workers do not have access to paid leave or flexibility to help them fulfill their roles as employees and family caregivers. Only 68 percent of private-industry workers have access to paid sick days, and not every company policy allows those days to be used for the care of ill family members.54 Furthermore, access is unevenly spread across workers, as 93 percent of workers employed in firms providing financial activities have access to paid sick leave, compared with only 35 percent of those providing accommodation and food services.55 Access to paid sick leave is also much more likely among workers who are highly paid within their occupations. The overwhelming majority—or 92 percent—of those who are in the highest 10 percent of earnings for their occupation have access to paid sick leave, compared with only 30 percent of those in the lowest earnings decile. Access to paid family leave is even less common, with only 13 percent of private-industry workers covered.56 Managerial and professional workers and people who are highly paid within their occupations are all much more likely to have access to paid family leave, but even then, less than one-third of these workers are covered.
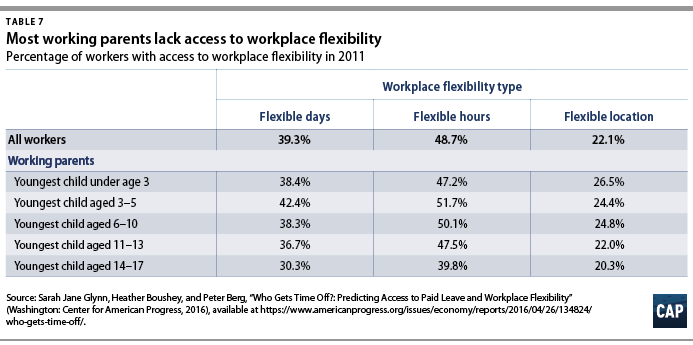
Workplace flexibility, which allows workers to change their schedule or work location, is similarly elusive for most workers. Less than half—or 48.7 percent—of all workers report access to flexible hours; only 4 in 10 have access to flexible days; and less than one-quarter have flexible work locations.57 Highly paid workers—those in the top earnings quintile—are actually less likely than those in the bottom quintile to have access to flexible workdays and are roughly equally likely to have flexible work hours, although they are by far the most likely to have a flexible work location. Much of this is likely due to the nature of their work: Shift workers, who tend to be lower-paid, are more likely to be able to swap schedules, while professionals are more likely to have jobs with tasks that can be completed from home.
This does not mean that workers in low-wage jobs have access to reasonable scheduling practices, nor does it mean that they have much control over their work schedules. “Just-in-time scheduling,” for example, adjusts workers’ hours based on fluctuations in retail traffic or other metrics for customer demand, resulting in unpredictable schedules.58 This means that workers’ scheduled shifts could end earlier than they were initially intended to, negatively affecting workers’ hourly wages. It also results in workplaces where employees must be available to work even though they may not be called in. Moreover, many workers in low-wage jobs have unstable schedules that change from week to week with no guarantee of how many hours they will be scheduled to work.59 In addition to causing uncertainty around wages, these scheduling practices make it difficult for workers who are enrolled in school, have family caregiving needs, or have a second job to plan ahead in order to meet all their responsibilities. White women and people of color—who are more likely to work in low-wage jobs with these scheduling practices—disproportionately feel these negative effects.60
Anecdotal evidence sometimes points to the possibility that people will self-select into the types of jobs that provide the benefits they need, and much has been made of the notion that parents—and mothers in particular—drop out of the labor force, scale back at work, or choose to take jobs that allow them the flexibility they need in order to care for their families.61 However, analysis of data on access to paid leave and workplace flexibility finds that working parents are no more likely to have jobs that provide paid sick leave or workplace flexibility compared with otherwise identical workers without children. In some instances, working parents may even be less likely to have flexible days or hours.62
While working parents are not the only workers to experience role overload and interference, it is undeniable that people with family caregiving responsibilities are likely to experience a lack of work-life integration at some point in their careers. For instance, the American Academy of Pediatrics recommends eight well-baby visits with a pediatrician in the first year of a child’s life, excluding any additional health-related doctor visits.63 Because most doctors’ offices are only open during normal business hours, working parents have to find ways to coordinate these important health checkups with their work schedules. And doctors’ appointments for healthy infants and children only represent one of the myriad reasons why workers may experience conflicts between their roles at work and outside of work. Workers with disabilities and those caring for others with disabilities also face similar issues.
Parents of children with complex medical needs are even more likely to find their work hours at odds with their parenting responsibilities. Role interference and overload are leading reasons why workers who live with a child with health problems are 48 percent more likely to experience lost wages, because addressing their child’s health needs often requires scaling back at work.64 However, access to paid leave that can be taken to care for a family member with health needs reduces the likelihood of lost wages by 30 percent, and having a supportive supervisor reduces the likelihood by 37 percent. Access to workplace supports can also reduce the frequency of future needs for time away from work, because parents of children with complex medical needs who have access to paid leave report positively on the physical and emotional health of their children as well as themselves.65 Although beyond the scope of this report due to a lack of available data and sample size constraints, workers who care for elders or other adults with disabilities also experience role overload and interference as well as the ensuing negative effects on their employment and economic security.66
It is clear that workplace policies such as different forms of paid leave and flexibility cannot solve all issues related to role overload and role interference, but they can go a long way to help. Many people are employed in jobs with long hours and demanding schedules or are juggling multiple jobs, and not all of them are highly paid. As this report details, working parents spend the majority of their time working, caring for their children, and performing household labor. This leaves little room for common life events such as illnesses, family caregiving emergencies, or other disruptions to the normal household schedule. Working parents’ lack of spare time illustrates how vital work-life policies are to enabling people to maintain their employment and income while addressing the unpredictability of modern life.
Data across the spectrum of working mothers and fathers
The analysis detailed in this report is derived using data from the American Time Use Survey (ATUS).67 The ATUS is sponsored by the Bureau of Labor Statistics and has been collected by the U.S. Census Bureau annually since 2003. Data consist of time-use records collected from households that have completed their final month of the Current Population Survey. Respondents must be at least 15 years of age and are randomly selected from within households that have been identified as eligible based on demographic characteristics. Each ATUS respondent provides a detailed time diary accounting of how they spent a 24-hour period. Time-use data for this research are limited to respondents who are 18 to 64 years old, currently employed, and not enrolled in school. Unless otherwise noted, all analysis related to time use is from days when respondents reported spending at least some time working. In order to obtain adequate sample sizes, data are pooled from 2011 through 2016. Even with data pooling, some variables—most notably those for black parents—were overall small and therefore could not be included for analysis on some time-use activities.
Work hours
The data analyzed here are from workers whose normal schedules include both part- and full-time work.68 (see Table 1) The time variable captured here includes time spent working, on work-related activities, and on work-related travel. Overall, people of color work longer hours compared with whites, and although the differences on a given day are small, they are statistically significant. Differences in work hours across the earnings distribution are also statistically significant but small in scope. Workers in the second earnings quintile work an average of 0.28 hours, or 17 minutes, less per day than those in the highest earnings quintile; while they are working in different types of jobs with very different pay scales, their work hours are similarly long.69 (see Appendix A for the conversions of fractions of hours to minutes) Family income also has a statistically significant but overall small relationship to work hours. Workers in families earning less than $25,000 per year work an average of 20 minutes less per day than workers whose families earn more than $100,000 per year.70 Again, low-income workers earn less money, but they are not trading wages for significantly more free time. As would be expected, those who work part time put in fewer hours compared with full-time workers, and workers with multiple jobs work longer hours than those with only one.
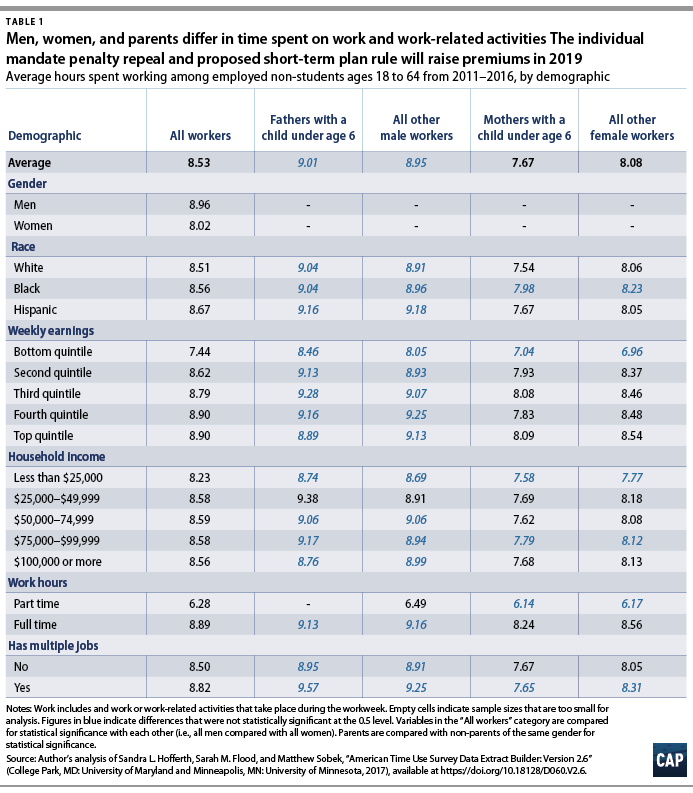
Despite the fact that women—and specifically mothers—are more likely to work part time, on average most working women put in full-time equivalent hours on the days that they report work and work-related activities.71 Women work fewer hours on average than men, and mothers whose youngest child is under age 6 put in fewer hours than other women, including those without young children and women whose youngest child is age 6 or older. The reverse is also true for fathers of children below school age, who do not work significantly different hours than other men.
Across the variables analyzed here, being the parent of a young child in the home has less of an impact on men’s work hours than it does on women’s. When compared with other men in the same earnings quintile, differences are not statistically significant. Fathers of children under age 6 in families earning between $25,000 and $49,999 per year work more hours per day than other men, but there are no significant differences between those in higher- or lower-earning families.72 When men are compared by work hours and being a single or multiple jobholder, there are no significant differences between fathers of young children and other men.
Overall, black and Hispanic workers work longer hours when compared with whites, and the effects of these long hours are particularly strong for black mothers of young children and all other black women. Being a mother of a young child significantly reduces working hours for white and Hispanic women—but not for black women, who continue to work the longest hours of any racial or ethnic group regardless of parental status or the age of their children.73 Part of this may be due to the fact that black mothers are more likely to be unmarried and that black workers experience significantly higher unemployment levels, both of which could result in black working mothers being less likely to have a second wage earner in the home.74 This finding is striking given the persistence of the racial wage gap, as black women who are full-time wage and salary earners make 17.2 percent less than white women.75 This indicates that while black women are working more hours, they are in lower-paying jobs that are less likely to provide benefits such as flexibility and paid leave.
Mothers of young children in the lowest earnings quintile do not have different average work hours than other women, but in every other earnings quintile they work less. Family income has a less clear connection to motherhood and work hours, with mothers of children under age 6 working fewer hours in families earning from $25,000 to $74,000 per year as well as those earning more than $100,000 annually. Among full-time workers there are statistically significant differences in work hours, although not for those working part time. And while there are differences in work hours between women who have only one job, differences were not statistically significant for multiple jobholders.76
Household activities
In addition to their time spent working for pay, workers generally also have responsibilities at home to cook, clean, and take care of the day-to-day aspects of life. This second shift only increases for families with children, especially those with young children who are not yet old enough to help with household chores. While certain families are able to outsource some of this labor—for example, by hiring professionals to clean or by purchasing ready-made meals—many families do not have the resources to do so. Despite spending most of their waking hours working, these people must find time to perform these tasks themselves.
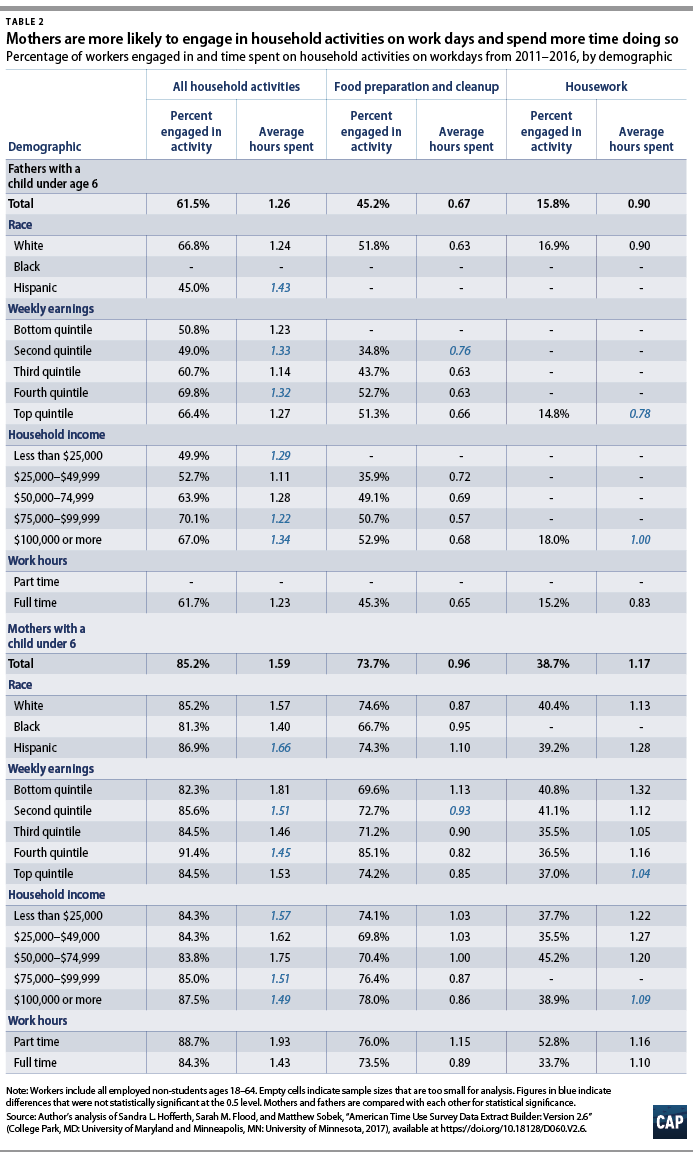
Not all tasks require daily attention; in most instances, meals need to be acquired multiple times a day, while cleaning the bathroom happens less frequently. Table 2 shows the percentage of parents with children under age 6 who perform different household activities on days when they also work as well as the amount of time spent on these activities for those who reported performing them on the survey day. In the vast majority of cases, there are not statistically significant differences between workers of the same gender based on parental status, meaning that the percentage of mothers of young children who report performing household activities and the time spent on them does not differ significantly from the percentage of other women.77 There are, however, significant differences across gender lines, with men and women and mothers and fathers reporting very different household responsibilities.
Notably, while the time use differences between mothers and fathers of children under age 6 are not all significant, all of the percentages of those reporting household work are. So, while in some cases mothers and fathers report spending the same amount of time on a task such as housework on days when they engage in that aspect of the second shift, in all instances mothers are significantly more likely to be doing that type of work on any given working day.78 Importantly, all of the analysis detailed in this section relates to time use on days when the respondent also reports working for pay. The numbers provided here only relate to the second shift of housework that occurs in addition to working for pay on a given day—not household work that is completed on days off from work.
When all household activities are included together, mothers of young children are both more likely to report this work than fathers—85.2 percent compared with 61.5 percent—and spend more time on these activities—1.59 hours compared with 1.26 hours.79 This catchall category includes everything from doing laundry to home maintenance, paying bills, mowing the lawn, and changing the oil in the family car. Previous analysis by the Bureau of Labor Statistics shows that while women overall do more household activities than men, there are some categories where that pattern is reversed.80 However, men tend to do more than women in categories where the work is episodic rather than ongoing. For example, men report spending more time on home maintenance, repair, and decorating and caring for the lawn, garden, or houseplants. But these are tasks that are performed less frequently, on average, than tasks such as food preparation or laundry—which women are much more likely to do.
The same patterns hold true for mothers and fathers when looking at some of the most common forms of household work, such as food preparation and cleanup—on which 73.7 percent of mothers spend an average of 0.96 hours versus 45.2 percent of fathers who spend an average of 0.67 hours—and housework—on which 38.7 percent of mothers spend an average of 1.17 hours versus 15.8 percent of fathers who spend an average of 0.90 hours.81 In fact, along many of the demographic breakdowns, fathers’ involvement in food preparation and housework on days when they also worked is so uncommon that sample sizes are too small for analysis.82 Some of these small sample sizes, for example those broken down by race, should be understood in the context of overall smaller sample sizes rather than as only reflecting the actions of fathers.
It is also necessary to examine the percentage of those engaging in household activities alongside the time they spend doing so. For example, the rates of participation in food preparation and cleanup increase with fathers’ earnings and family income, but the amount of time they spend on these tasks decreases.83 Rates among mothers exhibit a similar pattern, although the effects are smaller. This may indicate different patterns in available time to prepare food. For example, if lower-earning parents and those in lower-income families are less likely to have time to cook every day, then they may be more likely to prepare multiple meals for the future on days when they do have free time.
Fathers’ engagement in housework shows even lower levels of participation on working days, and the majority of sample sizes are too small for analyses—even in groups with larger total sample sizes such as those by earnings and family income. Overall, mothers are more than twice as likely to also do housework on days when they work for pay—38.7 percent compared with 15.8 percent of men—and they spend significantly more time when doing so—1.17 hours versus 0.90 hours for men.84
When comparing mothers of young children with each other, lower-earning mothers are more likely to do housework and spend more time doing so on average.85 This may reflect that lower-earning mothers are more likely to work part time and report shorter work hours than higher-earning women and thus have more time available for housework. (see Table 1) Mothers who work part time are more likely than full-time working mothers to report doing housework on work days, although the two groups spend roughly the same amount of time on these tasks.86 It is possible that higher-earning women have a greater financial ability to outsource housework, but the differences by family income do not support this interpretation.
While the patterns in household activities within genders cannot be fully explained by the available data and are thus open to interpretation, the overall theme is clear: The overwhelming majority of working mothers of young children engage in the second shift of unpaid household labor on days when they also work for pay, and they do so at rates and with time investments that far exceed those of working fathers.
Caregiving
Unpaid household labor is not the only form of work that is performed within families; it also includes caregiving for family members. In this analysis, primary care for children includes the time spent that is mainly devoted to caring for a child. This includes activities such as feeding, bathing, playing with, or reading to a child, in addition to any child care-related travel. Secondary child care refers to the time that is spent caring for a child while simultaneously performing another activity—what many would describe as multitasking. Secondary child care is most commonly reported when respondents are also engaged in leisure or household activities.87 Unsurprisingly, families with children under the age of 6 are very likely to engage in both primary and secondary child care on workdays, as children in this age range need more supervision and care relative to older children. Children are not the only family members who require care; working parents are also caring for their own aging parents or other family or community members with disabilities or elder care needs. The data presented here, while only focusing on care for children due to data limitations, likely underestimate the total amount of time spent providing family care.
Although the majority of parents—both mothers and fathers—report engaging in primary or secondary child care on days when they also work for pay, not all do. Some of this may reflect respondents who have children living with them who were not in their care on the survey day, such as if a child had been with their noncustodial parent in the case of single-parent households.88 And because the data presented here only reflect time use on days when respondents worked for pay, there may be cases where a parent’s workday started before their child awoke and ended after their child went to bed—a case which is more likely for parents with long work hours and very young children.
While most parents report both primary and secondary child care, there are stark differences in the percentages of and time spent between mothers and fathers. With the exception of secondary child care provision for multiple jobholders, across every other demographic measured here mothers were significantly more likely to provide both primary and secondary care on workdays. Overall, 91.2 percent of mothers of young children reported engaging in primary care and 94.6 reported secondary care, compared with 71.7 percent of fathers providing primary care and 83.5 percent providing secondary care.89 (see Table 3)
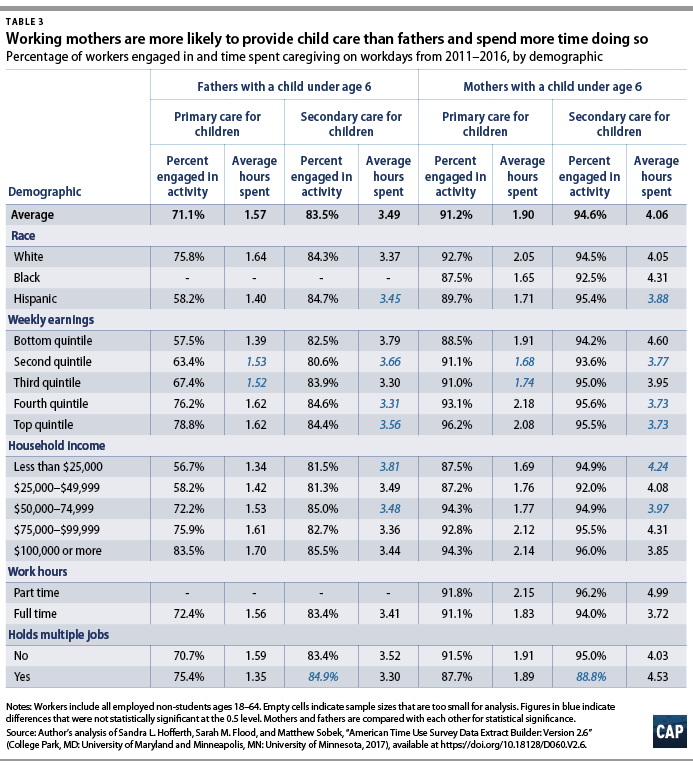
Mothers’ provision of primary care was high across all demographic groups and in no instances fell below 87 percent.90 Fathers, on the other hand, never reached this level of participation in primary care provision across any of the groups measured here.91 Particularly striking are the differences in fathers’ provision of primary care across earnings and family income. High-earning fathers and fathers in high-income families were much more likely to engage in primary caregiving and to spend more time when doing so.92 The same pattern emerges, although with smaller differences, among mothers of young children.93
Rather than reflecting the desired engagement of parents in their children’s care, this finding suggests that there may be something about lower-earning workers’ work schedules that is preventing them from spending more time with their children. A Pew Research Center survey conducted in 2017 found that close to two-thirds of fathers, or 63 percent, reported that they feel they spend too little time with their children, and of those, the majority said that work obligations were the reason for this lack of time.94 If higher-income parents in professional jobs, for example, are more likely to have schedules that allow them to pause their work to spend time with their children in the evening and then return to work after their children have gone to bed, this could help to explain at least some of the difference in findings outlined here. Previous analyses have found that higher-income workers and those in professional and managerial jobs are much more likely to work from home on any given day, lending further support to this possible interpretation.95
All fathers of young children and most mothers are more likely to report providing secondary child care rather than primary caregiving, although the differences are much smaller for women than for men.96 And all parents who report providing care to children spend more time on secondary than primary care, which reflects the busyness of working parents’ lives. In every group except multiple jobholders, mothers report significantly more secondary care provision than fathers. However, when parents do provide secondary care—which most do on work days—not all of the differences in the amount of time spent are significantly different.
Patterns by earnings and family income tell a slightly different story when comparing parents’ time spent on secondary child care. Again, higher-earners and higher-income families spend slightly more time on secondary care, although the differences for both mothers and fathers are small.97 Also, the lowest-earning mothers and fathers and those from the lowest-income families report spending the most time on secondary child care when it is performed. This again points to the possibility of different scheduling constraints for lower-wage workers and families, since the data show that they are more likely to be multitasking when caring for their children.
Leisure
Most workers do not spend all of their waking hours working for pay or doing household labor, and the majority spend at least some time on workdays engaged in leisure behaviors. This includes activities such as socializing, watching television, listening to music, and attending arts, cultural, and entertainment events. Overall, workers spend about three hours per day on leisure activities, and slightly more than one of these hours are spent engaging in these activities without the presence of others.98 (see Table 4)
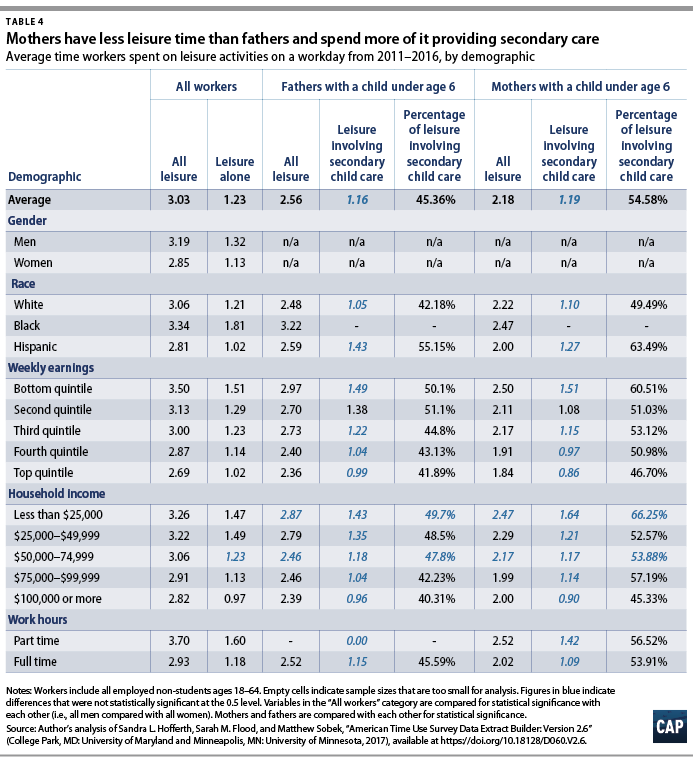
Parents of children under age 6 spend less time on leisure compared with workers overall, with mothers having less leisure time than fathers. All parents spend the majority of their leisure time providing secondary child care, and in most cases, mothers spend an even larger percentage of their leisure time also providing care.99
On average, fathers have more leisure time than mothers. Fathers spend an average of 0.38 hours, or 23 minutes, more on leisure compared with mothers. They also spend a lower percentage of their leisure hours providing secondary child care—71.73 percent compared with 76.74 percent for mothers.100 Fathers have on average 0.73 hours, or 44 minutes, of leisure time per day that is not spent also caring for children, while mothers have only 0.51 hours, or 31 minutes, per day.
With the exception of parents in families earning less than $25,000 annually and those earning between from $50,000 to $74,999, mothers have significantly less leisure time than fathers.101 While there are other demographics of mothers and fathers who spend roughly the same amount of leisure time providing secondary care, with the exception of the family income groups mentioned previously, the percentage of mothers’ leisure time spent providing care is significantly higher. In short, mothers of young children both have less leisure time than fathers and spend more of it also caring for their children in some capacity.
Parents who are in lower earnings quintiles and those in families with lower incomes have more leisure time, which may reflect the shorter working hours outlined in Table 1. However, they also spend a higher percentage of those leisure hours caring for their children, relative to their higher-earning and higher-income peers. This reflects the findings in Table 3, which show that lower-earning working parents and those in lower-income families spent more time on secondary child care regardless of the primary activity taking place at the same time. The exception to this comes when comparing mothers in the lowest earnings quintile with those in the two highest earnings quintiles. Although the lowest-earning mothers have more leisure time—again, likely due to their shorter average working hours—the percentage of leisure time they spend providing secondary care is roughly equal to that of the highest earners.102 This may be a reflection of the high cost of child care and a lack of workplace flexibility rather than family preferences. For example, some low-wage working parents—usually mothers—may be forced to scale back their work hours because the cost of child care is higher than their earnings. They then may appear to have more leisure time—not because they do not want to work, but because a lack of family-friendly policies prevents them from working longer hours.
None of the demographic groupings of mothers detailed here had more noncaregiving leisure time than men, and white mothers had the most at 0.66 hours, or 40 minutes, per workday.103 Most fathers had more noncaregiving leisure time than white mothers, with fathers in families earning more than $100,000 annually clocking in the most at 0.99 hours, or 59 minutes, per workday.104 While all working parents spend the majority of their time on paid or unpaid labor, women and mothers have the least solo leisure time, with mothers of young children having very little time truly to themselves.
Total time
Up until this point, the analyses on time use presented in this report have looked at different categories of activities in isolation. But it is also helpful to combine time use over the course of an entire survey day in order to determine how much of working parents’ time is spent on the combination of paid labor and unpaid household and caregiving work that makes up the second shift.
On days when they work, all workers spend the majority of their waking hours on paid labor or household labor. Across the entire population of workers ages 18 to 64, there are no statistically significant differences in the hours spent on work and the second shift between men and women. (see Table 5 and Figure 1) This means that while working women do put in slightly fewer hours at work overall, they make up for that time by engaging in disproportionately more of the second shift at home. Hispanic workers spend the most time engaged in paid and unpaid labor, and Hispanic women overall spend the most time on paid work and the second shift.105
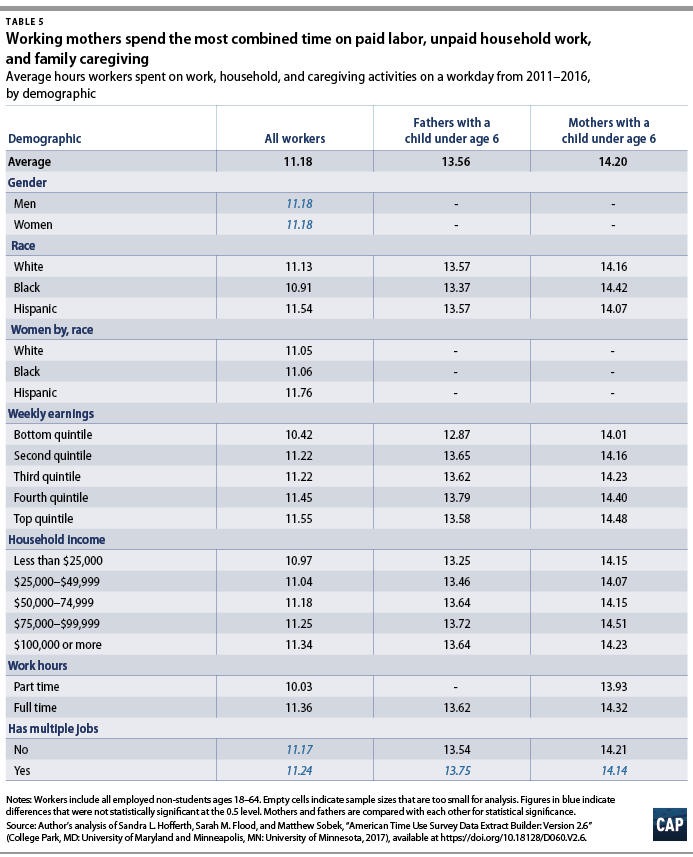
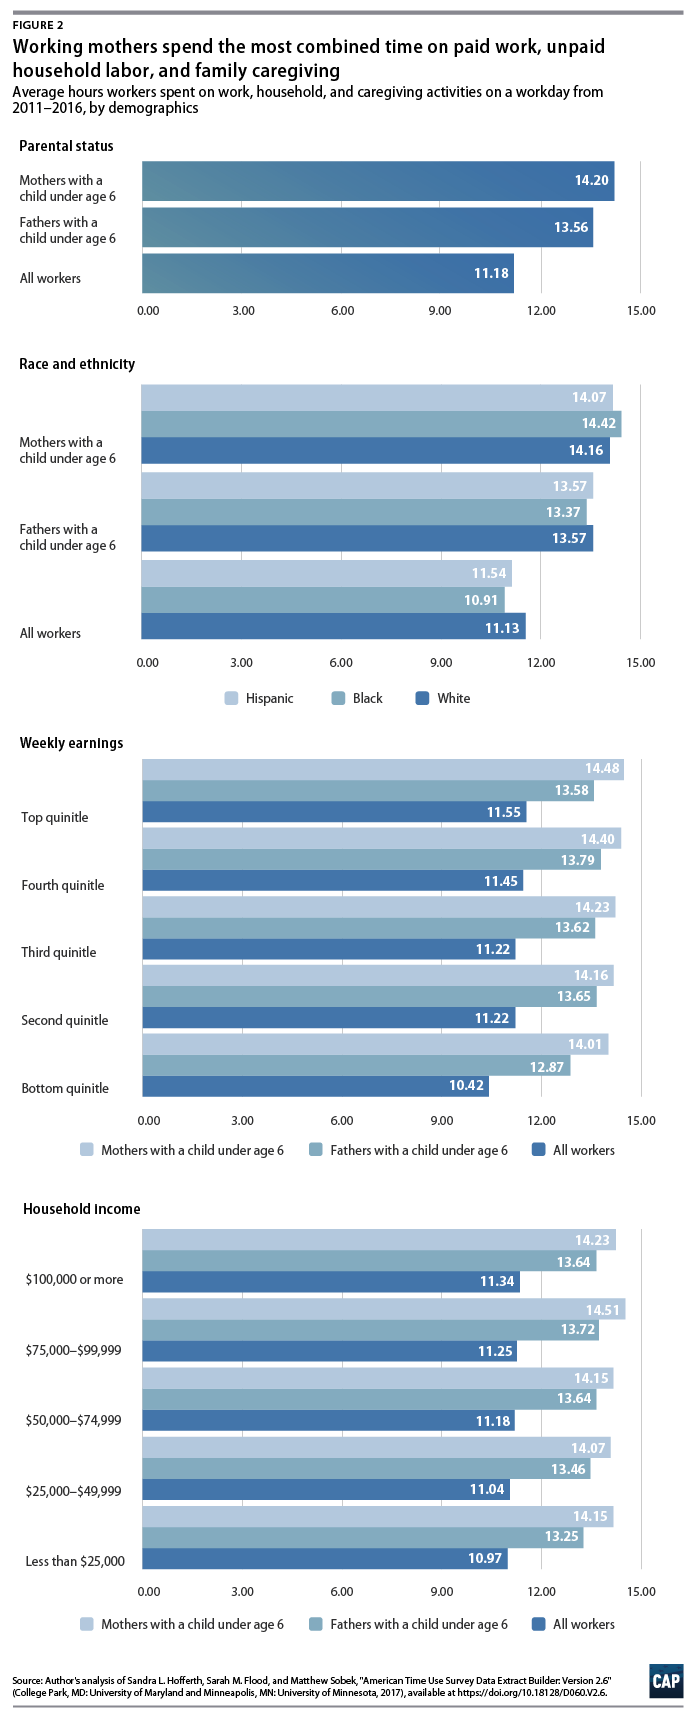
Total time spent on paid and unpaid labor increases with average weekly earnings and family income, which is a reflection of these groups’ longer working hours. For example, the difference in total time spent between those in the top earnings quintile and the lowest earnings quintile is 1.13 hours, while the difference in time spent on paid work between the two groups is 1.46 hours.106 (see Tables 1 and 5) Unsurprisingly, full-time workers spend more time in total on paid and unpaid labor compared with those who work part time, although there is no statistically significant difference in total time spent between single and multiple jobholders.
Parents spend more time than the average worker on paid and unpaid labor because in addition to work and household activities, they are likely to spend a significant amount of time caring for their children.107 The significance levels indicated in Table 5 are for mothers of children under age 6 compared with fathers of children under age 6 within each variable. In addition, mothers spend more time on paid work and the second shift than fathers within every group analyzed here, with the exception of multiple jobholders.
When mothers are compared with each other, their total time use differences are not statistically significant by race and ethnicity, average weekly earnings quintile, family income, or whether they are single or multiple jobholders.108 The only significant differences between mothers are between those who work part and full time. Fathers do not significantly differ from one another by race and ethnicity or family income, but they do show statistically significant results when compared by weekly earnings and whether or not they hold multiple jobs.
This means that while all mothers spend more time on paid labor and the second shift on average than fathers, mothers do not differ much from one another regardless of how they are characterized—with the exception of those who work part time compared with full time.109 While fathers’ total time use differs by weekly earnings, the only significant difference is between those in the bottom quintile and those above it; there are no statistically significant differences when comparing fathers in the top four earnings quintiles.110 Overall, most fathers’ total time use is very similar, as is most mothers’. The primary significant differences only emerge when comparing across gender.
Policy implications
As the data presented in this report make clear, working parents spend most of their time engaging both in the types of work that earn a paycheck and in the unpaid household labor and caregiving that is necessary to raise their families. Given the limited number of hours in each day and the time-consuming nature of these responsibilities, it is virtually inevitable that most working parents will experience role overload and role interference during their work lives.
While many workers may be able to find enough time to manage their responsibilities as parents to their children on the average day, what happens on the abnormal day? If a working parent gets sick—either with a common illness such as the flu or with something more serious—how does all the work get done? What if a child or another family member is sick and needs care, or a new baby is brought into the family? Even a situation such as the furnace breaking and needing to wait at home for a repairperson can have detrimental effects for working parents, who would need to figure out a way to be in two places at once. These common life events do not necessarily have to result in negative outcomes, but unfortunately few workers have access to the types of workplace policies that can help to prevent role interference and role overload.
Paid leave policies
Overall very few workers have access to the full suite of paid leave policies that would help to address the range of reasons why an individual may temporarily be unable to work. (see Table 6) Although there have been steady increases in access over the years—largely driven by policy changes at the state level—only about two-thirds, or 68 percent, of all workers have access to paid sick leave.111 Managerial and professional workers are by far the most likely to have access, while service workers who routinely interact with the public are the least likely to be able to take a day off from work if they become sick without losing pay or potentially losing their jobs. And less than one-third, or 30 percent, of workers who are in the bottom 10 percent of earnings for their occupation have paid sick leave, compared with more than 9 in 10 of those in the highest decile of earnings. Access to paid family leave is far more limited, with only 13 percent of private-sector workers covered.112 And only about one-quarter of professional and managerial workers and of those in the highest earnings decile for their occupations are covered by paid family leave policies. Access to temporary disability insurance, which covers workers if they are physically unable to work for a temporary period of time, is only available to 41 percent of all workers. Once again, those in professional or managerial jobs or those who are in the highest earnings decile are more likely to be covered by these policies—54 percent and 67 percent, respectively.113
As of February 2018, 10 states, the District of Columbia, and 32 U.S. cities and counties have enacted paid sick leave laws.114 These policies allow workers to accrue paid time off that can be taken if they or a family member are ill, need to access medical care, or, in some cases, need time to recover and address domestic or sexual violence. While this is notable progress since 2006, when San Francisco passed the first paid sick days law, universal coverage is needed.115 The Healthy Families Act, introduced in Congress by Rep. Rosa DeLauro (D-CT) and Sen. Patty Murray (D-WA), would allow workers to earn one hour of sick leave for every 30 hours worked—and up to 56 hours of leave per year.116
The federal Family and Medical Leave Act of 1993 (FMLA) provides up to 12 weeks of unpaid, job-protected leave each year to qualifying workers after the birth or adoption of a child; to recover from their own serious medical condition; or to care for a close family member with a serious health condition.117 However, because workers are only covered if they work for an employer with 50 or more employees, have been employed there for at least 12 months, and have worked a minimum of 1,250 hours in the previous year, 41 percent of workers are excluded from this job protection.118 There is also no requirement that leave for qualifying workers is paid, which excludes many workers from being able to afford to take time off when they need to.
Although current federal policy does not guarantee the right to paid family and medical leave, five states—including California, New Jersey, Rhode Island, New York, and Washington—and the District of Columbia have passed laws to create paid family leave programs. Washington and the District of Columbia’s programs, however, will not start paying benefits until 2020.119 These state policies have significantly benefited women—who the data show do the majority of family caregiving—but they also have the potential to shift gender dynamics within different-sex households. Men have increased their parental leave-taking rates in the states with paid leave policies in place, and fathers who take parental leave have been shown to be more active participants in their children’s lives as they grow up.120 The passage of a comprehensive national program would help to extend these benefits to families living in the 45 states without paid leave policies. The Family And Medical Insurance Leave (FAMILY) Act introduced in Congress by Sen. Kirsten Gillibrand (D-NY) and Rep. DeLauro would create a national, gender-neutral social insurance program to provide up to 12 weeks of paid leave for the same conditions qualified under the FMLA.121 The program would provide two-thirds of a workers’ wages, allowing those who currently cannot afford to take unpaid leave the opportunity to meet their own health needs or their family caregiving obligations.
In order to actually benefit working families, the creation of a national paid leave program needs to match the realities of workers’ caregiving needs. Any serious paid leave proposal should cover a comprehensive set of reasons why workers may need time away from work, including parental leave, family caregiving leave, and personal medical leave.122 The Trump administration has proposed the creation of a federal paid parental leave-only program that would provide up to six weeks of leave to parents through states’ unemployment insurance systems.123 Unfortunately, this plan has a number of significant problems. It is underfunded, administratively unsustainable, and far too limited in scope, providing paid leave only after the arrival of a new child while ignoring other reasons why workers may need leave.124 In addition to ensuring that workers have access to paid leave for reasons other than the arrival of a new child, family caregiving leaves must reflect the kinship ties in people’s lives. Including paid leave for chosen family in addition to blood-related family members and those with legal ties can help to ensure that paid leave policies are addressing the needs of all workers.125
Fair scheduling and workplace flexibility
Access to workplace flexibility—which allows individuals to change the days, hours, or location of their work—is also uncommon. Among all workers, slightly more than one-third have flexible days; less than half have flexible hours; and less than one-quarter have flexible work locations.126 (see Table 7) Parents are no more likely to have access to workplace flexibility than otherwise comparable workers without children, and in some cases they are less likely to have flexible days or hours.127
Right-to-request laws allow workers to request workplace flexibility and scheduling predictability while protecting them from potential retaliation or discrimination from their employer. Right-to-request laws are currently in place in Vermont, San Francisco and Berkeley, California, and New York City.128 The Schedules That Work Act introduced by Sen. Elizabeth Warren (D-MA) and Rep. DeLauro would extend these worker protections to those living in the rest of the country.129 The bill would provide workers with the ability to request changes from their employer regarding: the hours and times they are required to work or be on call; the location where they work; the amount of notification they receive on their work schedule; and minimizing variability in the number of hours they are scheduled to work daily, weekly, or monthly. Workers could make these requests to address their own serious health conditions or caregiving responsibilities or if they are enrolled in career-related education or training programs or are part-time workers with a second job. Employers would be required to approach these requests in good faith and to grant them unless there were a valid business reason not to. The bill would also provide protections to workers whose schedules change with short notice or require being on call by providing wages to workers whose shifts are cut short, who are required to call in to confirm shifts, and who work split shifts.130
Child care
Working people need access to paid leave and flexibility when they have their own health concerns or to address caregiving needs, but parents also need access to affordable, high-quality child care in order maintain employment. When parents lack access to high-quality, affordable, and reliable child care, it negatively affects their ability to hold a job and to meet all of their responsibilities at work. Research by economist Guillermo Montes and Dr. Jill Halterman, M.D. found that nearly half, or 46 percent, of households with children headed by at least one working parent reported child care-related employment changes.131 The most common reasons included missing work and having to change their work schedule, at 21.4 percent and 27.3 percent, respectively. Parents of color and parents of children with behavioral or chronic health problems were all significantly more likely to experience child care-related employment issues. More recent research conducted by the Center for American Progress found that in 2016, close to 2 million parents with children under age 6 had to turn down a job offer, quit their job, or make significant changes to their job due to child care-related conflicts.132
In addition to the wealth of benefits of high-quality early care and education for children, access to child care is vital to parents’ ability to maintain their employment.133 Unfortunately, high-quality, reliable child care is prohibitively expensive for many working families. The average price of annual tuition in a child care center for two children in 2016 was higher than the average mortgage payment in 35 states and the District of Columbia, and the average cost of center-based care for an infant was higher than the tuition at a four-year public college in 25 states and the District of Columbia.134
The Child Care for Working Families Act introduced this Congress by Sen. Murray and Rep. Bobby Scott (D-VA) would help to reform the current child care landscape and make quality care more accessible to families.135 The bill would guarantee access to child care assistance to families earning up to 150 percent of their state’s median income—more than doubling the number of children eligible for assistance. It would also limit payments for child care to no more than 7 percent of family income, based on the U.S. Department of Health and Human Services’ definition of affordable child care. It would provide a living wage to child care providers while making improvements to child care quality and increasing the availability of care providers in underserved communities. CAP analysis of the bill’s impact estimates that the passage of this child care legislation would result in 1.6 million parents being able to enter the labor force.136
Wage protections
Although the majority of this report focuses on issues of work-life interference, the data also show that work hours are not significantly different between most workers regardless of their earnings level.137 This means that increasing labor supply by working longer hours is not necessarily a pathway to higher incomes for most workers. Addressing wage inequality thus requires additional steps beyond simply expecting workers to put in longer hours in order to take home higher pay.
Raise the federal minimum wage
One way to help boost wages for low-income workers would be to raise the federal minimum wage, which would have a disproportionate positive impact on women, as they make up the majority of minimum-wage workers.138 Increasing the minimum wage to $12 an hour would result in 30 percent of all working women receiving a pay raise.139 Because the positive effects of increasing the minimum wage impact women the most, the Obama administration estimated that raising it to only $10.10 an hour would narrow the wage gap by 5 percent.140 The Raise the Wage Act introduced this Congress by Sen. Bernie Sanders (I-VT) and Rep. Scott would raise the federal minimum wage to $15 per hour, which would have an even larger impact on the earnings of working women.141 While federal action has been slow, as of January 1, 2018, 29 states and the District of Columbia had minimum wages higher than the federal level.142
Raising the minimum wage is not the only way to increase wage protections for workers. Full implementation of the Obama-era overtime expansion rule, which would raise the minimum salary for exempt workers to $47,476, would also benefit women—and particularly working mothers—as they make up the majority of workers who would be affected.143 Full implementation of the overtime rule would benefit one-quarter of all mothers and close to one-third of all single mothers.144 However, implementation has been halted due to state- and business-led legal challenges, and the issue is currently on hold while the U.S. Department of Labor (DOL)—now under the Trump administration—undertakes new additional rulemaking.145 Although most states follow DOL-set national standards, some states have passed legislation to raise thresholds for overtime eligibility. California, for example, has set their threshold at $45,760 for salaried workers, and the salary limit is tied to the state minimum wage in order to prevent their decoupling.146
Address the gender wage gap
Finally, because all working women—but especially working mothers—experience significant wage inequality compared with men, further steps are necessary to address the gender wage gap. The causes of the wage gap are complicated, and a broad set of public policies are necessary in order to fully and adequately address the issue.147 These range from the work-family policies outlined in this report to better wage protections and to changes in education and workforce investments. Part of the equation also involves improving public policies to address discrimination against white women and people of color, who are likely to experience worse labor force outcomes and lower wages compared with white men.
The Paycheck Fairness Act introduced by Sen. Murray and Rep. DeLauro would require employers to prove that any differences in pay are due to business-related factors; would protect workers who discuss their pay with others at work; and would allow people who have been discriminated against to collect compensatory and punitive damages.148 The bill would also establish greater data collection within the federal government on wage inequality, including requiring employers to provide wage data disaggregated by gender to the Equal Employment Opportunity Commission (EEOC). Under the Obama administration in 2016, the EEOC announced that beginning in 2018 it would collect summary pay data and aggregate hours worked for full- and part-time workers by gender, race, and ethnicity from large employers with more than 100 employees.149 The information was intended to be used to help improve the EEOC’s future investigations into gender, racial, and ethnic pay discrimination. The Trump administration, however, issued a stay on this effort in 2017—before any data collection ever began.150 At this time, no further public action from the administration on the issue of data collection pertinent to racial and ethnic employment discrimination has been made.
While not technically a wage protection, modifying and strengthening the Child Tax Credit (CTC), which currently provides a tax credit of up to $1,000 per child younger than age 17, would also provide significant relief to many working parents.151 The current CTC has a minimum earnings requirement and is not fully refundable, which prevents very low-income families or many of those who have experienced unemployment spells from utilizing it. It is also not tied to inflation, meaning that it loses significant value over time without congressional action to increase it. Eliminating the minimum earnings requirement and making the CTC fully refundable, indexing its value to inflation, and supplementing the CTC with a Young Child Tax Credit of $125 per month for children younger than age 3, would all help to ensure that the CTC maintains and increases its ability to reduce poverty and promote economic mobility for working families.152
All of the policies outlined here—for paid sick days, paid family and medical leave, and greater child care investments—would help to address the needs of working families who experience role overload and role interference as a result of their dual responsibilities at work and at home. The current policy landscape could be better described as a lack of national public policy interventions. Investing in working parents—who made up 57.4 percent of all workers in 2016—will benefit not only individual families, but also the economy overall.153
Conclusion
Working parents are strapped for time and have limited access to the workplace policies that would help them when they are confronted with role overload and role interference. But this is not an inevitable state of affairs. To be very clear, the dearth of work-family public policies in the United States is not the norm among other advanced economies, and the lack of sensible and proven policy solutions is part of the reason why the United States’ rate of labor force participation among women has fallen over time when compared with other OECD countries.154
Women in America have increased their labor force participation and work hours over time, and as this report shows, the total time investments in paid and unpaid labor by mothers of young children exceed those of fathers. But because paid employment is often viewed as more valuable than unpaid household and caregiving labor, women’s investments in their families and the economy tend to be given short shrift. Importantly, on average, most men would not be able to put in longer hours in paid work if there were not a woman taking on the majority of the duties at home—in essence working a second shift without pay.155 Equity in the workplace will not be possible until there is also equity within the home. There are complex sociocultural reasons that impact gendered dynamics within families, but public policies can make a difference in helping to alleviate some of the burden on working women while increasing family caregiving opportunities for men.
Some private-sector employers currently choose to voluntarily offer these benefits, but they are unevenly applied, and often even so-called high-road employers choose to offer them to some types of workers and not others.156 Public policies are necessary to level the playing field and to help change the culture of work in the United States. Many states are already moving in this direction and showing positive results for working families. California’s paid family leave program, for example, has resulted in a 10 percent to 17 percent increase in the work hours of mothers with a child from the ages of 1 to 3—likely because they are more able to juggle their responsibilities when they have access to paid leave—and there are indications that their wages may have increased by a similar percentage.157 San Francisco recently enacted a law that requires employers to top off state paid leave benefits to bring workers’ wage replacement up to 100 percent of their normal wages, resulting in a 28 percent increase in the rate of fathers taking parental leave.158 In addition to a host of business and public health benefits, access to paid sick days significantly decreases the likelihood of job separation for workers and is particularly beneficial to working caregivers.159 And while most state fair scheduling laws are too recent for analysis, a survey of San Francisco’s policy, which took effect in 2016, has found that while there have been challenges to fully implementing the law, many covered retail workers report that predictable scheduling has a positive impact on their ability to plan their lives.160
While state and local policies demonstrate the benefits of work-family policy interventions, national legislation is necessary to ensure that workers across the country have equitable access to the workplace policies they need to meet their responsibilities without having to choose between their families and their jobs. Sensible legislation to start addressing the needs of working families has already been introduced this Congress. Members of Congress and the current administration should take the necessary steps to make these policies a reality for the millions of working families who desperately need them.
Appendix
About the author
Sarah Jane Glynn is a sociologist and expert in work-family policies, gender wage inequality, and family economic security. She is currently a senior fellow at the National Academy of Social Insurance and is the former director of Women’s Economic Policy at the Center for American Progress. Glynn holds a bachelor’s degree in women’s studies from the University of California, Los Angeles and a Ph.D. in sociology from Vanderbilt University.