Introduction and summary
In 2015—the year for which the most recent data are available—42 percent of mothers were sole or primary breadwinners, bringing in at least half of family earnings. Nearly another one-quarter of mothers—22.4 percent—were co-breadwinners, bringing home from 25 percent to 49 percent of earnings for their families. This represents an increase over previous years and is the continuation of a long-running trend, as women’s earnings and economic contributions to their families continue to grow in importance.
The Center for American Progress first described the role of working mothers as breadwinners in 2009 with The Shriver Report: A Woman’s Nation Changes Everything, in a chapter titled “The New Breadwinners.”1 Authored by former CAP economist Heather Boushey, “The New Breadwinners” was among the first pieces of research to quantify the ways that women’s labor force participation has increased since the 1960s and what that means for families’ incomes. Boushey’s research focused on data that demonstrated how much likelier it is for today’s mothers to provide critical financial support to their families compared with earlier generations. While subsequent authors and publications have replicated her analysis in the ensuing years, often using slightly different definitions and variables,2 this update will continue the trajectory first laid out in her original work.
This report updates Boushey’s original analysis of breadwinning and co-breadwinning mothers and a 2014 follow-up report from CAP—“Breadwinning Mothers, Then and Now”—using the most recent data available. While this newest report revises the original analysis, it also provides new analyses looking at differences in breadwinning and co-breadwinning based on race and place. Specifically, it dives deeper into differences between black and white mothers in the frequency with which they combine paid employment with family caregiving and the different ways that they contribute to their families’ bottom lines. Most notably, the report highlights differences in the rates of breadwinning and co-breadwinning among different racial and ethnic groups. It also explores how rates of breadwinning differ across the United States, looking at differences between states and between rural and metropolitan areas.
It is true that there are significant differences between groups of breadwinning mothers based on their backgrounds and where they live. But while there are differences across the country and within groups of women, one overarching fact remains indisputably true: With the majority of women working for pay, and their earnings being so vital to the economic well-being of their families, the days of full-time, stay-at-home mothers are long past. Women are crucial economic actors for their families, local communities, and the overall U.S. economy.
However, the fact that women are bringing home a significant portion of their families’ incomes does not mean that there is gender parity in the workforce, nor does it mean that working parents and caregivers have the supports they so vitally need. Issues such as the gender wage gap and a lack of policies such as universal paid family and medical leave, paid sick days, and workplace flexibility still hold women back from reaching their full economic potential.
It is a testament to the hard work and tenacity of women that they have reached the level they occupy today. However, there is far more work to be done to ensure that U.S. labor standards and workplace policies are updated to reflect the reality of the 21st century workforce and to ensure that the nation’s public policies are in line with the needs of today’s working families.
Changes in family type and employment patterns
As noted in CAP’s previous update, families in the United States look different than they did a generation or two ago. Married couples today are less likely to have children than they were in the past, and single-parent households are also much more common. In 1974, a married couple headed 84 percent of all families with children, while in 2015, only about two-thirds, or 65.5 percent, of families with children were headed by a married couple.3 And from 1974 to 2015, the rate of families with children headed by a single mother nearly doubled—from 14.6 percent to 26.4 percent—while the rate of single fatherhood quadrupled from 1.4 percent to 8.1 percent.4
Regardless of household composition and whether parents are married, the vast majority of adults with custodial children are in the labor force. While fathers have been very likely to work outside the home over the past 50 years, mothers’ labor force participation rates have not always been as high as they are today. In 1976, only 56.3 percent of married mothers worked for pay, compared with 69.6 percent in 2015.5
However, changing family dynamics and increasing rates of mothers’ labor force participation obscure many differences between groups. Women of color have always been more likely than white women to work outside the home.6 And while the majority of single mothers are white, women of color are more likely to be raising children on their own compared with white women. In 2014, 40 percent of births were to unmarried mothers.7 And in 2013, 72 percent of all black women who gave birth and 53 percent of Latinas who gave birth were unmarried. Comparatively, 29 percent of white women who gave birth in 2013 were unmarried.8
So while patterns of motherhood and employment look different for different groups of women in 2015, the same has been true historically as well. The narrative around breadwinning and the struggles of balancing paid employment with family caregiving responsibilities often is framed as if these trends are new.9 But women of color have historically been much more likely than white women to be cast in the position of supporting their families economically while simultaneously providing family care.
Breadwinning mothers
It should not be surprising, given that so many women with children work outside the home, that the majority of mothers contribute significantly to their families’ bottom lines.10 Married and unmarried, most mothers with children under age 6 and those with school-age children, regardless of race or ethnicity, work for pay. At the same time, single mothers, because they are the sole parent, are more likely to work than married women, and the employment rates of mothers increase as their children age and enter school.11 As a result, breadwinning mothers are more common today in the United States than ever before. (see Figure 1)
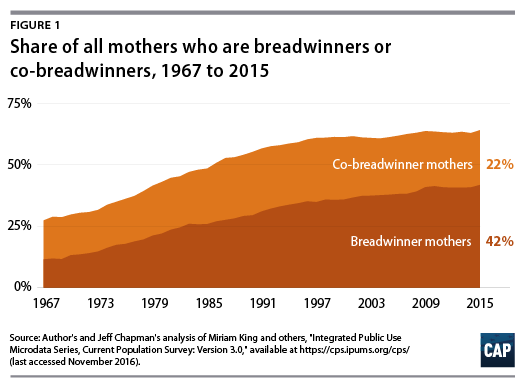
In 2015, the latest year for which data are available, 42 percent of mothers were sole or primary breadwinners, bringing in at least half of family earnings. (see Figure 1) Nearly another one-quarter—22.4 percent—were co-breadwinners, bringing home from 25 percent to 49 percent of earnings. This represents a continuation of the previous trends seen in CAP’s research using data from 2009, 2010, and 2013.12
As previously mentioned, deeper analysis shows that not all women with children have the same patterns of labor force participation—and these differences also contribute to different patterns of breadwinning and co-breadwinning across different groups. The remainder of this report explores how rates of mothers’ breadwinning and co-breadwinning differ across different races and ethnicities, as well as by U.S. region and state.
Working mothers’ breadwinning rates and family income contributions
In order to be consistent with CAP’s previous research, the author uses the same definitions for variables in this updated report as in the previous reports. The term “breadwinning mothers” refers to single working mothers and married mothers who earn as much as or more than their husbands.13 In the initial 2009 research, first published in The Shriver Report, co-breadwinning mothers were defined as “a working wife bringing home at least 25 percent of her family’s total earnings.”14 In 2015, 64.4 percent of mothers in the United States were either the sole family breadwinner at 42 percent or the co-breadwinner at 22.4 percent.
Race and ethnicity
As noted in the last report, the majority of breadwinning mothers in 2015 were white, with breakdowns as follows: 59.5 percent white; 17.3 percent black; 15.8 percent Latina; and 7.3 percent non-Hispanic mothers of another race. (see Figure 2) About two-thirds of co-breadwinning mothers—63.7 percent—are white, as are 62.6 percent of mothers with zero earnings.
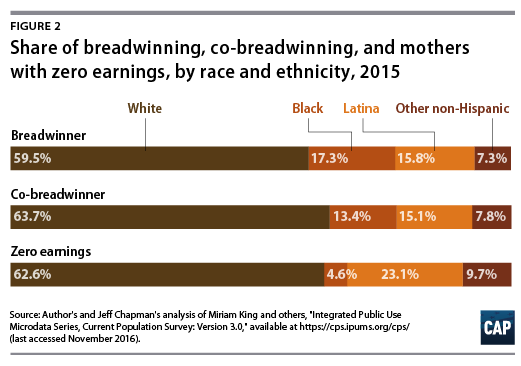
However, the racial and ethnic breakdown of all breadwinning mothers is influenced not only by the employment and earnings patterns of women but also by their relative share of the population. While demographic shifts are changing the makeup of families in the United States, there are still more white households with children than there are households of color with children, and white families make up 56.7 percent of all families with children.15 In this report, in addition to looking at the racial and ethnic breakdowns across all breadwinning and co-breadwinning mothers, the author analyzes the data within racial and ethnic groups to create a more detailed understanding of the dynamics at play.
Analyzing the data within racial and ethnic groups shows that among white families, white women are the least likely to be breadwinners for their families when compared with their black or Latina peers. Black mothers are by far the most likely to be the primary economic support for their families, both because they are more likely to be single mothers and because they are more likely—when part of a married couple—to earn as much as or more than their husbands.16 The vast majority of black mothers contribute significantly to their families’ bottom lines, with only 14.6 percent of black mothers bringing home less than one-quarter of their family’s earnings.17” (Minneapolis: University of Minnesota, 2010).] In fact, in 1970, black mothers were as likely to be the sole breadwinners of their families, at 36.4 percent, or co-breadwinners, at 22.2 percent, as white women were for their families in 2015. White mothers were sole breadwinners at 37.4 percent and co-breadwinners at 24.7 percent. During that same time span, black mothers saw their sole breadwinning share rise to 70.7 percent. While the increase in breadwinning among white mothers has been significant, the movement over the past 45 years has only brought them to the same level that black women occupied in 1970—illustrating how vital it is to center race in discussions of women’s economic empowerment and stability.
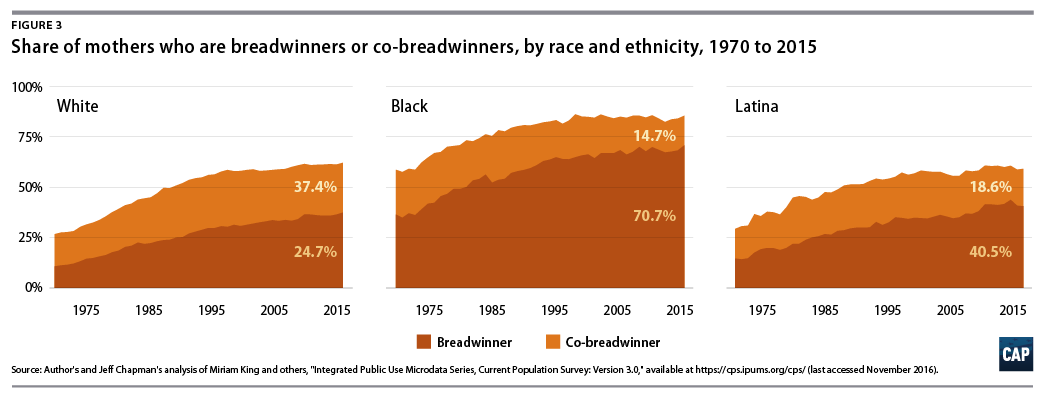
Latinas were more likely than white mothers to be breadwinners in 2015—40.5 percent versus 37.4 percent, respectively. However, Latinas were less likely to be co-breadwinners when compared with white mothers—18.6 percent versus 24.7 percent.
At least some of the differences in respect to breadwinning rates between different racial and ethnic groups are likely due to the fact that black women and Latinas are more likely than white women to be single mothers.18 Slightly more than half, or 55.8 percent, of white breadwinning mothers are married and earn as much as or more than their husbands.19 However, only 40.4 percent of Latina breadwinning mothers are married, as are only 25.3 percent of black breadwinning mothers. (see Table 1) The majority of black and Latina breadwinning mothers are single parents providing for their families.
Many women of color also have lower wages compared with white women. Furthermore, black women and Latinas experience even larger wage gaps compared with white men.20 In 2015, white, non-Hispanic women earned 75 percent of what white, non-Hispanic men earned, while black women earned only 63 percent and Latinas earned only 54 percent.21 These findings also reflect black women’s and Latinas’ historically high labor force participation rates, as women of color have always been more likely to work in the paid labor force than white women.22
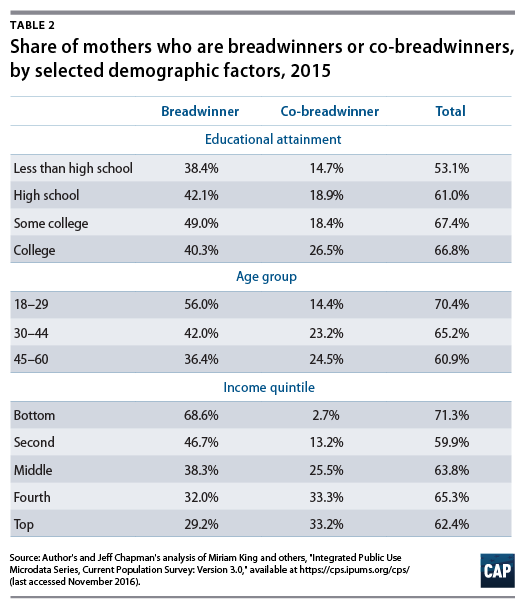
While data sample size restrictions prevent further exploration by race, other demographic characteristics are differently correlated with breadwinning and co-breadwinning. (see Table 2) Perhaps unsurprisingly, higher levels of education are associated with higher levels of breadwinning and co-breadwinning for mothers—likely due to the fact that women with more education tend to earn higher salaries than their less educated peers. Age makes a difference as well, with younger women being more likely to be breadwinners but less likely to be co-breadwinners, which is likely explained, at least partially, by the fact that younger women are more likely to be single mothers compared with older women and combined with the fact that younger workers earn less on average. Finally, women in the bottom income quintiles are much more likely to be breadwinners, and much less likely to be co-breadwinners, compared with mothers in higher family income brackets. This is likely due to the fact that higher-income families are more likely to be headed by two married working parents, since two incomes collectively tend to be larger than just one.
Region and state
In addition to differences by race, ethnicity, and other demographic factors, the author also found regional variation in rates of breadwinning and co-breadwinning mothers. (see Table 3)
Given the fact that highly educated and high-earning individuals are likely to live in the West or Northeast,23 it is somewhat counterintuitive to find that mothers in those states are not more likely to be breadwinners or co-breadwinners compared with their peers in the Midwest and South.24 In fact, mothers on the West Coast are the least likely to be either breadwinners or co-breadwinners. Mothers on the West Coast are also more likely to have zero earnings, compared with their peers in other areas of the United States.25
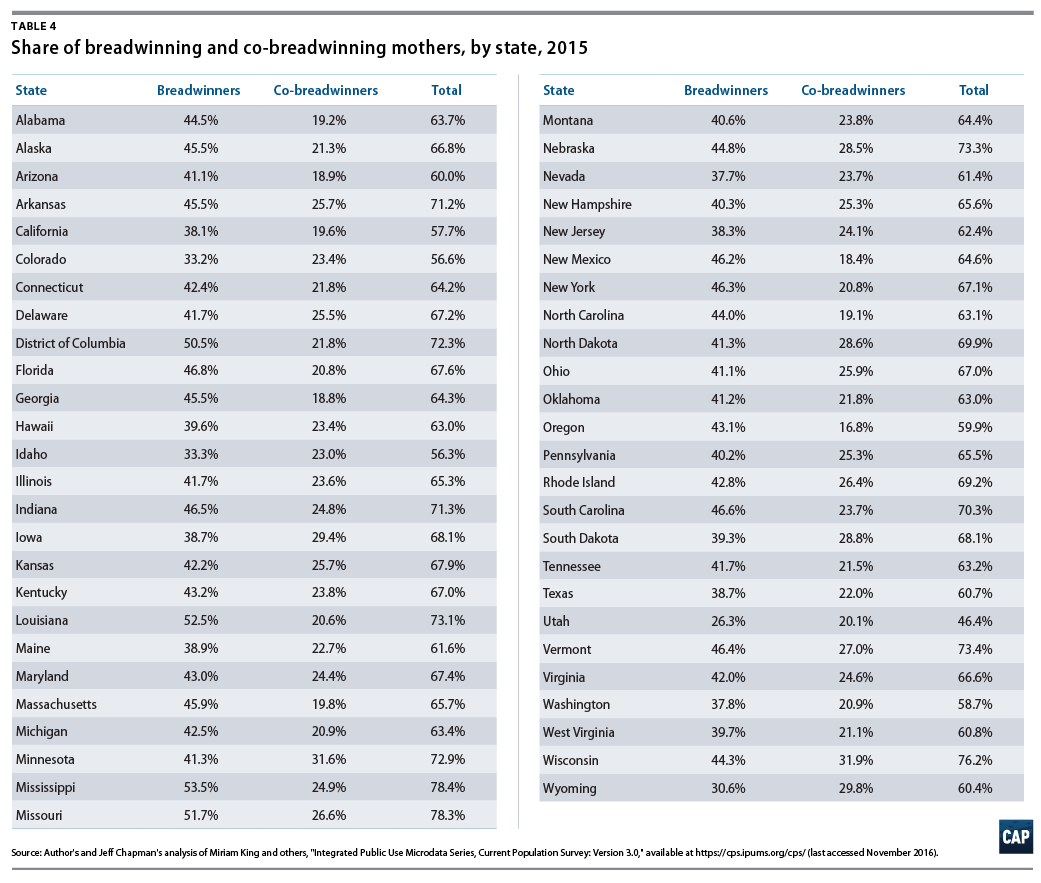
While there are regional patterns, not every state within a region shows the same patterns. (see Table 4) For example, 4 of the top 10 states with the highest rates of breadwinning mothers are in the South—Mississippi, Louisiana, Florida, and South Carolina—while Texas is squarely within the bottom 10. Mississippi, the state with the highest percentage of breadwinning mothers, is also the state with the lowest median family income, which may be driving at least some of this trend.26 CAP’s previous updates have found that married breadwinning mothers are more common in lower-income families.27 And families headed by single mothers are more likely to be low-income than married-couple families, in part because these families, by definition, contain only one working adult.28
Finally, there are also small differences in the rates of breadwinning and co-breadwinning mothers depending on whether they live in a metropolitan or nonmetropolitan area. Mothers living in the central city of a metropolitan area were the most likely to be breadwinners for their families—46.9 percent, though they were also the least likely to be co-breadwinners—19.3 percent. Mothers living within metropolitan areas but outside the central city were the least likely to be breadwinners for their families at a rate of 39.2 percent, but they were equally likely to be co-breadwinners as mothers not living in a metropolitan area, at 23.8 percent.
Policy updates are needed
Most mothers work, and in most families, their earnings are important to their households’ economic well-being, yet a number of barriers continue to persist that prevent women from reaching their full potential for themselves and their families.29 While some of these problems are rooted in sexism and outdated gender norms, the fact that the nation’s workplace policies have not been updated to reflect the nature of today’s working families holds back working women, as well as men who also have family caregiving responsibilities.
The negative impacts stemming from a lack of progressive workplace policies tend to fall primarily on women—especially mothers—who are the family members most likely tasked with bringing home a paycheck while also providing the majority of care to children and elderly family members. Mothers still provide the majority of child care and elder care, even when they are employed full time.30 However, there are no national-level policies in place to ensure that working caregivers have access to paid family and medical leave and paid sick days. Change is necessary to ensure that workplace policies match the realities of today’s working families.
While a significant percentage of mothers are the primary breadwinners for their families, the gender wage gap still continues to drag down women’s wages, which makes households less economically secure. The average full-time, year-round working woman earns only 80 percent of what the average man earns, and the rates are even lower for women of color.31 The causes underlying the wage gap are complex, but most of the difference between the overall wages of men and women can be traced to a combination of discrimination and a lack of workplace policies to enable workers to manage the dual responsibilities of wage earning while providing family care.32
For example, the United States continues to hold its place as an outlier among the rest of the world by being the only advanced economy, and one of only a few nations globally, that does not guarantee women the right to paid maternity leave after the birth of a baby.33 And the fact that the United States does not have the same kinds of family-friendly policies seen in other wealthy nations is a large part of why mothers’ labor force participation rates have fallen in America relative to other countries.34 Currently, only 13 percent of private-sector workers have access to paid family leave, and the rates are even lower among low-income workers.35
Thirty-six percent of private-sector workers, including more than 70 percent of low-wage workers, lack access to paid sick days that can be taken to recover from a short-term illness such as the flu or to take a sick child to a doctor’s appointment.36 This lack of paid leave is not just a matter of inconvenience; it can have devastating effects on families’ economic well-being as well. Nearly one in four U.S. workers report that they have either lost a job or have been threatened with the loss a job for taking time off when they were ill or when they needed to care for a sick child or relative.37
But solutions exist. Four states have passed laws to create their own temporary disability and paid family leave programs—California; New Jersey; Rhode Island; and, most recently, New York.38 These programs have been shown to increase labor force participation and reduce reliance on public assistance.39 While states have been leading the way, a national solution is needed to level the playing field and ensure that workers are not penalized for living in one of the other 46 states without such policies in place. The Family and Medical Insurance Leave Act, or FAMILY Act, would create a federal paid family and medical leave insurance program to provide partial wage replacement when people need time away from work to care for a new child, care for a seriously ill family member, or recover from their own serious illness or injury.40
In addition, the Healthy Families Act would enable workers to earn up to seven paid sick days per year that could be used to recover from an illness, care for a sick family member, or access medical care.41 Seven states—Connecticut; California; Massachusetts; Oregon; Vermont; Arizona; and Washington—and Washington, D.C., as well as dozens of cities, have already passed paid sick days laws.42 Leveling the playing field for workers regardless of where they reside would ensure that no one has to choose between caring for a sick child and losing a job.
Mothers across the United States continue to increase their rates of breadwinning and co-breadwinning for their families. Long gone are the days when the majority of middle- and upper-income women stayed home to raise families full time. Instead, in most families today, either both parents work or the household is headed by a single parent. In 2015, roughly two-thirds of mothers were either the primary breadwinner for their families or earned at least one-quarter of their family’s income. While this number represents a new high, it is the continuation of a long-running trend.
Women, and mothers in particular, have entered the paid labor force en masse, and there are no signs of that changing. At a time when women’s wages are so vital to keeping their families afloat, America cannot afford to sit idly by and do nothing. It is time to update the nation’s labor standards and put in place family- and worker-friendly policies to ensure that all working families have the supports they need.
About the author
Sarah Jane Glynn is a Senior Policy Adviser at the Center for American Progress. An expert in gender and family economic security, Glynn has a bachelor’s degree in women’s studies from UCLA and a doctorate in sociology from Vanderbilt University.