Authors’ note: CAP uses “Black” and “African American” interchangeably throughout many of our products. We chose to capitalize “Black” in order to reflect that we are discussing a group of people and to be consistent with the capitalization of “African American.”
Introduction and summary
The U.S. economy was built on the exploitation and occupational segregation of people of color. While many government policies and institutional practices helped create this system, the legacies of slavery, Jim Crow, and the New Deal—as well as the limited funding and scope of anti-discrimination agencies—are some of the biggest contributors to inequality in America. Together, these policy decisions concentrated workers of color in chronically undervalued occupations, institutionalized racial disparities in wages and benefits, and perpetuated employment discrimination. As a result, stark and persistent racial disparities exist in jobs, wages, benefits, and almost every other measure of economic well-being.
This report examines how government-sanctioned occupational segregation, exploitation, and neglect exacerbated racial inequality in the United States. Eliminating current disparities among Americans will require intentional public policy efforts to dismantle systematic inequality, combat discrimination in the workplace, and expand access to opportunity for all Americans.
Slavery and Jim Crow concentrated workers of color in chronically undervalued occupations
For centuries, Black people were enslaved and forced to work in brutal conditions as agricultural, domestic, and service workers. By some estimates, slaveholders extracted more than $14 trillion worth of labor, in today’s dollars, from their captives.1 Enslaved people plowed and sowed fields; harvested and packaged crops; and raised, milked, and butchered livestock.2 They cooked and served food, cleaned houses, weaved and mended clothing, and provided child care services.3 They cut hair, carried luggage, and drove wagons, carts, and carriages.4 When enslaved Black people attempted to flee, federal laws such as the 1793 and 1850 Fugitive Slave Acts helped ensure their recapture by fining officials who did not arrest alleged runaways and imprisoning anyone who aided in their escape.5 If captured, enslaved people could be tortured, mutilated, and even killed without legal repercussions.6
The United States abolished slavery in 1863, but this action did not coincide with the opening of all occupations to liberated Black workers. On the contrary, federal officials within the Freedmen’s Bureau—established by the federal government in part to help formerly enslaved people transition to freedom—encouraged Black people to stay in the South and enter into contracts doing the same work for the families that previously enslaved them.7 After Reconstruction, state and local governments doubled down on these efforts by enacting Jim Crow laws, which codified the role of Black people in the Southern economy and society.8 States such as South Carolina enacted strict “Black Codes” that fined Black people if they worked in any occupation other than farming or domestic servitude.9 If they broke these laws or abandoned their jobs after signing a labor contract, they could be arrested and, thanks to a loophole in the 13th Amendment, forced back into unpaid labor on white plantations.10 Lawmakers also sought to prevent Black people from migrating in search of safety and economic opportunity. They enacted emigrant-agent laws restricting interstate labor recruiters from encouraging or financing the relocation of Black workers or from posting advertisements in predominantly Black communities for distant job openings.11
During the mid-20th century, technological advancements reduced the demand for farm labor and domestic work in the South.12 These changes, combined with discriminatory U.S. Department of Agriculture policies, rampant lynchings, and Ku Klux Klan terror, led thousands of Black households in the South to flee north.13 As a result, the United States experienced a rapid decline in the number of Black farm operators and farm and domestic workers.14 However, Black workers remained overrepresented in low-wage service jobs.15 Meanwhile, the continued devaluation of domestic and agricultural vocations and the accompanying search for lower-wage laborers of color soon led to a high concentration of Asian American and Latinx workers in domestic and agricultural occupations; this remains the case today.16
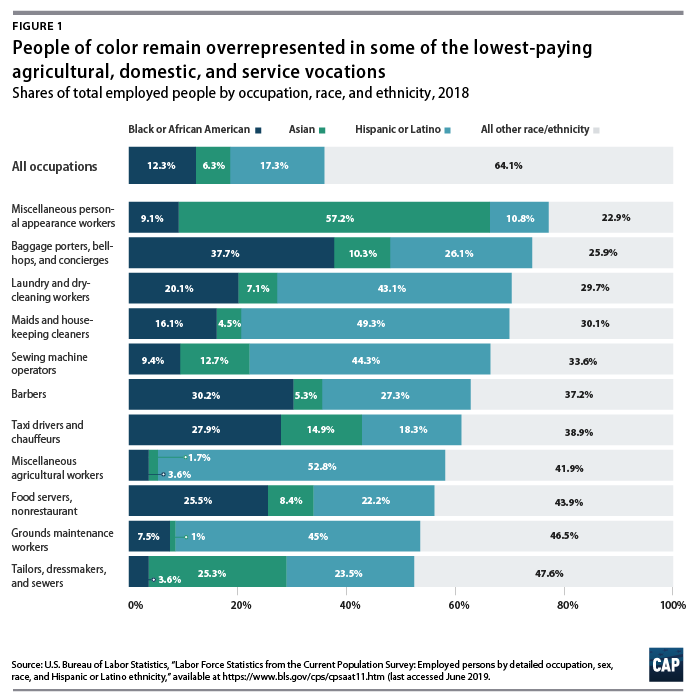
Occupational segregation and the persistent devaluation of workers of color are a direct result of intentional government policy. To this day, people of color remain overrepresented in the lowest-paid agricultural, domestic, and service vocations. (see Figure 1) While Black or African American, Asian, and Hispanic or Latino people comprise 36 percent of the overall U.S. workforce, they constitute 58 percent of miscellaneous agricultural workers; 70 percent of maids and housekeeping cleaners; and 74 percent of baggage porters, bellhops, and concierges. Slavery and Jim Crow devalued these types of work, and the legacy of these institutions continues to inform the American economic system and its outcomes.
New Deal programs helped institutionalize racial disparities in wages and benefits
During the Great Depression, the United States enacted a series of policies under the New Deal to assist struggling families and expand access to economic mobility. These policies included, but were not limited to, strengthened labor standards for wages and working conditions and increased protections for collective bargaining. The New Deal helped millions of families find work, increase their wages, and secure employment benefits,17 but lawmakers reserved most of these benefits for white workers while restricting and excluding people of color. These actions helped institutionalize and validate racial disparities in economic well-being, and the effects are felt to this day.
The New Deal’s Fair Labor Standards Act of 1938 (FLSA) introduced a 40-hour work week, banned child labor, and established a federal minimum wage and overtime requirements.18 While the FLSA boosted wages and improved working conditions for thousands of white workers, it largely excluded African American workers from receiving these benefits by exempting many domestic, agricultural, and service occupations.19 This policy decision trapped families in poverty and tacitly endorsed the continued exploitation of workers of color. Lawmakers amended the FLSA to include some of these occupations in subsequent decades, but agricultural and domestic workers—many of whom today are Latinx or Asian American—remain some of the least protected employees in the United States.20 Many agricultural workers are still denied access to overtime and minimum wage protections.21 For example, children as young as 12 years old are legally allowed to work in the fields.22 Live-in domestic service workers, babysitters, and companions for the elderly—all occupations in which people of color are disproportionately represented—also remain excluded from many FLSA protections.23
Tipped service workers
The practice of tipping service workers came to the United States from Europe in the 19th century.24 While Americans were initially reluctant to adopt this system, it allowed American restaurants and railway companies to maximize profits by refusing to pay Black employees.25 Over time, many of the service vocations that previously enslaved people were forced to carry out—such as serving food, cutting hair, carrying baggage, and driving vehicles—became subject to tipping. Today, restaurant servers, bellhops, food delivery drivers, valets and parking attendants, and nail salon workers are among the many occupations paid primarily through tips.26
Service workers were among the many workers initially excluded from the minimum wage provisions of the FLSA.27 Lawmakers amended the FLSA in subsequent decades to expand coverage, but instead of requiring service employers to pay their workers the full minimum wage, the amendments introduced a discriminatory subminimum wage.28 Today, service employees who receive more than $30 in tips each month can be paid as little as $2.13 per hour in wages from their employers.29 If an employee’s tips do not make up the difference between this rate and the federal minimum wage of $7.25, employers are legally required to cover the difference.30 However, evidence suggests that this rarely happens, and service employees lose out on millions of dollars in wages every year due to this carveout.31
The National Labor Relations Act of 1935, also known as the Wagner Act, was enacted shortly before the FLSA and expanded collective bargaining rights nationwide.32 Union membership afforded workers higher wages, improved benefits and job security, and better working conditions, allowing many to transition into the middle class.33 However, the Wagner Act excluded domestic and agricultural workers and permitted labor unions to discriminate against workers of color in other industries, such as manufacturing.34 The Wagner Act’s discriminatory provisions also coincided with a national movement to dismantle collective bargaining altogether, especially in more racially diverse states.35 While workers eventually convinced lawmakers to ban unions from engaging in racial discrimination, many domestic and agricultural workers, who are disproportionately people of color, remain excluded from Wagner Act protections.36
“Right-to-work” laws
In 1947, Congress overrode President Harry Truman’s veto to enact the Taft-Hartley Act, which was designed to strip away many of the beneficial provisions of the Wagner Act. Among other things, this law gave states the green light to ban unions from requiring workers who benefit from collective bargaining to help pay for bargaining costs.37 Today, 8 of the 10 states with the highest percentage of Black residents have “right-to-work” laws, which prohibit fair share fees.38
These laws strip funding and bargaining power from labor unions,39 which in turn has a profound effect on the economic well-being of people of color. Black and Latinx workers who belong to unions receive higher wages and experience a smaller racial wage gap than those who are not in unions.40 “Right-to-work” laws undermine and stymie workers’ ability to advocate for themselves through unionization and to achieve economic parity.
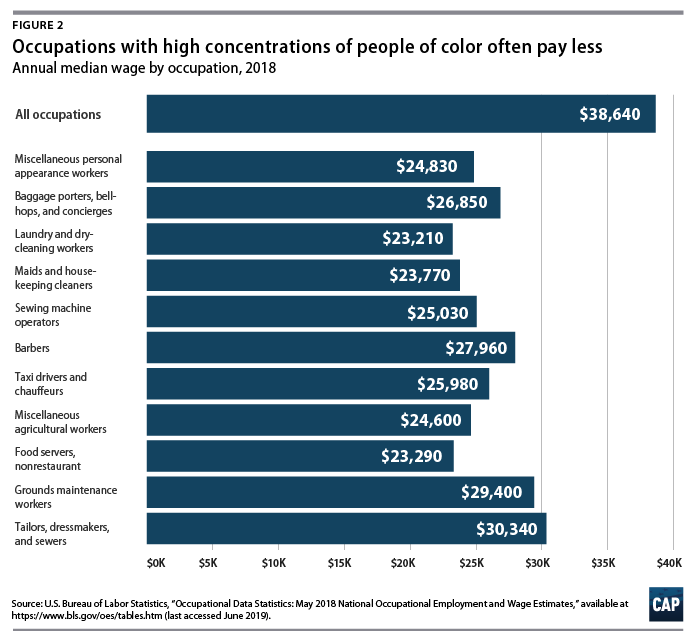
Today, the median U.S. wage is $18.58 per hour.41 However, in service occupations with high percentages of Black workers—including baggage porters, bellhops, and concierges; barbers; and taxi drivers—the median wage is just $12.91, $13.44, and $12.49, respectively.42 Predominantly Asian American service and domestic occupations—such as miscellaneous personal appearance workers and tailors, dressmakers, and sewers—receive median hourly wages of just $11.94 and $14.59, respectively. For agricultural and domestic occupations with high percentages of Latinx workers—such as miscellaneous agricultural workers, maids and housekeeping cleaners, and sewing machine operators—the median wage is $11.83, $11.43, and $12.03, respectively.43
The FLSA and the Wagner Act were landmark pieces of New Deal legislation that opened the door to prosperity for thousands of households. These policies were marketed as universal, but they further entrenched racial disparities in wages and benefits by excluding many of the occupations most commonly held by Black—and more recently, Asian American and Latinx—workers. Millions of people of color remain trapped in low-paying jobs with few benefits, limited employment security, and sordid working conditions as a direct result of these intentional government policies.44 (see Figure 2)
The underfunding and limited scope of anti-discrimination agencies perpetuate inequality
In the 1960s, Black activists secured landmark civil rights legislation that created new federal agencies charged with holding people and institutions accountable for engaging in discrimination.45 Federal laws were followed by dozens of state statutes designed to protect people of color from discrimination in the workplace.46 These new laws marked a symbolic turning point in American race relations and finally promised to expand access to opportunity to all people. However, lawmakers never fully funded these agencies and even provided exemptions, allowing many employers to continue to discriminate with little culpability, so long as they did not have many employees.47 As a result, millions of workers of color continue to experience racial discrimination in employment and wages.48
Created in 1965, the U.S. Equal Employment Opportunity Commission (EEOC) is charged with enforcing federal laws that make it illegal to discriminate against job applicants and employees based on race, color, religion, sex, national origin, age, disability, or genetic information.49 Every year, the EEOC receives hundreds of thousands of calls and inquiries, but it lacks the funding and staff necessary to fully ensure that bad actors are held accountable.50
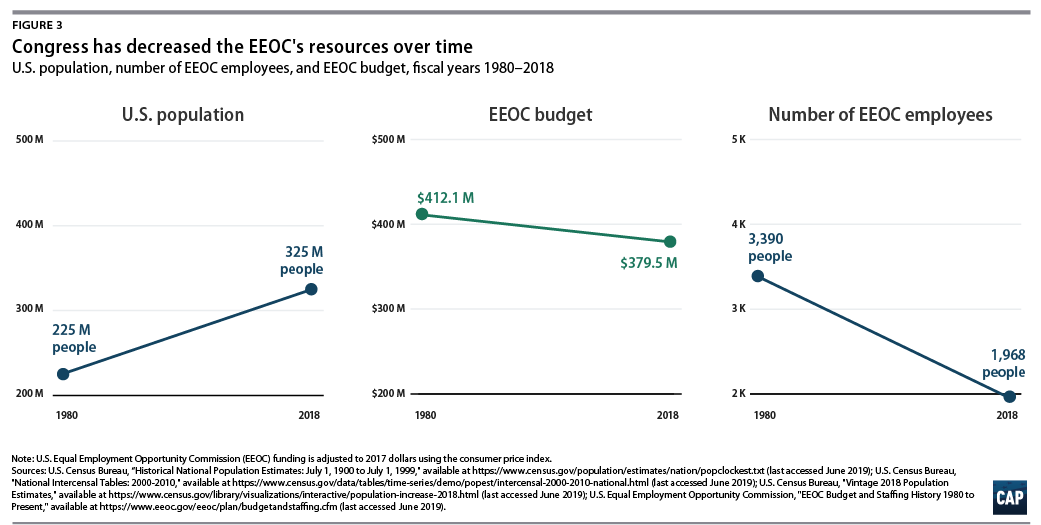
From 1980 through mid-2018, the U.S. population grew by 44 percent—from 227 million to 327 million.51 Today, more than 5.6 million employers employ more than 125 million workers.52 Despite this growth, Congress has refused to significantly increase the agency’s inflation-adjusted budget over this period and has actually reduced the number of employees charged with carrying out the agency’s mission.53 (see Figure 3) In 2018, the EEOC secured $505 million for victims of discrimination, but the agency’s lack of resources has created a substantial and persistent backlog of nearly 50,000 charges.54
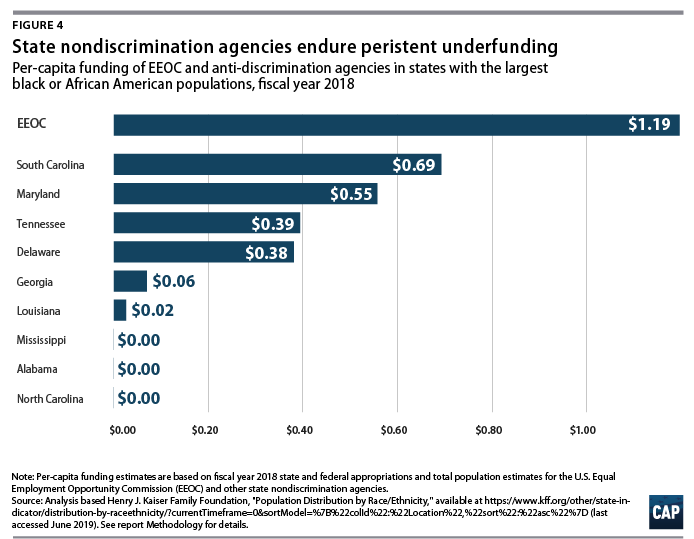
While Congress should dramatically expand the EEOC’s budget, the federal government should not be alone in the fight against employment discrimination. States possess the resources and expertise necessary to enact and fully enforce their own civil rights statutes to protect workers of color. Unfortunately, few states provide their anti-discrimination agencies with sufficient resources to tackle this systemic problem, and some states lack enforcement agencies altogether. State anti-discrimination agencies often have large mandates with multiple covered populations and the responsibility to tackle discrimination in both employment and housing. However, none of the 10 states with the highest percentage of Black residents provide these agencies with annual funding of more than 70 cents per resident per year. (see Figure 4) By comparison, in 2015, each of these 10 states had state and local policing expenditures of more than $230 per resident per year—at least 328 times more than what each state spends on enforcing anti-discrimination laws.55 In some states, such as Louisiana, more taxpayer dollars are spent on the governor’s salary than on protecting millions of residents from employment discrimination.56
Lawmakers have also limited the scope of anti-discrimination enforcement by establishing a minimum employee threshold for covered companies. For instance, only companies with 15 or more employees are covered by the EEOC’s racial discrimination laws.57 More than two-thirds of states, including those with the highest percentages of Black residents, also have minimum employee thresholds for employment discrimination laws to take effect.58 These thresholds jeopardize the economic well-being of people of color who work for smaller employers, such as domestic workers, service workers, and some agricultural workers.
While legislation alone cannot prevent bias, the persistent underfunding of enforcement agencies and exemptions for small companies result in limited accountability for employers that abuse and exploit their workers based on race. Ample evidence demonstrates that racial discrimination in employment and wages remains rampant more than 50 years after the passage of landmark civil rights legislation. In fact, studies show that hiring discrimination against Black people has not declined in decades.59 White applicants are far more likely to be offered interviews than Black and Latinx applicants, regardless of educational attainment, gender, or labor market conditions.60 Full names often attributed to white Americans are estimated to provide the equivalent advantage of eight years of experience.61 Surveys show that more than half of African Americans, 1 in 3 Native Americans, 1 in 4 Asian Americans, and more than 1 in 5 Latinos report experiencing racial discrimination in hiring, compensation, and promotion considerations.62
Employment discrimination perpetuates inequality in economic well-being, especially for Black people. Over the past 40 years, Black workers have consistently endured an unemployment rate approximately twice that of their white counterparts.63 Black households have also experienced 25 percent to 45 percent lower median incomes than their white counterparts, and these disparities persist regardless of educational attainment and household structure.64 In 2017 alone, the median income for Black and Latinx households was $40,258, compared with $68,145 for white households.65 In fact, in 99 percent of U.S. counties, Black boys will go on to make less in adulthood than their white neighbors with comparable backgrounds.66
Conclusion
Structural racism in federal, state, and local policymaking has produced stark and persistent inequities in economic well-being. Eliminating these disparities will require long-term, targeted interventions to expand access to opportunity for people of color.
At a minimum, lawmakers must defend workers’ rights by repealing “right-to-work” laws; dismantling all exclusions from federal labor protections under the Fair Labor Standards Act and the Wagner Act; increasing the minimum wage; and abolishing the tipped minimum wage. They must also increase employment protections by eliminating all employer exemptions for anti-discrimination laws; expanding EEOC resources and regularly increasing appropriations to keep pace with workplace population growth; and matching per capita state spending on employment discrimination to EEOC spending. Finally, lawmakers should establish a federal program designed to help workers of color enter historically exclusionary industries.
These steps are not a panacea and will not solve the myriad economic and racial disparities that exist today, but they would put the United States on a path toward achieving racial equity in the economy.
About the authors
Danyelle Solomon is the vice president for Race and Ethnicity Policy at the Center for American Progress.
Connor Maxwell is a policy analyst for Race and Ethnicity Policy at the Center.
Abril Castro is a research assistant for Race and Ethnicity Policy at the Center.
Methodology
This report’s spending analysis is based on data from multiple sources. To determine which 10 states had the most Black or African American residents as a percentage of the state population, the authors utilized the Henry J. Kaiser Family Foundation’s (KFF) 2017 “Population Distribution by Race/Ethnicity” table, which bases its estimates on the U.S. Census Bureau’s 2017 American Community Survey.67 The KFF’s estimates also formed the basis of this report’s per capita spending analysis.
The authors analyzed fiscal year 2018 budget appropriations from the 10 states with the most African American residents as a percentage of the total state population: Alabama, Delaware, Georgia, Louisiana, Maryland, Mississippi, North Carolina, South Carolina, Tennessee, and Virginia. The authors reported per capita spending of $0 for Alabama, North Carolina, and Mississippi because none have an agency responsible for addressing employment discrimination based on race. Unlike the federal government, several states—including South Carolina and Tennessee—utilize the same agency and funding stream for enforcement of discrimination statutes in employment and housing. Furthermore, each state varies regarding the protected classes covered by their anti-discrimination statutes. The Virginia Division of Human Rights (DHR), for example, is charged with enforcing the Virginia Human Rights Act. However, the DHR is housed within the Office of the Attorney General of Virginia and does not receive a separate line item in the biennial budget. Therefore, Virginia was omitted from the authors’ analysis. The Equal Employment Opportunity Commission’s per capita spending is based on FY 2018 appropriations, divided by the total U.S. population estimates from the KFF.
The EEOC’s annual budget (see Figure 3) is adjusted to 2017 dollars using the U.S. Bureau of Labor Statistics’ Consumer Price Index inflation calculator. Population estimates for this figure come from the U.S. Census Bureau’s Historical National Population Estimates, National Intercensal Tables, and Vintage 2018 Population Estimates.68
See also