Introduction and summary
Prior to the arrival of President Donald Trump’s second budget blueprint in February, the Center for American Progress, working with GBA Strategies, set out to assess current attitudes among American voters on a range of issues related to government assistance and social insurance programs. The study sought to answer a number of questions about public opinion on the social safety net; people’s day-to-day economic lives; and reactions to proposals to increase jobs, wages, and economic security for families.
Are voters facing significant economic hardships or are they basically doing well? What are voters’ beliefs about federal efforts to ensure basic living standards for all Americans, including adequate health care, housing, and nutrition? What do voters think about recent proposals to change and reduce funding for a range of government programs that primarily support low-income people? What are their reactions to alternative proposals on job creation, community investments, worker supports, and family support policies?
In the aftermath of the recently passed legislation to change the tax system, this study finds that American voters overwhelmingly reject President Trump’s and congressional leaders’ recent proposals to restrict eligibility and cut overall funding for a range of government assistance programs. Majorities of American voters across demographic lines oppose plans designed to limit and cut Medicaid, nutrition assistance, affordable housing, and other programs that help provide basic living standards for low-income families. Likewise, a clear majority of Americans oppose recent efforts to allow states to deny Medicaid health care to people who do not meet state-approved work requirements, with voters divided heavily along partisan lines on other measures of the overall effectiveness and wisdom of these plans.
Furthermore, many voters view these efforts to cut the safety net as directly linked to and motivated by the need to offset recent tax cuts that primarily benefit corporations and the wealthy. Consequently, majorities of American voters say they are less likely to vote for a congressional candidate who backs these efforts to restrict and reduce a variety of social insurance and benefit programs.
Why does this opposition emerge? The evidence here suggests that many Americans are hurting economically and believe in maintaining a robust system of social supports for those in need. Large shares of voters in the study report serious economic hardships ranging from the lack of a solid paying job to high household costs and debts: A full 7 in 10 voters overall, and more than 6 in 10 of the president’s own supporters, say they have faced at least one serious economic problem over the last year. And in contrast to those who argue that the U.S. system of social insurance is broken, this study finds solid majorities of voters supporting the basic principle that government should ensure people’s access to basic living standards such as health care, housing, and nutrition. Although there are stark partisan divides on many of these issues, voters across demographic lines want the government to offer a helping hand to people confronting low wages and high costs for necessities such as medical care, housing, food, and education.
These results are based on a comprehensive nationally representative poll of 2,350 registered voters, conducted by CAP and GBA Strategies from January 24 through 29, 2018. The survey was conducted by GBA Strategies online among respondents drawn from a custom database of more than 6 million Americans recruited online, by phone, and through social media. Results are weighted to reflect national demographic statistics for registered voters. The survey carries a margin of error of 2.2 percentage points at the 95 percent confidence level. Poll results and data are on file with the authors.
This report first examines the overall political context and economic conditions facing voters. It then explores voter reactions to concrete ideas about government assistance programs and alternative proposals on jobs and wages.
Voters sharply divided along partisan lines over Trump and the country’s direction
One year into President Trump’s tenure, American voters express divergent opinions about the overall direction of the country, the president himself, and the two congressional political parties. Overall, only 4 in 10 voters say that things in the country are “going in the right direction,” compared with 60 percent who believe that “things have gotten pretty seriously off on the wrong track.”
As Figure 1 shows, large partisan divisions emerge on this basic measure of the country’s direction. Seventy-eight percent of Trump voters from 2016, and 74 percent of self-identified Republicans, feel that things are going in the right direction, while 85 percent of Hillary Clinton voters from 2016, and 83 percent of self-identified Democrats, feel the opposite. More than two-thirds of self-identified independents, and a full 85 percent of third-party voters from the 2016 presidential election, side with Democrats on this measure, seeing the country as seriously off on the wrong track.
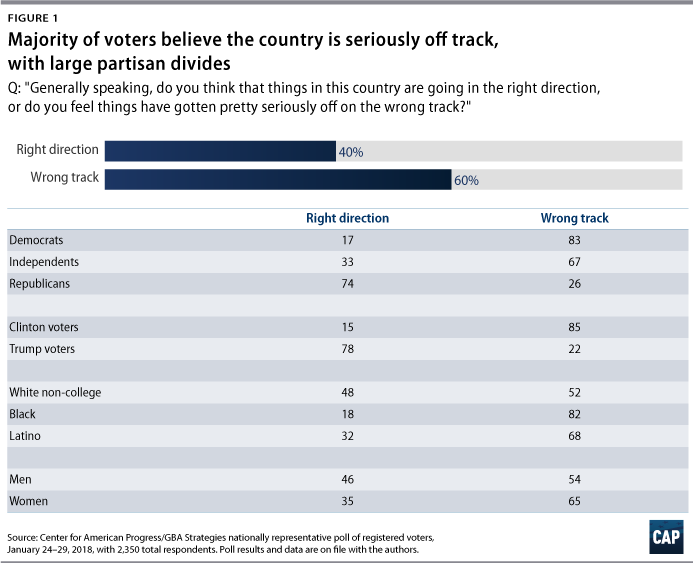
Although partisan and ideological cleavages are clear on the country’s direction, it is important to note that majorities of both men and women; all racial and ethnic groups; and all education and age cohorts surveyed believe that the country is seriously off on the wrong track, showing the depth and breadth of voter unrest about the current state of American life.
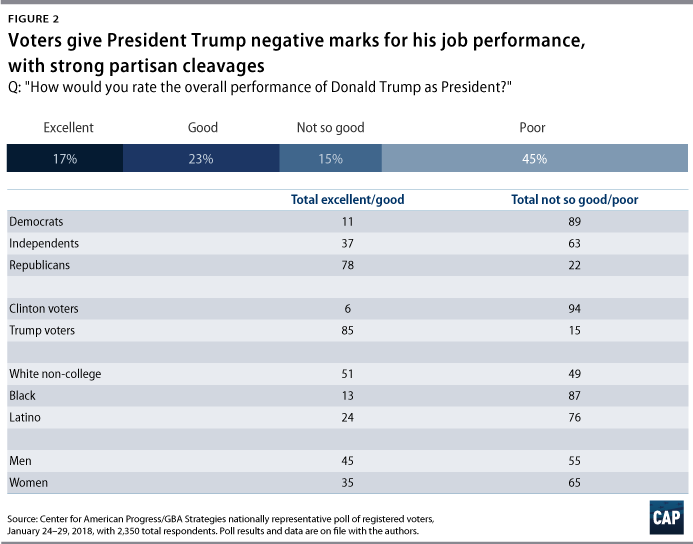
Voter attitudes about Trump’s job performance at this stage in his presidency closely match the patterns seen on the nation’s overall direction. In total, 40 percent of voters give Trump an “excellent” or “good” rating for his job performance, while 60 percent rate his performance in office as “not so good” or “poor.” The intensity of support for and opposition to the president, however, is sharply asymmetrical: A full 45 percent of voters give Trump a “poor” rating, compared with fewer than 1 in 5, or 17 percent, who give him an “excellent” rating. Eighty-five percent of Trump voters and 78 percent of self-identified Republicans rate his job performance positively; conversely, 94 percent of Clinton voters and 89 percent of Democrats rate him negatively. Majorities of all gender; racial and ethnic; age; and education-level groups in the country rate the president’s job performance as “not so good” or “poor.”
Voters express even greater displeasure with the job performance of congressional parties. More than two-thirds of voters, or 67 percent, give Republicans in Congress a “not so good” or “poor” rating; likewise, more than 6 in 10 voters—63 percent—give Democrats in Congress a negative rating. A mere 7 percent of voters give either party an “excellent” rating, compared with the more than one-third of voters who give congressional Republicans a “poor” mark and more than one-quarter who similarly rate congressional Democrats. Sixty-two percent of self-identified Republicans, as well as 62 percent of self-identified Democrats, rate their own congressional party well, while roughly 8 in 10 self-identified independents rate both congressional parties poorly.
Many voters face dire economic situations
Despite improvements in the larger U.S. economy and in many states, this study finds significant shares of voters reporting ongoing difficulties finding jobs, as well as with wages and economic stability. In a general measure of the perceived economic conditions of the community in which they live, nearly one-half of all voters—46 percent—say that the economy in their community is “doing just okay,” and another 14 percent describe it as “economically left behind.” On the more positive side, 29 percent of voters say the economy where they live is “getting better,” and 11 percent describe their local economy as “thriving.”
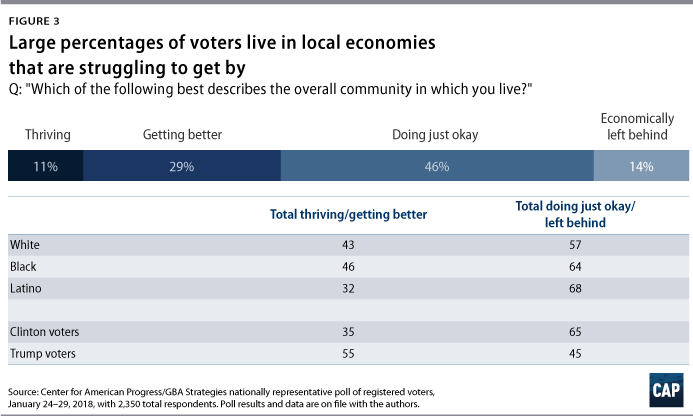
Local economic challenges cut across racial and ethnic lines and affect people across the nation. Nearly 6 in 10 white voters—57 percent—describe the economy in their community as either “doing just okay” or “economically left behind,” as do 64 percent of black voters and 68 percent of Latino voters. Majorities of voters in every region of the United States, with the exception of the Upper Midwest, the Mountain West, and Great Plains regions, report stagnant or negative economic conditions in their communities. Nearly 1 in 5 voters, or 19 percent, in both New England and the Deep South report their local conditions as “economically left behind”—the worst ratings reported across regional breakdowns.
There are interesting partisan differences on this measure, however, with a majority of Trump voters from 2016—55 percent—saying that their local economy is “getting better” or “thriving,” versus roughly one-third, or 35 percent, of Clinton voters from 2016 who feel the same way about their community. This relative optimism reflects other partisan-based evaluations of the economy, with in-party voters—those who voted for the party in power—feeling somewhat better about the state of the economy than do out-party voters.
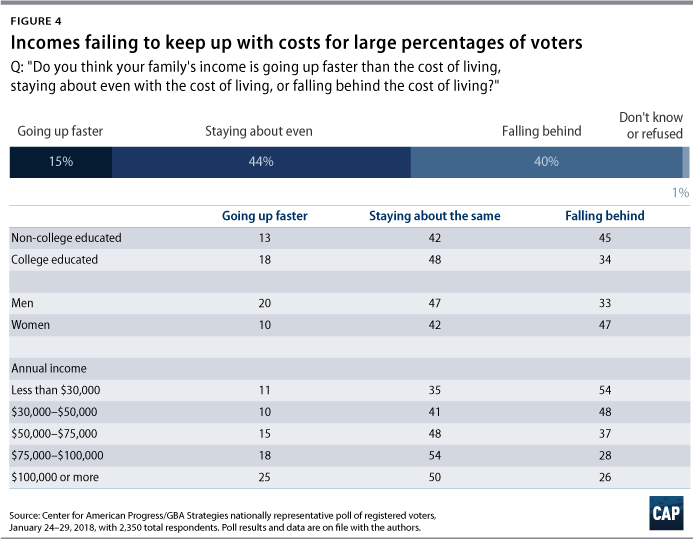
In another test of economic conditions facing voters, the survey asked participants whether their family’s income is “going up faster than,” “staying about even with,” or “falling behind” the cost of living. A plurality of voters overall—44 percent—say that their income is staying about even with the cost of living, and 15 percent say their income is going up faster than living costs. A full 40 percent of voters, however, say that their family income is falling behind the cost of living, highlighting the ongoing difficulties many families face trying to make ends meet in today’s economy. Educational and gender divides are clear on this measure, with 45 percent of noncollege-educated voters and 47 percent of women reporting their income falling behind the cost of living, compared with only 34 percent of college-educated voters and 33 percent of men.
In addition, this study finds that many voters continue to face serious economic hardships in their personal lives, limiting access to a secure standard of living. The survey asked people whether “they or someone in their immediate family have had a serious problem” in the past year with a set of economic challenges. Anywhere from 28 percent to 48 percent of Americans say that in the past year, they or someone in their family have had serious trouble with work; pay; or related household cost and debt issues:
- 48 percent of voters report a serious problem with “finding a decent job with good wages.”
- 42 percent of voters report a serious problem “paying a credit card balance.”
- 39 percent of voters report a serious problem with “being unable to get medical care because of the cost.”
- 39 percent of voters report a serious problem with “having too little money to buy food.”
- 36 percent of voters report a serious problem with “falling behind in gas, electric, or phone bills.”
- 28 percent of voters report a serious problem with “falling behind in rent or mortgage payments.”
A full 70 percent of voters overall report having a serious issue with at least one of these economic challenges, including 61 percent of President Trump’s voters.
Notably, Americans ages 18 through 34 report significantly higher rates of serious problems in these areas. For example, 71 percent of voters ages 18 through 34 report serious problems “finding a decent job with good wages,” compared with 48 percent of voters overall, and 57 percent of younger voters in this age range report serious problems getting medical care because of the cost, compared with 39 percent of voters overall.
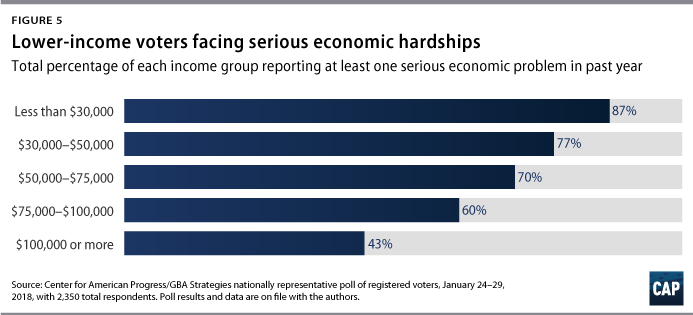
Economic challenges among lower-income voters are acute. Eighty-seven percent of those earning less than $30,000 per year, and 77 percent of those making between $30,000 and $50,000 annually, report facing a serious problem with at least one of these issues, including majorities of both income groups reporting a serious problem finding a decent job with good wages. In contrast, only 43 percent of voters earning $100,000 or more per year reported any serious problems finding a decent job, and only 29 percent of these voters said they had trouble finding a decent job in the past year.
Strong belief in principles underlying government assistance and social insurance programs
Given the range of economic challenges facing many Americans, it makes sense to find robust philosophical support for the basic ideas underpinning the entire U.S. system of social assistance. The survey presented participants with a series of contrasting statements about the necessity of and need for social insurance and government assistance programs and asked them to choose which of the two statements comes closer to their view, even if neither is exactly right.
On every related question, a majority or plurality of voters across demographic lines favor the ideas that serve as the basis for America’s social insurance programs.
By a 55 percent-to-27 percent margin, for example, voters agree more with the statement, “The government should help ensure that all families have access to basic living standards like health care, nutrition, and housing if their wages are too low or they can’t make ends meet,” versus the notion that “Welfare programs trap people in poverty by leaving them dependent on the government and penalizing work.”
By a 60 percent-to-20 percent margin, voters agree, “It is more important to me to help provide basic living standards like housing, nutrition, and health care for those struggling to make ends meet,” rather than an alternative: “It is more important to me to address large budget deficits by reducing overall spending on government assistance programs for low-income people.” And 65 percent of voters believe that “Even if I may not need them now, I’m glad our society provides government services to ensure basic living standards for when times get tough.” This is in contrast to the 19 percent of voters who say, “I don’t envision ever being in a position where I would need or want to use the health care, nutrition, housing, or income support provided by the government.”
In terms of the causes of poverty, 59 percent of voters are more apt to believe, “Most people who live in poverty are poor because their jobs don’t pay enough, they lack good health care and education, and things cost too much for them to save and move ahead.” Only 22 percent of voters agreed with the alternative argument: “Most people who live in poverty are poor because they make bad decisions or act irresponsibly in their own lives.”
Many respondents are in favor of assistance programs for low-income people
After reading both statements, please indicate whether the first statement or the second statement comes closer to your own view, even if neither is exactly right.
- 55 percent closer to view: The government should help ensure that all families have access to basic living standards like health care, nutrition, and housing if their wages are too low or they can’t make ends meet.
- 27 percent closer to view: Welfare programs trap people in poverty by leaving them dependent on the government and penalizing work.
- 60 percent closer to view: It is more important to me to help provide basic living standards housing, nutrition, and health care for those struggling to make ends meet.
- 20 percent closer to view: It is more important to me to address large budget deficits by reducing overall spending on government assistance programs for low-income people.
- 65 percent closer to view: Even if I may not need them now, I’m glad our society provides government services to ensure basic living standards for when times get tough.
- 19 percent closer to view: I don’t envision ever being in a position where I would need or want to use the health care, nutrition, housing, or income support provided by the government.
- 59 percent closer to view: Most people who live in poverty are poor because their jobs don’t pay enough, they lack good health care and education, and things cost too much for them to save and move ahead.
- 22 percent closer to view: Most people who live in poverty are poor because they make bad decisions or act irresponsibly in their own lives.
Voters across racial and educational lines believe in the principles and values that define the social safety net. On the choice between ensuring that all families have access to basic living standards or the idea that welfare programs trap people in poverty, 55 percent of white noncollege-educated voters, 63 percent of black voters and 58 percent of Latino voters choose the first statement over the second as being closer to their own views. Ideology emerges as the only real dividing line on this particular choice: Self-identified conservative or libertarian Republicans emerge as the only group with a majority—53 percent—favoring the idea that welfare programs keep people in poverty and create dependency.
Likewise, conservative or libertarian Republicans are also the only partisan and ideological group with a majority—60 percent—believing the statement, “There is widespread abuse and fraud of welfare programs by poor people and those looking to avoid work,” over one that says, “While there are certainly some cases of fraud and abuse, in general, government assistance programs work as intended and do help people genuinely in need.” In contrast, 72 percent of liberal or progressive Democrats and 59 percent of moderate, conservative, or libertarian Democrats believe these programs generally work as intended, while a slight plurality of progressive, liberal, or moderate Republicans believe that there is widespread abuse and fraud.
Voters oppose proposals to cut and restrict government assistance programs, with noticeable partisan divides
The heart of the survey examined voter attitudes toward budgetary proposals aimed at restricting access to and reducing funding for a range of government programs designed for low-income Americans. On both a general test of the issue and on nearly all of the specific proposals, this study finds that voters across demographic lines oppose these ideas and proposals.
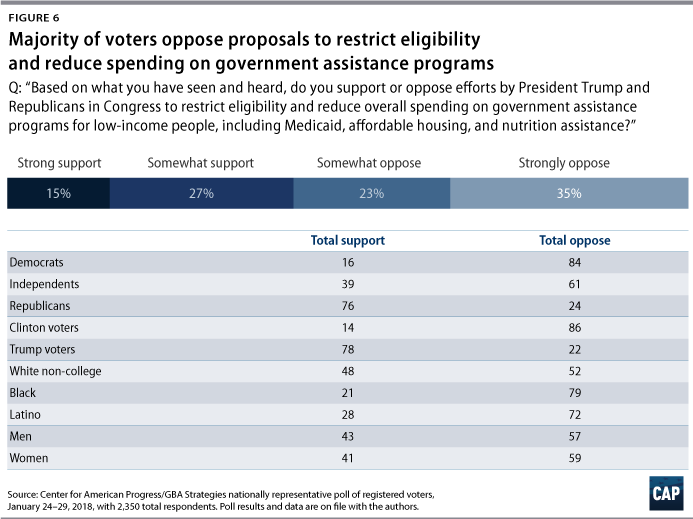
The survey asked participants, “Based on what you have seen and heard, do you support or oppose efforts by President Trump and Republicans in Congress to restrict eligibility and reduce overall spending on government assistance programs for low-income people, including Medicaid, affordable housing, and nutrition assistance?” Fifty-eight percent of voters overall oppose these proposals, including 52 percent of white noncollege-educated voters, 79 percent of black voters, and 72 percent of Latino voters. Large partisan divides emerge on this general test of restricting eligibility and reducing funding for assistance programs: 76 percent of self-identified Republicans support these efforts, while 84 percent of self-identified Democrats and 61 percent of self-identified independents oppose them.
Opposition to these ideas grows considerably when voters are presented with ideas featured in the president’s new budget. The study asked respondents whether they support or oppose a series of proposals recently put forth by President Trump and majority leaders in Congress. Overall, opposition to all but one of these specific ideas ranges from nearly 60 percent to 80 percent of voters.
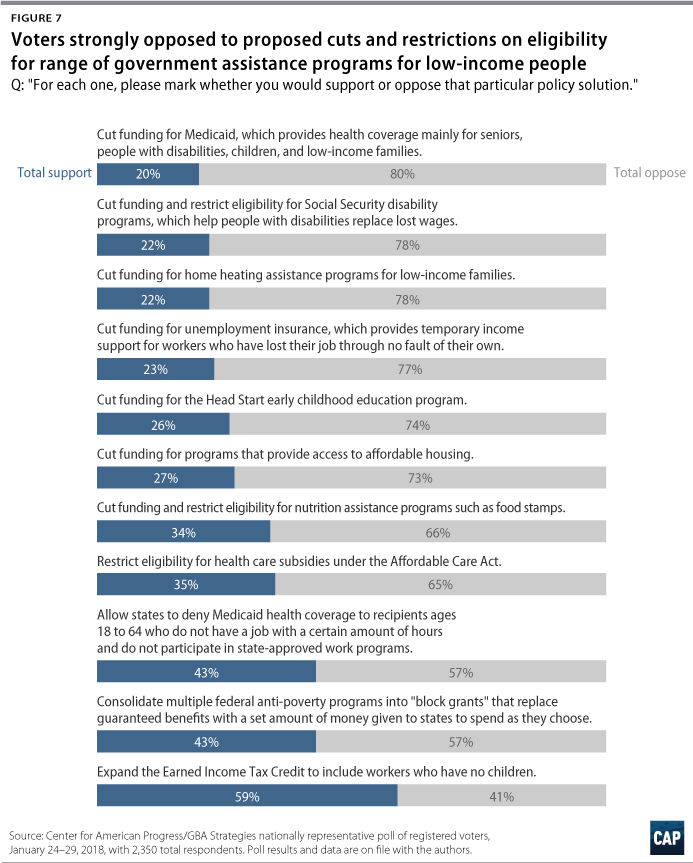
Most notably, as seen in Figure 7, proposed Medicaid cuts receive the broadest and most intense opposition of any proposal tested in the study. Eighty percent of voters overall oppose the idea of cutting Medicaid, including 56 percent of voters who strongly oppose it. This study also finds that 57 percent of American voters oppose the idea of allowing states to deny Medicaid health benefits to people who do not have a job or do not participate in state-approved work programs. A similar share—57 percent—of voters likewise oppose proposed block grants to states.
The only idea under current consideration that receives majority support from voters overall—59 percent—is a proposal to expand the Earned Income Tax Credit (EITC) for childless workers.
Majorities of Trump voters and Republicans oppose six of these 11 specific ideas, including proposed cuts to Medicaid; housing and heating assistance; Social Security disability programs; unemployment; and Head Start. Solid majorities of Democrats, independents, African Americans, Latinos, and white noncollege-educated voters oppose all of these ideas, with the exception of the proposal to expand the EITC.
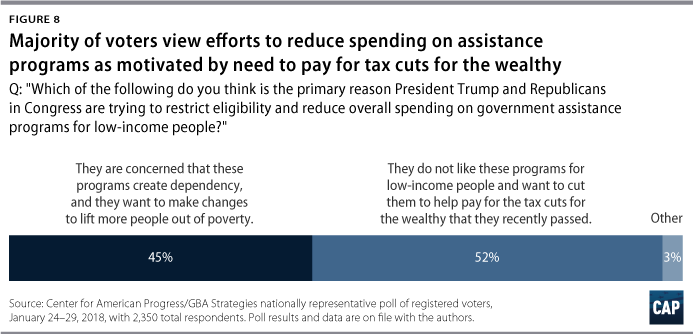
The study also asked participants to assess the primary rationale for why they think the president and leaders in Congress have put forth these proposed restrictions and cuts to government assistance programs. Fifty-two percent of voters overall believe their primary motivation is, “They do not like these programs for low-income people and want to cut them to help pay for the tax cuts for the wealthy that they recently passed.” Forty-five percent of voters overall believe the alternative position: “They are concerned that these programs create dependency and they want to make changes to lift more people out of poverty.”
Opinions on the motivation for these proposals are entirely split along partisan lines: 78 percent of self-identified Democrats say that Trump and congressional leaders are proposing these cuts and restrictions because they do not like the programs and want to help pay for tax cuts, while 78 percent of self-identified Republicans believe their leaders are doing this out of concern about the programs and the desire to lift people out of poverty. A plurality of independents—50 percent—side with Democrats on the matter, believing their primary motivation is to pay for tax cuts.
In terms of why people might support or oppose these ideas, a majority of voters—55 percent—who say they support these general efforts overwhelmingly cite, “There are too many people abusing government assistance programs” as the best reason to support them. In contrast, among voters who are opposed to these general proposals, 47 percent say the primary reason for their opposition is, “We shouldn’t cut assistance for struggling families to fund tax breaks that mainly benefit the wealthy and big corporations.” Another 21 percent of opponents believe these proposals “will punish millions of Americans and deny them access to basic living standards”; 17 percent say that it “does nothing to address the real problems of low wages and not enough jobs”; and another 14 percent believe that we “have a moral obligation to help those in need.”
In a political sense, these prospective cuts and restrictions to government assistance programs are not well-received by many American voters. Study participants were asked, “Thinking about the election for Congress later this year, would you be more likely or less likely to vote for a candidate who supports each of the following proposals, or would it make no difference in your vote?” Solid majorities or pluralities of Americans say they are less likely to vote for a candidate who supports the ideas to cut or restrict government assistance programs. (see text box)
Many respondents less likely to vote for a candidate who supports cutting or restricting assistance programs
Cut and restrict eligibility for Social Security disability programs
- More likely to support: 20 percent
- Less likely to support: 61 percent
Cut funding for Medicaid
- More likely to support: 19 percent
- Less likely to support: 60 percent
Cut funding for unemployment insurance
- More likely to support: 20 percent
- Less likely to support: 56 percent
Cut funding for the Head Start early childhood program
- More likely to support: 20 percent
- Less likely to support: 56 percent
Cut funding for home heating assistance programs
- More likely to support: 19 percent
- Less likely to support: 56 percent
Cut funding for programs that provide access to affordable housing
- More likely to support: 22 percent
- Less likely to support: 55 percent
Cut funding and restrict eligibility for nutrition assistance programs
- More likely to support: 23 percent
- Less likely to support: 54 percent
Among those voters who say they are “almost certain” to vote in 2018, anywhere from 55 percent to 62 percent say they are less likely to back a candidate who supports these proposed cuts to the social safety net, with ideas for cutting Social Security disability programs and Medicaid producing particularly intense opposition.
Perceptions about work requirements and program consolidation sharply divided along partisan and ideological lines
As seen in the previous section, nearly 6 in 10 voters, or 57 percent, oppose recent proposals to allow states to deny Medicaid health coverage to recipients who are ages 18 through 64 who do not have a job with a certain amount of hours and do not participate in state-approved work programs. This finding suggests that there are attitudinal barriers to people accepting so-called work requirements when the consequences of these proposals are made clear to voters. However, this study finds that these views are not uniformly shared across partisan lines. For example, 78 percent of self-identified Democrats oppose the proposal to allow states to deny Medicaid to people who do not have a full-time job or otherwise participate in state-approved work programs, while 67 percent of self-identified Republicans support the idea. Self-identified independents are split 50-50 on the matter.
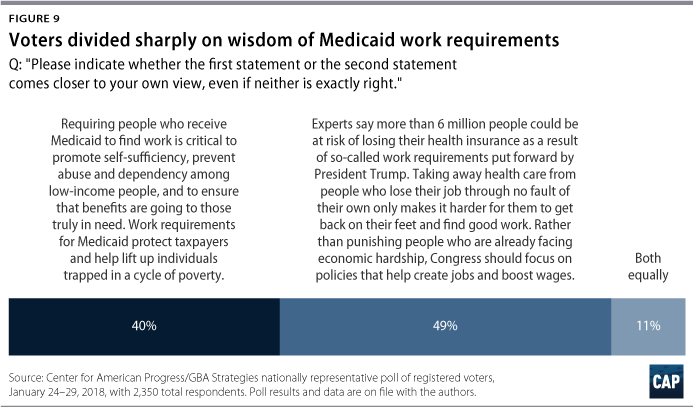
In a further test of this issue, the survey presented participants with two alternative statements that juxtapose reasons to support work requirements with reasons to oppose them. In contrast to the common perception that work requirements receive widespread public support, this study finds Americans deeply divided on the issue when presented with a balanced look at the issues at hand.
Forty-nine percent of voters overall say their views align more closely with the statement: “Experts say that more than 6 million people could be at risk of losing their health insurance as a result of so-called work requirements put forward by President Trump. Taking away health care from people who lose their job through no fault of their own only makes it harder for them to get back on their feet and find good work. Rather than punishing people who are already facing economic hardship, Congress should focus on policies that help create jobs and boost wages.” In contrast, 40 percent of voters say their views are closer to this statement: “Requiring people who receive Medicaid to find work is critical to promote self-sufficiency, prevent abuse and dependency among low-income people, and to ensure that benefits are going to those truly in need. Work requirements for Medicaid protect taxpayers and help lift up individuals trapped in a cycle of poverty.” Another 11 percent of voters say that both statements equally match their views on the issue.
Partisan divides on this issue test are stark. Sixty-seven percent of self-identified Democrats worry more about the consequences of these requirements, while 59 percent of self-identified Republicans favor these requirements for Medicaid when both positions are explained more fully. Self-identified independents worry more about the consequences of these requirements by a 44 percent-to-39 percent margin.
In a separate test of arguments for and against consolidating a range of government assistance programs and giving states money to spend as they see fit, voters overall are similarly divided on the wisdom of recent proposals that Republicans have put forth.
Thirty-nine percent of voters say this statement comes closer to their views: “We need to break down the federal bureaucracy of 92 anti-poverty programs and instead give states one sum of money, with the flexibility to work with private non-profit groups and individual caseworkers assigned to each recipient to develop custom plans for each person to lift themselves out of poverty permanently.” In comparison, 44 percent of voters say this argument is closer to their own position: “Lump-sum grants for anti-poverty programs are just another way of shifting costs onto the states and forcing cuts in funding for health care, housing, and nutrition assistance programs. Rather than restricting access to basic living standards for people down on their luck, politicians should instead pass laws that help people find good jobs with decent wages.” Sixteen percent of voters say that both statements fit their views.
Again, the study finds inverse attitudes between self-identified Democrats and Republicans on the issue of consolidation and block grants, with 61 percent of Democrats siding against lump-sum grants for anti-poverty programs and 58 percent of Republicans agreeing with these proposed changes.
Voters favor far-reaching government action on jobs and economic security
Exploring other policy ideas that have been put forth on jobs and infrastructure investments, this study finds that American voters overwhelmingly back more promising proposals to put people directly to work, invest in local communities, and provide more economic security for families.
The survey presented a series of alternative proposals to the ones put forth by President Trump and congressional majority leaders for restricting eligibility and cutting funding for government assistance programs and asked participants whether they support or oppose each idea. Large majorities of voters support these ideas, with anywhere from 7 in 10 to more than 8 in 10 American voters supporting the following proposals:
- 81 percent total support: Invest $1 trillion over the next five years on comprehensive infrastructure needs including physical infrastructure like roads, bridges, airports and public transport; energy infrastructure to increase production and use of clean energy; and human infrastructure to help workers with good jobs that pay decent wages, affordable education, and child care support.
- 80 percent total support: Enact basic family-friendly policies including paid family and medical leave and paid sick days for workers.
- 79 percent total support: If individuals receiving government assistance to make ends meet can’t find work, the government should hire them directly to work rebuilding roads, bridges, and schools or training them to be teachers, home health care aides, or child care providers.
- 78 percent total support: Help low wage workers afford quality child care and make universal pre-kindergarten available for all children.
- 77 percent total support: For workers who lose their jobs to foreign competition, automation, or relocation, provide a salary and tuition to receive hands-on training in new skills and technology needed to fill available jobs in their communities.
- 77 percent total support: Create wage boards that bring together businesses, government, and workers to ensure fair wages for employees across a specific industry and prevent employers from abusing the availability of cheap labor to drive down wages.
- 76 percent total support: Ensure that all young people aged twenty-five or under are placed in a job, an apprenticeship, or enrolled in continuing education toward a specific vocation within six months of leaving school or a job.
- 72 percent total support: Expand rental assistance for all low-income families spending more than half of their income on rent each month.
These ideas receive widespread approval across demographic and partisan lines. Strong majorities of all racial and ethnic; gender; age; and education-level groups support these policy ideas on jobs, wages, and investments, as do large majorities of self-identified Democrats and independents. Majorities of Republicans support all of the tested ideas, with the exception of a proposal to increase the minimum wage.
Conclusion
The evidence is overwhelming that voters are not sold on proposals to cut funding and restrict eligibility for government assistance programs, from health care, unemployment insurance, and housing, to nutrition assistance and early childhood education. Although there are noticeable partisan divides on many of the questions in this survey, majorities of voters oppose these ideas in the abstract—and oppose them more intensely when presented with the specifics. Many voters face serious economic challenges and believe that the government plays a vital role in helping people in need access basic living standards.
Instead of more punitive measures designed to reduce Americans’ access to a solid standard of living and cut necessary benefits for low-income and other Americans facing economic difficulties, this study finds clear evidence that voters are ready to back bold ideas on jobs, investments, and other economic security measures. Political leaders across the board would be wise to heed these findings and pursue policies that American voters genuinely want and need in order to live more stable and secure lives.
About the authors
John Halpin is a senior fellow at the Center for American Progress and the co-director of the Center’s Progressive Studies Program, an interdisciplinary project studying public opinion, political ideology, and demographic change.
Karl Agne is a principal and co-founder of GBA Strategies, a progressive polling and strategic communications firm.
Acknowledgments
The authors would like to thank Meghan Miller, Shanée Simhoni, and Chester Hawkins for their great editorial and design assistance, and Melissa Boteach, Rebecca Vallas, and Jeremy Slevin for all their input and feedback on the survey design.
Authors’ note: The Center for American Progress/GBA Strategies national poll results and data are on file with the authors.