People living in single-parent families are much more likely to have low incomes and experience economic hardships than those living in both married and unmarried partnered families with children. At the same time, however, the vast majority of people in low-income families with children are in families headed by married or unmarried partners, as are most people in families with children that receive means-tested benefits. This fact flies in the face of claims that marriage is a panacea for poverty.
This issue brief provides basic facts about differences in low-income rates for three family types—married-couple, cohabiting-couple, and single-parent families with children—and looks at, by family type, the share of low-income people in families with children and the share of people in families with children that receive major means-tested benefits. The hope is that facts such as these will generate a more balanced debate, one that acknowledges and addresses differences in economic hardship by family structure without minimizing the extent of married and partnered poverty in the United States.
The key facts detailed in this brief include the following:
- Slightly more than one in four people in married-couple households with children—26 percent—are low income, having incomes under 150 percent of the Supplemental Poverty Measure, or SPM, compared with about half—46 percent—of people in cohabiting-couple households and 60 percent of those in single-parent households.
- Just more than half of one-parent, unmarried family groups—about 53 percent in 2015—are maintained by a parent who is divorced or is currently separated from his or her spouse.
- Some 33.1 million Americans—two out of every three people in low-income families with children—are in low-income families headed by partnered couples, which breaks down to roughly 27.75 million people in married-couple households and another 5.35 million people in domestic-partner households. About 17.3 million people in low-income families with children are in families headed by single parents—mostly mothers. Among people in higher-income families, 77.5 million are in married-couple families—81 percent; 6.3 million are in cohabiting-couple families—7 percent; and 11.4 million are in single-parent families—12 percent.
- 69 percent of people in low-income families with children who receive means-tested benefits that supplement low incomes are in married-couple or domestic-partner families.
- Some 11.3 million people in families with children, who are able to avoid poverty because of means-tested benefits that supplement low incomes, are in married or coupled families.
- Among nonelderly people in families who receive Medicaid, the majority live in married-couple families.
- 19 states have yet to expand Medicaid to eligible low-income adults—those with incomes under 138 percent of the federal poverty level—despite the availability of federal funds that would cover nearly all of the cost. The practical effect is that substantial numbers of low-income married adults, as well as single adults and adults in unmarried couples, are denied Medicaid based solely on their state of residence. Low-income married adults in California, for example, are much more likely to have health insurance than low-income married adults in Texas, with the difference largely due to Medicaid availability.
- Among low-income parents who are eligible for means-tested child care assistance but do not receive it because of inadequate federal and state funding, the majority are in married or cohabiting-parent families.
Most of the facts detailed in this brief come from a report on federal low-income programs published in 2015 by the U.S. Government Accountability Office, or GAO. The report was written in response to a request made by Sen. Jefferson Sessions (R-AL) and Rep. Gary Palmer (R-AL) for information on federal programs targeted to low-income individuals, as well as on their household characteristics. As explained in the Appendix, this brief defines “low income” as 150 percent of the SPM—about $38,000 per year for a married couple with two children—taking into account a more comprehensive set of family expenses and income than the official poverty measure, or OPM.
The economic and emotional stresses that millions of partnered but struggling Americans face can have corrosive effects on their relationships. These strains increase the likelihood of separation among economically struggling couples compared with prosperous ones. Economic and emotional stresses also may reduce the likelihood that unmarried couples—who are more likely to separate than married ones—eventually marry. To reduce poverty across family types and increase the stability of low-income married and partnered couples, America needs to ensure that working-class people get a better deal: higher wages; more of the work-family benefits that high-income couples already receive; affordable health insurance regardless of where they live; and greater access to assistance, including unemployment insurance, Temporary Assistance for Needy Families, and the Child Tax Credit, which all help families make it through rough patches.
In the words of Pope Francis, it is worth asking: “How many problems would be solved if our societies protected families and provided households, especially those of recently married couples, with the possibility of dignified work, housing and healthcare services to accompany them throughout life.” At the same time, efforts to bolster the economic security of struggling married and partnered families should not come at the expense of single-parent families, who generally face greater time and resource constraints than married parents. Put simply, the best family policies are the ones that value all families.
Acknowledging the rise of cohabiting-couple families in public policy debates
When the official poverty measure was developed in the 1960s, there were relatively few unmarried domestic partners. But cohabitation has become increasingly normative since then. In fact, most young couples today will cohabit before they marry. The increasing importance of cohabitation is particularly striking among young people. In 2014, about one out of every six adults—16.8 percent—between ages 25 and 29 were in cohabiting-couple relationships, compared with about two out of every six adults in the same age range who were married.
Over the past several decades, the share of births to single mothers has remained stable, but the share of births to cohabiting mothers has increased fourfold, from 6 percent in the early 1980s to about 25 percent today. The largest increase of births to cohabiting mothers is among white and Hispanic mothers, respectively, and among those with a high school diploma or some college short of a bachelor’s degree. Among new parents who are cohabiting at their first child’s birth, about half go on to marry within five years.
Among people living in families with minor children today, roughly 12 million people live in families headed by cohabiting couples, or about 8 percent of all people in families with minor children. Because cohabitation is typically a transitional stage that happens both before marriage and after divorce, substantially more than 8 percent of all children will spend some time in a cohabiting-couple family. Demographers Sheela Kennedy and Larry Bumpass have estimated that about half of children today will live in a cohabiting-couple family at some point during their childhood, a substantial increase compared with previous generations. This increase is due both to an increase in the share of children born to cohabiting couples and to more children having parents who live in cohabiting-couple families after their biological parents divorce or separate.
Historian Elizabeth Pleck has written that “the history of cohabitation in recent decades is in a sense about the widespread denial of the reality that Americans will spend a growing proportion of their lives outside of legal marriage and that cohabitation has for many become a form of family.” In many ways, analysis of public policy related to family and economic security continues to deny the reality of unmarried domestic partnerships.
Of particular relevance for the purposes of this brief is the way that the OPM distorts public understanding of poverty among families with children. The OPM treats unmarried partners as sharing income and expenses only if they have a child in common and does not allow for easy identification of unmarried-partner families, even if they have a child in common. In the official poverty statistics published annually by the Bureau of the Census, for example, there are only three types of families: married couples; female householder with no husband present; and male householder with no wife present. Unmarried-partner families are all put in one of the latter two categories—female householder or male householder—even if composed of a biological mother and biological father of a child in the household.
For purposes of analyzing differences in poverty by household type, the newer Supplemental Poverty Measure that the Census Bureau developed is more useful than the OPM because it treats unmarried partners living together as sharing income and expenses and allows for easy identification of unmarried-couple families. According to an analysis by the Census Bureau’s Ashley Provencher, when the SPM’s unit of analysis is used in place of the OPM’s, there were about 7.3 million previously unrecognized cohabiting-couple householder families, and 3.8 million fewer single-female and single-male householder families. Moreover, preliminary research by Liana Fox and her colleagues at Columbia University using the SPM suggests that there has been a much larger increase in poverty among cohabiting couples with children over the past 15 years than among either married or one-adult families with children, a trend that is invisible in Census statistics using the OPM. Thus, the SPM is used in this brief because it provides a fuller picture than the OPM of trends in poverty and near-poverty by family structure. For further discussion of this, see the Appendix.
Acknowledging the rise of cohabitation also requires acknowledging the real differences between it and marriage. Cohabiting relationships, including ones between parents, are less stable than marriages, on average. As sociologists Laura Tach and Kathryn Edin have noted, “there is considerable debate over the sources of this instability.” In their research, Tach and Edin find that “demographic, economic, and relationship differences explain more than two-thirds of the increased risk of dissolution for unmarried parents relative to married parents.” They also find, somewhat surprisingly, that “the stability of marital unions is more sensitive to relationship and economic conditions after a child’s birth than the stability of nonmarital unions.” [italics in original]
A related issue is whether cohabitation among families with children will become more stable over time as it becomes more normative, or, alternatively, less stable over time as it becomes more a marker of class divergence. In recently published work, researchers Kelly Musick and Katherine Michelmore found that among couples cohabiting at the birth of their first child, about half go on to marry within five years, and that after controlling for the respondent parent’s education and other background characteristics, these couples face no greater risk of separation than those who are married at birth. However, they also found that cohabiting couples who do not marry within five years after the birth of their first child face much higher risks of separation. Unlike Tach and Edin, Musick and Michelmore used a data set that did not include relationship quality or partners’ economic status, factors which may explain much of the difference in stability for couples who did not go on to marry.
Most people in low-income families with children live in married-couple families
More than half—55 percent—of people in low-income families with children—nearly 28 million Americans—live in married-couple families with children. In addition, slightly more than 1 in 10 people in low-income families with children live in domestic-partner families. In sum, two-thirds of all people living in low-income families with children—33.1 million people—live in married or domestic-partner families. By comparison, among people in higher-income families, 77.5 million are in married-couple families, or 81 percent; 6.3 million are in cohabiting-couple families, or 7 percent; and 11.4 million are in single-parent families, or 12 percent. Table 1 shows the number of people in families with children by partnership status, both overall and by low-income status.
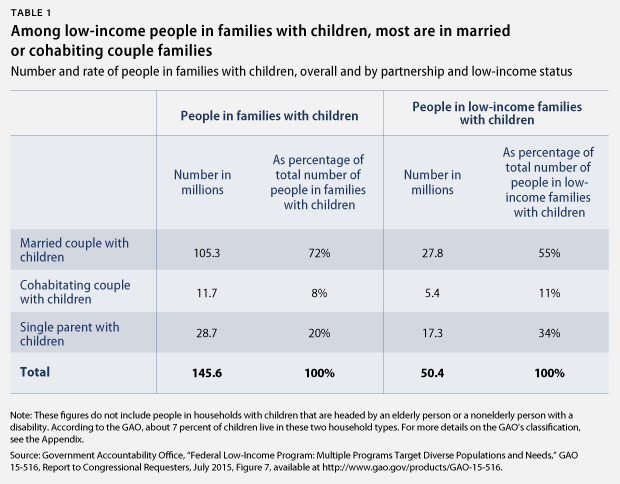
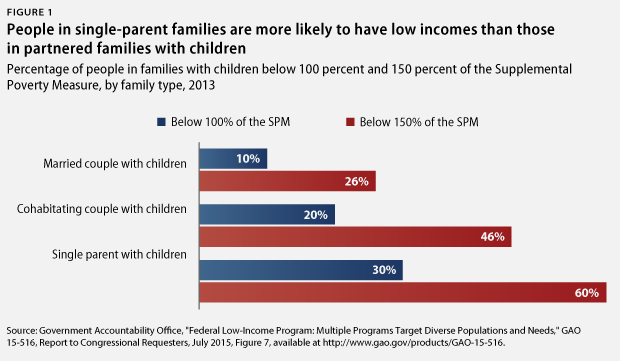
Figure 1 shows the low-income rate by family type—that is, the percentage of people in each family type who have family incomes below 150 percent of the SPM. Slightly more than one in four of people in married-couple households with children—26 percent— are low income, compared with about half—46 percent—of those in cohabiting-couple households and 60 percent of those in single-parent households.
The reason why people in single-parent families are more likely than people in married and coupled families to have low incomes is straightforward. For starters, families with more than one adult have more potential adult workers who are able to pool earnings and share housing and other costs and benefit from economies of scale in household consumption. Moreover, the heads of single-parent families are more likely to belong to economically disadvantaged groups than parents in married-couple families. For example, mothers head the vast majority of families that include only one adult, and mothers as a group face discrimination in the workforce both because they are women and especially because they are mothers. If women were paid the same as comparable men, the poverty rate for working single mothers would be cut nearly in half, according to an estimate from the Institute for Women’s Policy Research.
At the same time, the high rate of economic insecurity for cohabiting couples is striking. The difference in low-income rates between people in cohabiting-couple and single-parent families is much smaller—14 percentage points, or 32 percent—than the difference in low-income rates between married and cohabiting couples—20 percentage points, or 74 percent.
The data beg the question: Why are people in cohabiting couples so much more likely to have low incomes than people in married couples, even though both family types typically have the same number of potential adult workers? The difference is largely due to economics and demographics. Compared with adults in married-couple families, adults in cohabiting-couple families are more likely to work in poorly compensated jobs; are younger, on average; are more likely to be African American or Latino; and are less likely to have a bachelor’s degree or higher.
Moreover, with two potential adult workers, why is the percentage of people in cohabiting-couple families with low incomes so much closer to the percentage of people in single-parent families with low incomes than the percentage for married-couple families? As noted above, single-parent families are 32 percent more likely to have low incomes than cohabiting-couple families, while cohabiting-couple families are 74 percent more likely to have low incomes than married-couple families. Again, economic and demographic factors explain much of the difference. Many single parents have been married: Those individuals tend to be older and have other demographic advantages compared with parents in cohabiting couples. Also, single-parent families are much more likely to include grandparents or other adult relatives: 29 percent of children in single-parent families reside with grandparents or other adult relatives—not including siblings—compared with only 9 percent of children with married parents and 13 percent of children with cohabiting parents.
People in partnered families are the largest share of recipients in means-tested programs for low-income families
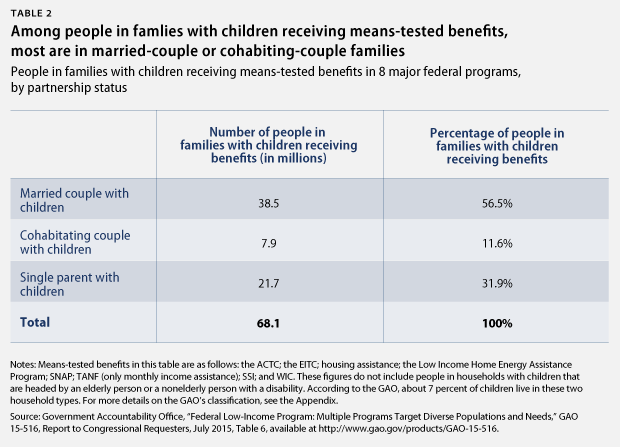
More than half of the people—57 percent—who receive benefits from the eight major federal means-tested benefits programs—the Additional Child Tax Credit, or ACTC; the Earned Income Tax Credit, or EITC; housing assistance; the Low Income Home Energy Assistance Program; the Supplemental Nutrition Assistance Program, or SNAP, formerly known as food stamps; income assistance through the Temporary Assistance for Needy Families, or TANF, program; Supplemental Security Income, or SSI; and the Special Supplemental Nutrition Program for Women, Infants, and Children, or WIC— live in married families, as shown in Table 2. Another 12 percent live in cohabiting couple families with children. Nearly one-third of people in low-income families with children receiving means-tested benefits live in single-parent families. In short, among people in families who receive means-tested benefits from major federal programs, marriage or a domestic partnership is the norm, not the exception.
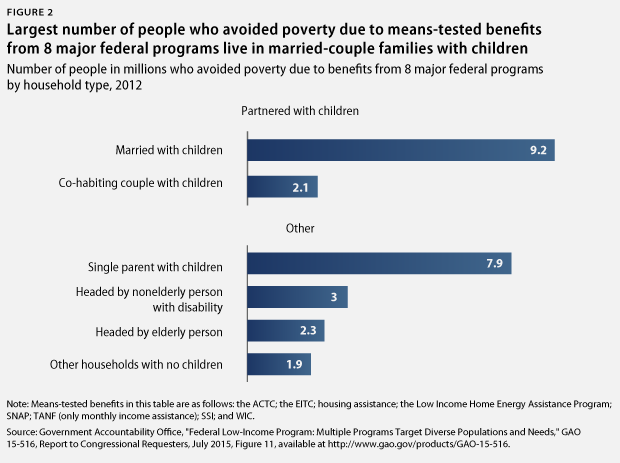
The Government Accountability Office, in its report “Federal Low-Income Programs: Multiple Programs Target Diverse Populations and Needs,” estimated that about 19.2 million people in families with children would have been poor—with income below 100 percent of the SPM—if they had not received benefits from one of the eight federal programs listed above. As Figure 2 shows, about 9.2 million people in married couples with children were able to avoid poverty thanks to means-tested benefits, as were another 2.1 million people in cohabiting-couple families with children in 2012. Thus, most people in families with children who are able to avoid poverty with the help of means-tested benefits are people in married- or cohabiting couple families.
The means-tested programs that help married and unmarried couples most
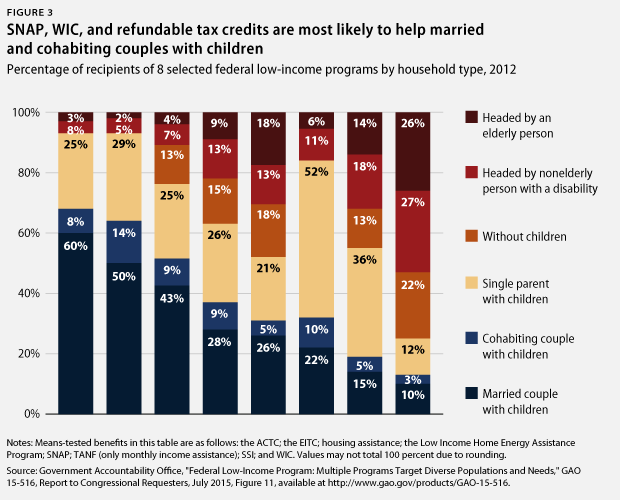
The share of people in married- and domestic-partner couple families who receive benefits is larger than the share of people in single-parent families for all of the federal means-tested benefit programs, except for TANF and housing assistance. Figure 3 shows the distribution of people who receive means-tested benefits in eight major federal programs by household type.
It is notable that the programs in this figure, which are the most likely to help low-income couples—particularly SNAP, the ACTC, WIC, and the EITC—share some common characteristics. Unlike TANF, they are not block grant programs, which give states nearly unlimited discretion to set benefit levels and income eligibility standards; they also do not include explicit language in their authorizing legislation to “encourage the formation and maintenance of two-parent families.” Two of the programs—the EITC and the ACTC—condition benefits on someone in the tax unit having earnings, and SNAP includes employment- and training-related requirements. But none of the programs have the kind of rigid rule found in TANF that requires 90 percent of two-parent families receiving assistance to be engaged in 35 hours to 55 hours of work activities each week. In congressional testimony last year, Eloise Anderson, secretary of the Wisconsin Department of Children and Families serving under Republican Gov. Scott Walker, argued that this TANF rule created a “disincentive to marry or be in a stable family.”
Conservatives have pushed TANF as a model for even larger block grant schemes that encompass SNAP and other programs. Yet SNAP is clearly a program that now works for people in struggling married and coupled families with children, while TANF is clearly failing these families despite having an explicit goal to “encourage the formation and maintenance of two-parent families.” Instead of trying to turn SNAP into TANF— or repealing SNAP reforms, such as broad-based categorical eligibility, that have eased access to the program for struggling married families—it is time to consider reforming TANF along the lines of SNAP.
A look at other means-tested programs: Medicaid, the premium tax credit, and child care assistance
The GAO’s report does not include data on benefit receipt by family type for three other major means-tested programs: Medicaid, the premium tax credit, and child care assistance. As summarized below, other available research suggests that marriage and domestic partnerships are common among families receiving benefits from these programs.
Medicaid
In terms of both dollars and the number of people helped, Medicaid is the single largest means-tested program in the United States. According to data from the Bureau of the Census, among people in families who receive health insurance from Medicaid, most are in married-couple families. In 2014, about 28.1 million nonelderly people in marriedcouple families received Medicaid. By comparison, about 23.8 million nonelderly people in other family types, including cohabiting couples, received Medicaid. Unlike the GAO data, both of these figures include families without children, as well as those headed by people who have a disability.
That being said, there are still some significant policy barriers to Medicaid access for struggling adults, including barriers that may disproportionately affect low-income married parents. Most notably, 19 states have yet to expand Medicaid to eligible low-income adults—those with incomes under 138 percent of the federal poverty level—despite the availability of federal funds that would cover nearly all of the cost. The practical effect is that substantial numbers of struggling married adults are denied Medicaid based solely on their state of residence. For example, 80 percent of married nonelderly adults in low-income families in California have health insurance coverage. By contrast, only 52 percent of such married adults in Texas have health insurance coverage. The difference is mainly due to access to Medicaid. California has expanded Medicaid, while Texas has not. In California, nearly half of married nonelderly adults in low-income families receive coverage through Medicaid; in Texas, only 16 percent have Medicaid coverage.
States such as Texas that fail to expand Medicaid likely exacerbate marriage penalties in Medicaid because parents in these states must have extremely low incomes to qualify for Medicaid. According to the Kaiser Family Foundation, the median income eligibility limit for Medicaid for parents in nonexpansion states is only 44 percent of the federal poverty level.
Premium tax credit for health insurance
The premium tax credit is a refundable tax credit that subsidizes part of the cost of purchasing health insurance through health benefit exchanges for people with incomes between 100 percent and 400 percent of the federal poverty level. The premium tax credit has only been in place since 2014. While there appears to be no research yet on the receipt of the tax credit by family structure, married and coupled families will likely benefit disproportionately from the credit given its income range—among people in families between 100 percent and 400 percent of the federal poverty level, considerably more are married or coupled than single—and the fact that it is available to all people who meet the eligibility standards.
Child care assistance
GAO’s report also does not include data on the Child Care and Development Block Grant, or CCDBG, which provides federal funds to states for means-tested child care assistance. In fiscal year 2014, about 853,000 families, on average, received child care assistance each month through the CCDBG. Because funding for the CCDBG is capped at an inadequate level and has declined in real terms over the past 15 years, only about one in six children whose families meet CCDBG eligibility requirements actually receive assistance.
Research conducted by Chris Herbst at Arizona State University found that about one-third of households that received child care assistance in 2002 were headed by two parents. Thus, most households that received child care assistance were headed by a single parent, but among all parents who benefited from the CCDBG, about as many were cohabiting or married as were single.
Herbst also found that among low-income households that were eligible for but did not receive child care assistance, the majority, roughly 60 percent, were headed by two parents. Herbst’s research is somewhat dated, so the demographics of families receiving the CCDBG—as well as those eligible for but not receiving it—may have changed since then. For example, the increase in low-income cohabiting-couple families may mean that a greater share of children eligible for the CCDBG are in cohabiting-couple families. Moreover, because inflation-adjusted federal funding for the CCDBG is more than $1 billion lower today than in 2002, the program may have become more restrictive in ways that disproportionately affect struggling parents who are married or cohabiting.
It is worth contrasting the CCDBG with the Child and Dependent Care Tax Credit, or CDCTC. In dollar terms, the CDCTC is nearly as large as the CCDBG: The Joint Committee on Taxation estimates that the CDCTC will cost about $4.7 billion in 2015, compared with $5.38 billion allocated to the CCDBG. But the vast majority of CDCTC funds go to upper-middle and high-income families. As a practical matter, upper-middle and high-income married parents who pay for child care are guaranteed a subsidy for the purchase of child care assistance, while most working-class married parents who are financially eligible for child care help through the CCDBG do not receive any help at all.
Conclusion
Marriage and domestic partnerships are common occurrences rather than exceptions among Americans living in low-income families with children. The wrongheaded idea that marriage is a panacea for poverty distorts reality and renders invisible the economic struggles of millions of married and partnered Americans.
The economic and emotional stresses that millions of partnered but impoverished Americans face often have corrosive effects on relationships. This increases the likelihood of separation among struggling couples compared with prosperous ones. For those who believe that government and civil society should play a proactive role in bolstering marriage and family stability, the failure to acknowledge the extent of married and coupled poverty is counterproductive. As researchers Amber Lapp and David Lapp, writing from a pro-marriage conservative perspective, have noted, “The prevalence of low-wage work raises challenges for married couples, but the very people who most care about strengthening marriage are typically the ones absent from the conversation about a living wage, or at least on the defensive.”
Appendix
Background on the data used in this brief
Most of the data that the authors highlight in this brief comes from a 2015 Government Accountability Office report—“Federal Low-Income Programs: Multiple Programs Target Diverse Populations and Needs”—that was published in response to a request made by Sen. Jefferson Sessions and Rep. Gary Palmer. The GAO report identified federal programs targeted to low-income individuals and provided data on the number and select household characteristics of low-income people using the Census Bureau’s Supplemental Poverty Measure, as well as the number, incomes—as a percentage of the SPM—and household characteristics of people receiving benefits from low-income programs.
How GAO classified households
For its data analysis, GAO divided the U.S. population into six mutually exclusive household types:
- Married couple with children: The household head is not disabled or elderly.
- Unmarried couple with children: The household head is not disabled or elderly.
- Single parent with children: The household head is not disabled or elderly; single parents include parents who are married but say they are “separated” from their spouse.
- Person with a disability who is under age 65: The household head is either with or without children and may have any marital status.
- Elderly person: The household head is either with or without children and may have any partnership status.
- Person under age 65 without a disability: The household head does not have children and may have any partnership status.
This brief uses the term “people in families with children” to refer to people in the first three household types in the GAO classification. In 2013, according to GAO, about 93 percent of all children in the United States lived in the first three household types, so the numbers highlighted in this brief modestly undercount the number of people living in families with children—and in all three of the household types highlighted—who have low incomes or receive means-tested benefits.
How this brief defines low-income families with children
GAO calculated the number of people in 2013 in each of the six household types using different percentages of the Census Bureau’s SPM, including 50 percent, 100 percent, 150 percent, and 200 percent.
This brief uses 150 percent of the SPM as a conservative measure of low-income status. Before adjusting for geographic differences in housing costs, 150 percent of the SPM threshold was equal to $38,190 for a two-adult, two-child family that rents their housing. The threshold for the same family was slightly higher—$38,766—if they were paying a mortgage and significantly lower—$32,070—if they owned a home outright and paid no mortgage. The SPM threshold used by GAO further adjusts, both upward and downward, for geographic differences in housing costs. So, for example, 150 percent of the SPM in nonmetropolitan Alabama for a family of four with a mortgage was $30,800, compared with $40,747 for a family of four with a mortgage in Chicago.
These thresholds are conservative measures of low-income status that fall substantially below the amount of income that most Americans say a two-adult, two-child family needs to get by in their community. In a November 2013 survey, Americans were asked, “How much annual income do you think a family of four would need to earn to be safely out of poverty and in the middle class?” The mean response was $54,619. Similarly, in 2007, Gallup asked Americans what they thought was “the smallest amount of yearly income a family of four would need to get along in your local community.” The average of responses was $52,087 per year, and the median response was $45,000. Adjusted for inflation, these amounts would be $59,748 and $51,618, respectively, in 2015.
Moreover, the low-income threshold used in this brief falls even further behind typical disposable household incomes for four-person households in the United States: Median disposable household income for four-person households was $64,630 in 2014, and average disposable household income was $82,912.
Advantages of using the SPM for analyses of low-income families by family type
For purposes of analyzing differences in poverty by household type, the SPM is more useful than the official poverty measure because it treats unmarried partners who are living together as sharing income and expenses and allows for easy identification of unmarried-couple families. The OPM, by contrast, treats unmarried partners as sharing income and expenses only if they have a child in common and does not allow for easy identification of unmarried-partner families, even if they have a child in common.
For example, in the official poverty statistics published annually by the Census Bureau, there are only three types of families designated: married couples; female householder with no husband present; and male householder with no wife present. Unmarried-partner families are all put in one of the latter two categories—female householder or male householder—even if composed of a biological mother and biological father of a child in the household. According to an analysis by Ashley Provencher, when the SPM’s unit of analysis was used in place of the OPM’s, there were about 7.3 million previously unacknowledged cohabiting-couple families and 3.8 million fewer single-female and single-male families.
Another advantage of the SPM for the purpose of understanding low-income and means-tested benefit receipt by household type is that it uses a more comprehensive measure of income than the OPM—in particular, it counts several important benefits, including the Earned Income Tax Credit and in-kind food and housing assistance, that the OPM does not count.
Shawn Fremstad is a Senior Fellow at the Center for American Progress.