The scenarios examined above assume a uniform swing in voter preference or a uniform change in turnout for demographic groups across states. But that assumption obscures the reality that swings and turnout increases do not occur uniformly across states but rather are organized and fought for by campaigns, which tend to concentrate their efforts in a relatively small set of competitive states. Moreover, even where campaigns concentrate efforts, the results are not likely to be uniformly successful or unsuccessful but rather a mix of outcomes across states reflecting differences in political terrain.
In this section, we map the political terrain across key competitive states; analyze where campaign efforts are likely to concentrate in these states; and assess how successful these efforts would have to be to obtain victory in a given state.
Trump and Democratic states in 2016
In 2016, President Trump carried 30 states—Alabama, Alaska, Arizona, Arkansas, Florida, Georgia, Idaho, Indiana, Iowa, Kansas, Kentucky, Louisiana, Michigan, Mississippi, Missouri, Montana, Nebraska, North Carolina, North Dakota, Ohio, Oklahoma, Pennsylvania, South Carolina, South Dakota, Tennessee, Texas, Utah, West Virginia, Wisconsin, and Wyoming—plus Maine’s second congressional district for a total of 306 electoral votes. Clinton carried the other 20 states—California, Colorado, Connecticut, Delaware, Hawaii, Illinois, Maine, Maryland, Massachusetts, Minnesota, New Hampshire, Nevada, New Jersey, New Mexico, New York, Oregon, Rhode Island, Vermont, Virginia, and Washington—plus the District of Columbia for a total of 232 electoral votes.
Thus, Trump needs to keep his coalition of states together, especially focusing on winning Michigan, Pennsylvania, and Wisconsin, which were his closest states in 2016. And he will try to expand his coalition into several other states as a hedge against his possible loss of these three Rust Belt states. For the Democratic candidate, he or she will attempt to expand the 2016 Democratic coalition by not only trying to take the Rust Belt three but also by contesting a number of other states where Trump has shown some weakness based on his approval ratings and 2018 election results.
The states that may be contested between the two campaigns, with the exception of New Hampshire, come from three broad geographic areas: the Midwest/Rust Belt, the Southwest, and the New South. We discuss competitive states in each of these areas below.
The Midwest/Rust Belt
The Midwest/Rust Belt states that could be in play between the Democratic nominee and Trump are:
- Iowa: Six electoral votes
- Michigan: 16 electoral votes
- Minnesota: 10 electoral votes
- Ohio: 18 electoral votes
- Pennsylvania: 20 electoral votes
- Wisconsin: 10 electoral votes
All together, these six Midwest/Rust Belt target states are worth 80 electoral votes. In 2016, Trump carried 5 of these 6 states, only falling short in Minnesota. He will try to retain these states in 2020—indeed, they are central to his reelection strategy—while also picking off Minnesota. The Democratic campaign will focus on flipping Michigan, Pennsylvania, and Wisconsin—enough, all else remaining the same, to put the Democratic nominee over 270. Some effort will also be made to flip Iowa and Ohio, though these states will be less central to Democratic campaign efforts.
Overall, these states are slow growing and remain heavily white, with particularly large white noncollege-educated populations. However, this demographic is declining quickly in these states, with a notable trend toward increases in the white college-educated population. Still, despite this shifting mix among white voters, the slow rate of racial and ethnic change in these states presents a more favorable dynamic for the GOP than in the two other swing regions.
In the following sections, the authors discuss these states in detail by descending order of electoral votes.
Pennsylvania: 20 electoral votes
In 2016, Trump carried Pennsylvania by a whisker (0.7 percentage points and a mere 44,000 votes).3 Prior to 2016, Democratic presidential candidates had won Pennsylvania for six straight elections from 1992 to 2012.
But in 2018, Democrats did much better. They carried the House popular vote by 10 points4 and flipped three House seats5 from Republican to Democratic. They also gained a net of 16 state legislative seats6, including the elimination of a GOP supermajority in the upper chamber. In addition, Pennsylvania’s Democratic Sen. Bob Casey and Democratic Gov. Tom Wolf had easy, double-digit reelection victories over their Republican opponents.

The Democratic candidate will hope to replicate the trends that yielded such success for the Democrats in 2018, while Trump will try to build on the voting patterns that brought him victory in the state in 2016. However, he is currently not popular in the state, with a negative net approval rating (approval minus disapproval) among registered voters of -10.7
Nonwhites made up 17 percent of Pennsylvania voters in 2016 and heavily supported Clinton: Blacks, 10 percent of voters, by 90-8; Hispanics, 4 percent of voters, by 74-22; and Asians/other races, 3 percent of voters, by 62-31. Clinton also carried white college graduates, 31 percent of voters, by 9 points (52 percent to 43 percent). But the dominant group—white noncollege voters—favored Trump by around 30 points (63 percent to 33 percent), which ultimately made the difference.
In 2020, we expect all nonwhite groups to increase at least slightly as a percentage of eligible voters relative to 2016. Hispanics should increase by about 1 point; Asians/other races by 0.5 points; and Blacks by 0.3 points. White college-educated voters should also increase by around 1 point, while white noncollege voters should drop by more than 2 points. All these changes are favorable for the Democrats. This is, in fact, enough underlying change to tip the state to the Democratic candidate, if all turnout and partisan voting preferences by group remain the same as in 2016.
To carry the state, Trump will therefore need to increase his support among white noncollege voters to greater than his 30-point margin in 2016 and/or increase this group’s relative turnout. Another possibility for Trump is to increase his support among a less-friendly demographic such as white college voters. But he cannot afford to stand pat with the voting patterns from the previous election. The demographic shifts in Pennsylvania, coupled with the narrow margin of victory in 2016, mean that Trump cannot simply replicate his 2016 messages and outreach and expect to win this critical state. He will need to offer Pennsylvania working-class voters a strong economic pitch while simultaneously showing suburban women and college-educated white voters that his policies support their interests.
For the Democratic candidate, one approach would be to simply rely on the demographic changes just outlined and hope voting patterns from 2016 remain the same. If that were the case, the Democrat would carry Pennsylvania by around half a percentage point.
But this strategy would be very risky. Democrats will clearly attempt to change these voting patterns in their favor. One goal might be to increase Black turnout back to its 2012 levels. This would be helpful but would not add much to their performance, since Black turnout declined only marginally in Pennsylvania in 2016 and was actually still slightly above white turnout in that election. Returning the margin among Black voters back to levels attained by President Obama in 2012 would be more helpful but would add only a percentage point to the Democrats’ projected margin. Widening the Democrats’ margin among white college graduates by 10 points would be more effective, adding 3 points to potential Democratic 2020 performance.
But the goal with the most potential impact would be to move some white noncollege voters—particularly white noncollege women, among whom Clinton ran 25 points better8 than among their male counterparts—away from Trump. Shaving 10 margin points off Trump’s advantage among white noncollege voters—thereby bringing the Democratic deficit close to what it was for Obama in the state in 2012—would boost the Democrats’ projected margin by as much as 5 points. Even achieving half that goal would give the Democrats a several-point cushion in the state.
Ohio: 18 electoral votes
In 2016, Trump carried Ohio by a solid 8 points. In the two previous elections, Obama had carried the state.
In 2018, Republicans performed better in Ohio than in several other Rust Belt states. They won the House popular vote by 5 points and held all of their House seats in the state. However, Democrats did gain a net of five state legislative seats and succeeded in reelecting Democratic Sen. Sherrod Brown by 7 points. But Republicans succeeded in their bid to retain the governor’s mansion, despite Democrats’ sense that they had a strong candidate in Democrat and former Director of the Consumer Financial Protection Bureau Richard Cordray.
The Democratic presidential candidate in 2020 clearly has a lot of work to do in Ohio to return the state to its Obama-era patterns, while Trump can simply try to replicate, or at least come close, to the voting patterns that brought him a relatively easy victory in the state in 2016. Trump currently has a net positive approval rating in the state, though just barely, at +1.
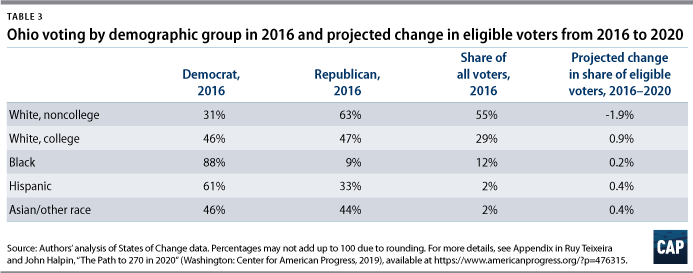
Nonwhites made up 16 percent of Ohio voters in 2016. Most of these were Blacks, at 12 percent, who strongly supported Clinton by 88 percent to 9 percent. The rest were Hispanic (2 percent) and Asian/other races (2 percent) supporting Clinton by 61 percent to 33 percent and 46 percent to 44 percent, respectively. Unlike Pennsylvania, Ohio white college graduates (29 percent of voters) narrowly supported Trump, at 47 percent to 46 percent. But his decisive advantage was among white noncollege voters, who overwhelmingly backed Trump by 32 points, at 63 percent to 31 percent.
However, we expect white noncollege eligible voters in 2020 to decline by 2 points relative to 2016, while white college graduates should increase by a point. All nonwhite groups in the state should increase by small amounts relative to 2016: Blacks by 0.2 points and both Hispanics and Asians/other races by 0.4 points. As in Pennsylvania, these changes are favorable for the Democrats. But given the hill the Democrats need to climb in Ohio, these underlying changes do not go far—just a percentage point—in tipping the state to the Democratic candidate, if all turnout and partisan voting preferences by group remain the same as in 2016.
Therefore, if Trump can maintain or come close to his 2016 support among white noncollege voters in the state, he should be in good shape to carry the state again. Even a shift of 10 margin points against him among white college graduates would still project to a 4-point Trump advantage in 2020.
For the Democratic candidate, even increasing Black turnout and support back to their strong levels in 2012 (they both declined significantly in 2016) would still leave them with a 4-point deficit in the state. The most efficacious change for the Democrats would be to cut Trump’s advantage with white noncollege voters, concentrating on white noncollege women, where Democrats’ deficit in 2016 was 30 points less than among men. Shaving 10 margin points off Trump’s advantage among white noncollege voters would, by itself, bring the Democratic candidate within 2 points in the state. Replicating Obama’s 2012 performance among this demographic in the state would allow them to actually carry the state, all else from 2016 remaining the same.
In all likelihood, a combination of these changes, at different levels, would be necessary for the Democrats to prevail. Trump, in a sense, just needs to maintain the status quo.
Michigan: 16 electoral votes
In 2016, Trump squeaked by in Michigan by a miniscule 0.2 percentage points and 11,000 votes. Prior to 2016, Democratic presidential candidates had won Michigan for six straight elections from 1992 to 2012.

But Democrats had a strong election in 2018. They carried the House popular vote by 8 points and flipped three House seats from Republican to Democratic. They also netted 10 state legislative seats and eliminated the GOP supermajority in the upper chamber. Democratic Sen. Debbie Stabenow was reelected by 7 points, and Gretchen Whitmer recaptured the governorship for the Democrats with an easy 10-point victory, thereby eliminating the GOP’s trifecta in state government.
The Democratic candidate will try to build on the success of 2018, while Trump will attempt to reprise his greatest hits from 2016, despite his current lack of popularity in the state. He is currently running a negative net approval rating of -9.
Nonwhites made up 18 percent of Michigan voters in 2016. Black voters, 13 percent of the voting electorate, supported Clinton by 91 percent to 7 percent; Hispanics, 2 percent of voters, by 61 percent to 33 percent; and Asians/other races, 3 percent of voters, by 50 percent to 42 percent. But here, as in Ohio, Trump narrowly carried white college graduates, 28 percent of voters, by 2 points. More significantly, as in other Midwestern/Rust Belt states, the dominant group in the Michigan electorate (54 percent of voters) were white noncollege voters, who backed Trump by 21 points, 57 percent to 36 percent.
In 2020, all nonwhite groups should increase as a percentage of eligible voters relative to 2016. Hispanics should go up by 0.5 points; Asians/other races by 0.6 points; and Blacks by 0.2 points. White college-educated voters should also increase a bit less than a point, while white noncollege voters, as in most Midwest/Rust Belt states, should decline by more than 2 points. These changes are net favorable for the Democrats and represent enough underlying change to move the state to the Democratic candidate in 2020, if all turnout and partisan voting preferences by group remain the same as in 2016.
To carry the state, Trump will seek to increase his support among white noncollege voters to greater than his 21-point margin in 2016—which was not as strong as his margins among this group in Pennsylvania and Ohio—and/or increase this group’s relative turnout. Another possibility is to increase his support among white college voters, where he managed a very modest positive margin in 2020. But he cannot afford to stand pat with previous voting patterns due to the influence of demographic change.
The Democratic candidate, on the other hand, could bank on the demographic changes outlined above and hope voting patterns from 2016 remain the same. In such a scenario, the Democrat would carry Michigan by 0.6 points.
Democrats, of course, will not pursue such a risky strategy and will attempt to change the 2016 voting patterns in their favor. It would be helpful if Black turnout and support returned to their 2012 levels, thus adding a point and a half to Democrats’ projected margin. Moving white college graduates 10 points in the Democratic direction would add about double that to the projected margin. But moving the Democratic candidate’s margin among white noncollege voters back to its 2012 level would add more than 5 points to the projected 2020 Democratic margin. Noncollege white women will be a target here, since Clinton in 2016 ran 25 points better among this group than among their male counterparts.
Minnesota: 10 electoral votes
Clinton won Minnesota in 2016 by a narrow margin of just less than 2 points. Democrats have now won the state in 11 straight presidential elections. The last time the Democrats lost in a presidential election in Minnesota was in 1972, when former President Richard Nixon wiped out George McGovern.
Democrats also had a strong election in 2018. They carried the House popular vote by 10 points—though the Republicans, on net, held on to all their House seats. Democrats also flipped 18 state legislative seats and captured control of the lower chamber. Democratic Sen. Amy Klobuchar won reelection in a landslide, and, in an unusual second, special Senate election, Democrat Tina Smith won the seat easily by 11 points. In addition, Tim Walz held the governor’s office for the Democrats, also by 10 points.
The Democratic candidate in 2020 will seek to keep the Democratic streak going, while Minnesota, given the closeness of the 2016 result, will be on the short list of states that Trump targets to try to expand his coalition. This may be difficult; he is quite unpopular in the state, with a current negative net approval rating of -15.
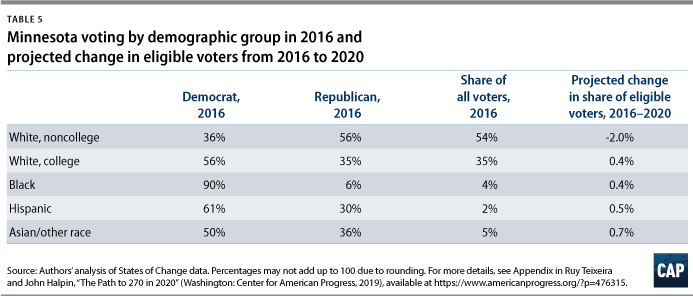
Nonwhites were just 11 percent of Minnesota voters in 2016. Asians/other races were the largest nonwhite group at 4.5 percent, and they supported Clinton by 50 percent to 36 percent. Blacks were 4.3 percent of voters and went heavily for Clinton by 90 percent to 6 percent. Hispanics were just 2 percent of voters and supported Clinton by 61 percent to 30 percent. In addition, white college graduates, an unusually large 35 percent of voters, backed Clinton by 22 points. The bright spot for Trump was white noncollege voters, 54 percent of the voting electorate, who favored him by 21 points.
Blacks, Hispanics, and Asians/other races should all increase as a share of eligible voters in 2020 by 0.4, 0.5, and 0.7 points, respectively. White college-educated voters should also go up by 0.4 points. The declining group will be white noncollege voters, who should decline by just more than 2 points. All these changes are net favorable for the Democrats.
The logical strategic choice for Trump would be to enhance his 21-point margin among white noncollege voters from 2016. A 10-point margin shift in Trump’s direction among this demographic group would result, all else remaining the same, in a 3-point GOP victory. A more difficult target would be to reduce his deficit among white college voters by 10 points; that would result in a narrow 1-point victory for him.
The Democratic candidate could expand Clinton’s margin by a point simply by holding Democratic margins at their 2016 levels, due to underlying demographic changes in the eligible electorate. They will certainly try to expand their already gaudy lead among white college graduates. But the most effective move would be to get their white noncollege margin back to where it was in 2012; that would result in a nearly 10-point Democratic victory, all else remaining the same.
Wisconsin: 10 electoral votes
In 2016, Trump carried Wisconsin by 0.8 percentage points and just 23,000 votes. Prior to 2016, Democratic presidential candidates carried Wisconsin for seven straight elections from 1988 to 2012. But two of those victories were razor-thin, won by less than half a percentage point.

Democrats fared better in 2018. They carried the House popular vote by slightly less than 9 points. However, Republicans held all of their House seats and, on net, kept the same number of state legislative seats. But Democratic Sen. Tammy Baldwin easily won reelection by 11 points, and Tony Evers narrowly defeated incumbent Scott Walker by a point to recover the governor’s mansion for the Democrats and, in the process, break the Republican trifecta hold on state government.
The Democratic candidate will hope to continue the trends that manifested themselves in 2018, while Trump will try to build on his winning coalition from 2016. Trump has a -5 negative net approval rating in the state, which is slightly better than his approval rating in Michigan and Pennsylvania.
Nonwhites made up just 10 percent of Wisconsin voters in 2016, distributed roughly as 4-3-3 between Blacks, Hispanics, and Asians/other races and favoring Clinton by 88, 35, and 17 points, respectively. Clinton also had a strong advantage among white college graduates of 15 points (54 percent to 39 percent), which is better than her performance among this demographic group in either Michigan or Pennsylvania.
But there were also more white noncollege voters, 58 percent, in Wisconsin than in either Michigan or Pennsylvania. These voters favored Trump by 19 points.
In 2020, Blacks’ share of eligible voters should remain about the same, while Hispanics should go up by 0.7 points and Asians/other races by 0.4 points. White college-educated voters should also go up a full point, while white noncollege voters should drop by 2.3 points. These changes, favorable for the Democrats, would be enough to just barely move the state into the Democratic column if turnout and partisan voting preferences by group remained the same as in 2016.
To carry the state again, Trump likely needs to increase his support among white noncollege voters from his 19-point advantage in 2016 and/or increase this group’s relative turnout. Alternatively, he could try to increase his support among the considerably less-friendly white college demographic. But the voting patterns from 2016 will likely not suffice for a Trump victory in 2020.
As noted previously, demographic changes in the underlying eligible electorate would be enough for the Democratic candidate to barely carry the state in 2020, if voting patterns from 2016 remain the same. A safer strategy would be to change some key voting patterns from 2016 in Democrats’ favor. One obvious goal would be to increase Black turnout—which declined a massive 19 points in 2016—back to its 2012 levels. Doing so would add about a point and half to the Democratic margin in 2020.
Widening the Democrats’ already-healthy margin among white college graduates by 10 points would be more effective, adding 3 points to potential Democratic 2020 performance. But moving the Democrats’ white noncollege deficit back to 2012 levels would add 7 points to Democrats’ projected 2020 margin. White noncollege women are the clear target group here, since Clinton’s deficit among these voters (-16 points) was much less than her deficit among their male counterparts (-43 points).
As in other Midwest battleground states, Trump must sharpen his economic pitch to Wisconsin’s working-class white voters and show college-educated whites that his tax and spending priorities work in their favor. Wisconsin is arguably the most critical state for the president’s reelection campaign, and he is currently underperforming in the public’s mind in relation to his 2016 effort.
Iowa: 6 electoral votes
Trump won Iowa by more than 9 points in 2016, quite a change from Obama’s 6-point victory in the state in 2012. At that point, Democrats had won the state in 6 of the 7 previous presidential elections, though one of these was won by less than 1 percentage point.
But 2018 was a surprising comeback election for the Democrats. They won the House popular vote by a stunning 10 points and flipped two GOP-held House seats in the state. The Democrats also gained a net of five state legislative seats. However, Republican Kim Reynolds beat Democrat Fred Hubbell for the governorship by 3 points.
The Democratic candidate in 2020 has a lot of ground to make up relative to 2016, but the 2018 results provide some reason to think that it may be possible. For Trump, he needs to simply approximate the voting patterns that brought him his solid 2016 victory. But one challenge for him is his current negative net approval in the state of -3 points.
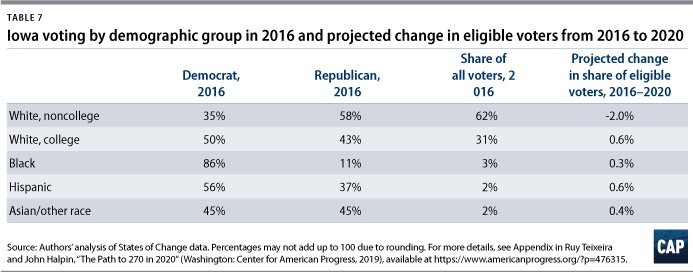
Iowa is an exceptionally white state; nonwhites made up just 7 percent of voters in the state in 2016. These voters were divided up roughly 3-2-2 between Blacks, Hispanics, and Asians/other races. Blacks and Hispanics supported Clinton by 76 points and 20 points, respectively. Asians/other races, however, were essentially tied between Trump and Clinton. Iowa’s white college graduates (31 percent of voters) gave Clinton a solid lead of 7 points, 50 percent to 43 percent. But among the enormous white noncollege group, 62 percent of voters, Trump ran up a 23-point lead, 58 percent to 35 percent. That was clearly the big story in the state.
White noncollege eligible voters in 2020 should decline by 2 points relative to 2016, while white college graduates should increase by a little more than half a point. All nonwhite groups in the state should increase by small amounts relative to 2016: Blacks by 0.3 points; Hispanics by 0.6 points; and Asians/other races by 0.4 points. While these changes are all favorable for the Democrats, they will do relatively little to whittle their considerable 2016 deficit—a mere 0.6 points—if voting patterns by group in 2020 remain the same as in 2016.
Thus, if Trump can maintain or come close to his support among white noncollege voters in Iowa, he should carry the state easily again. A shift of 10 margin points against Trump among white college graduates, swelling the Democrats’ already solid advantage among that group, would still leave Trump about 6 points ahead in 2020.
For the Democratic candidate, his or her fortunes are clearly dependent on moving the very large white noncollege group in their direction. Indeed, if the Democrats could replicate Obama’s 2012 white noncollege margin in the state, they would actually carry the state by slightly less than 5 points, all else remaining equal. Even getting part of the way there could make the state competitive in 2020. That’s a tough challenge, but certainly the 2018 results in the state suggest this is possible.
Midwest/Rust Belt summary
The six Midwest/Rust Belt swing states are all marked by slow population growth and a relatively small and slowly increasing percentage of nonwhite voters, ranging from a low of 7 percent in Iowa in 2016 to a high of 18 percent in Michigan. But the Democrats’ relatively small base of nonwhite voters is supplemented by fairly strong support among these states’ growing white college-graduate populations. Trump’s job approval ratings continue to lag in these critical states, presenting openings for the eventual Democratic nominee to build on these trends.
Our estimates indicate in 2020, compared with 2016, these states should generally see a 2-point increase in the percent of white college graduates and minorities among eligible voters as well as a 2-point decline in the percent of white noncollege eligible voters. These are all changes that favor the Democratic candidate—and in the key states of Michigan, Pennsylvania, and Wisconsin, they would be enough by themselves to tip the states to the Democrats if voting patterns from 2016 remain the same. But in Iowa and Ohio, Trump won by too wide a margin in 2016 for underlying demographic change to make a significant difference for Democrats in 2020.
Democrats will need to supplement their underlying advantage from demographic shifts—even in the very close states of Michigan, Pennsylvania, and Wisconsin—since voting patterns inevitably change across elections. One target will be Black turnout and support, which was below 2012 levels in 2016 and, in the case of Wisconsin, far below. Moving Black turnout and support back toward 2012 levels would contribute varying but modest amounts to the Democratic margin in these states in 2020. More impact could be attained from a significant move of white college voters toward the Democratic candidate, relative to 2016. But the most impact for the Democrats would come from a move of the very large white noncollege group—probably led by white noncollege women—back toward their Democratic support levels of 2012. That would result in easy Democratic victories in the Rust Belt three of Michigan, Pennsylvania, and Wisconsin and would even make Iowa and Ohio competitive.
Trump cannot afford to stand pat, given the nature of underlying demographic change in these states’ electorates. In Michigan, Pennsylvania, and Wisconsin—whose retention in the GOP column is central to his reelection chances—the strategy will presumably be to further the trend that benefited him so much in 2016: The surge of white noncollege voters toward the Republicans. If he is able to attain a significant movement of these voters, widening his large lead among this demographic group, he might win solid victories in all six states discussed here, including Minnesota. Any possible movement toward him among nonwhite voters, or lower Democratic base turnout, would augment these efforts and would get him far toward his reelection goal.
The Southwest
The Southwest includes five states that could be in play between the Democratic nominee and Trump:
- Texas: 38 electoral votes
- Arizona: 11 electoral votes
- Colorado: nine electoral votes
- Nevada: six electoral votes
- New Mexico: five electoral votes
Together, these five Southwestern target states have 69 electoral votes. In 2016, Trump carried Texas and Arizona, and Clinton took Colorado, Nevada, and New Mexico. While Texas is still likely in the Republican camp for this cycle, despite recent positive trends, Arizona is a stronger—and important—possibility for Democrats. Arizona could put the Democrats over 270 if their candidate took Michigan and Pennsylvania but failed to take Wisconsin.
The GOP strategy will focus on safeguarding Arizona and Texas and trying to pick off one or two other Southwestern swing states as insurance against Rust Belt losses. The Trump campaign has publicly mentioned New Mexico and Nevada as targets.
These Southwestern states are all fast growing relative to the national average. They also have relatively large nonwhite populations, especially compared with the Midwest/Rust Belt states. Overall, these Southwestern states present a demographic profile and growth dynamic that is more favorable for the Democratic nominee than the Midwest/Rust Belt swing region, where the heavily white populations and slow pace of demographic change are relatively advantageous for the GOP. Below, we provide a detailed discussion of these states in descending order of electoral votes.
Texas: 38 electoral votes
Trump won Texas by 9 points in 2016, a significant drop from Romney’s 16-point victory four years earlier. Despite this enticing improvement for the Democrats, it should be emphasized that Republicans have carried the state since 1976.
Democrats also had some successes in Texas in 2018. They lost the House popular vote by less than 4 points—a big advance for them in the state—and flipped two GOP-held House seats. Moreover, since that election, no fewer than six GOP House incumbents have announced their retirements, creating further possibilities for the Democrats. The Democrats also flipped 14 state legislative seats from the GOP and broke their supermajority in the upper chamber. Finally, while Republicans won handily by a double-digit margin in the governor’s race, Democrats made the race against incumbent GOP Sen. Ted Cruz far closer than almost anyone thought possible; Democrat Beto O’Rourke wound up losing by less than 3 points.
The Democratic candidate in 2020 will seek to build on these trends. But of course, Democrats would need quite a swing relative to 2016 to succeed in flipping the state. Trump only needs to come close to the voting patterns he benefited from in 2016 to once again carry the state. Currently, he has only a modest +3 net approval rating in the state, so that is not something he can take for granted.
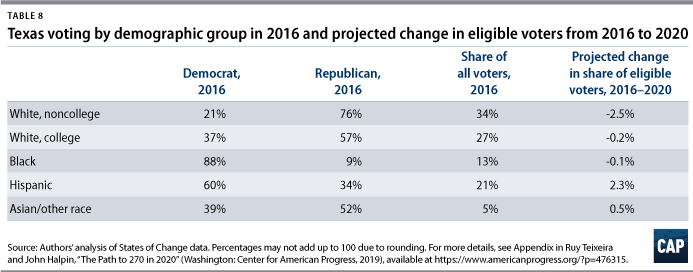
Texas has a huge nonwhite population, though it is somewhat less represented among actual voters. In 2016, nonwhites made up 39 percent of voters in the state in 2016—13 percent Black; 21 percent Hispanic; and 5 percent Asian/other races. Blacks and Hispanics supported Clinton by 78 points and 26 points, respectively. Asians/other races, however, supported Trump by 13 points. Texas white college graduates (27 percent of voters) also supported Trump by 20 points, 57 percent to 37 percent, while the largest group—white noncollege voters (34 percent)—backed him by a whopping 55 points, 76 percent to 21 percent.
Our estimates indicate that white noncollege eligible voters in 2020 should decline by 2.5 points relative to 2016, while white college graduates should also decline, though only very slightly. Black eligible voters should remain roughly stable, while Hispanics should increase by more than 2 points as a share of eligible voters, and Asians/other race will go up by half a point. On net, these changes favor the Democrats and will put a modest dent—1.6 points—in the GOP advantage in the state if voting patterns by group do not change in 2020.
As Trump’s massive lead among white noncollege voters suggests, if he can maintain or come close to his support among this group in 2020, he will most likely win Texas. Even a shift of 10 margin points against Trump among white college graduates, continuing a recent pro-Democratic trend, would still leave him with a 5-point lead in the state.
For the Democratic candidate, a winning coalition would have to include not only this big white college swing but also a large (15 margin points or so) pro-Democratic swing among Hispanics, Asians, and voters of other races, combined with increased nonwhite turnout overall. But even with these favorable changes, the Democratic candidate probably needs to reduce at least slightly the massive deficit among the white noncollege group. All in all, one would still have to favor Trump to take the state, but certainly the trends from 2018 onward suggest that Democrats may be able to take advantage of some of these pro-Democratic changes and that the state could be quite competitive in 2020.
Arizona: 11 electoral votes
Trump won Arizona by just 3.5 points in 2016, a substantial drop from Romney’s 9-point margin in 2012. Republicans have carried the state since 1996, but the 2016 result has given Democrats hope they can carry the state in 2020 for the first time in decades.
Democrats reduced this deficit further in Arizona in 2018. They won the House popular vote by just less than 2 points and flipped a GOP House seat. The Democrats also flipped four state legislative seats from the GOP. Finally, and most importantly, they flipped one of Arizona’s GOP-held Senate seats, as Democrat Kyrsten Sinema defeated Republican Martha McSally by 2 points. In the governor’s race, however, the Republican candidate soundly beat the Democrat by double digits.
The Democratic candidate in 2020 will have a lot of upward trends to build on to turn 2016’s close loss into a close victory in 2020. As for Trump, he will need to hold the line from 2016 and make voting patterns in 2020 as much like the previous election’s as possible. Adding to that challenge, he currently has a negative net approval rating in the state of -5.
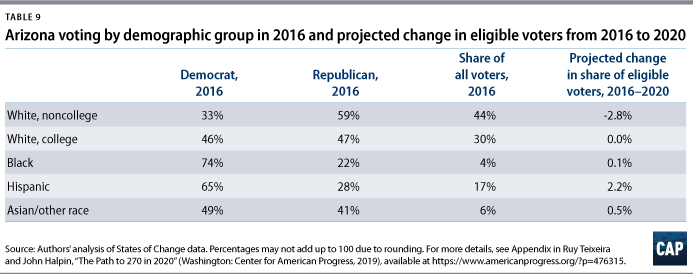
Arizona has a substantial nonwhite population, though, as with Texas, it is somewhat less represented among actual voters. In 2016, nonwhites made up 27 percent of voters in the state in 2016—17 percent Hispanic; 6 percent Asian/other races (a group that includes Native Americans); and just 4 percent Black. Hispanics supported Clinton by 36 points; Blacks by 52 points; and Asians/other races by 8 points. Arizona’s white college graduates (30 percent of voters) supported Trump only narrowly, by 47 percent to 46 percent, while noncollege whites, 44 percent of voters, backed him by 26 points, 59 percent to 33 percent.
We expect white noncollege eligible voters in 2020 to decline by almost 3 points relative to 2016, while white college-graduate eligible voters should remain stable. Black eligible voters should also remain roughly stable, while Hispanic voters should increase by more than 2 points and Asians/other races by half a point. These changes in the underlying demographic structure of the electorate are enough to knock a point off Trump’s advantage in 2020, even if voting patterns from 2016 remain in force.
Given the narrowness of Trump’s victory in 2016 and the projected deterioration in his margin from demographic change, Trump needs, at minimum, to hold his 2016 levels of support from various demographic groups. His most effective safeguard against losing the state would be to increase his support among his friendliest group, white noncollege voters. A 10-point margin shift in his favor among these voters would take his projected advantage in the state up to 7 points, all other voting patterns remaining the same.
For the Democratic candidate, a winning coalition could be assembled in several different ways. A 10-point pro-Democratic margin shift among white college graduates (going from -1 points to +9 points) would be enough to generate a half-point victory in the state. A 15-point pro-Democratic swing among Hispanics, Asians, and voters of other races, would be even more effective, taking the victory margin over a point. And a 10-point pro-Democratic margin shift among white noncollege voters would take the Democratic candidate’s advantage to just less than 2 points. Given that a number of trends seen in 2018 were consistent with these possible changes and that Trump’s margin in 2016 was already so thin, Trump may have difficulty holding the state in 2020.
Colorado: 9 electoral votes
Clinton won Colorado by 5 points in 2016. This was essentially the same margin with which Obama carried the state in 2012.
Democrats also had several successes in the 2018 election in Colorado. They carried the House popular vote by a strong 11 points and flipped a GOP-held House seat. They also flipped eight state legislative seats and took control of the upper chamber, thereby giving them a trifecta of control in the state. In addition, Jared Polis held the governorship for the Democrats with an easy 11-point victory.
The Democratic candidate in 2020 obviously has a lot of upward trends to build on in the state. Trump’s path looks distinctly more difficult, especially considering his current negative net approval rating of -16.
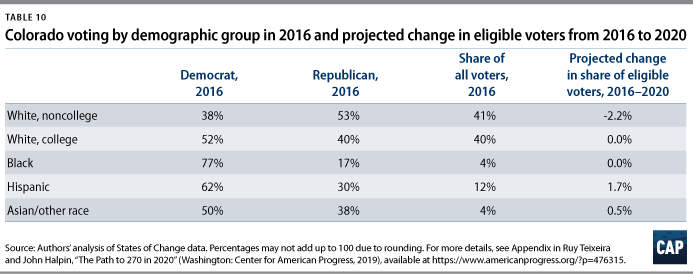
Nonwhites made up 19 percent of Colorado voters in 2016, most of whom were Hispanic, at 12 percent, with Blacks and Asians/other races at 4 percent each. Blacks supported Clinton by 60 points; Hispanics by 32 points; and Asians/other races by 13 points. In addition, white college graduates, an imposing 40 percent of voters, backed Clinton by 52 percent to 40 percent. The relative bright spot for Trump was white noncollege voters—41 percent of the voting electorate—who favored him by 15 points.
Blacks and white college voters should remain stable as a share of eligible voters in 2020, while Hispanics will increase by 1.7 points and Asians/other races by half a point. The sole declining group will be white noncollege voters, who are projected to decline by slightly more than 2 points. All these changes favor the Democrats.
The logical strategic choice for Trump would be to pump up his 15-point margin among white noncollege voters from 2016. However, even a 10-point margin shift in Trump’s direction among this demographic would leave him a point and a half behind in the state, all else remaining the same. To succeed, he would probably need to also reduce his deficit among white college voters significantly, which is a much more difficult target.
The Democratic candidate could expand Clinton’s margin by half a point by holding Democratic margins at their 2016 levels, due to underlying demographic changes in the eligible electorate. If they expanded their already strong lead among white college graduates by 10 margin points, that would add 4 points to their advantage. Furthering their lead by 15 points among Hispanics, Asians, and voters of other races would increase their lead by around 2.5 points.
Nevada: 6 electoral votes
Clinton won Nevada by about 2.5 points in 2016, down from a Democratic margin of 7 points in 2012 and more than 12 points in 2008. This trend line has earned Nevada a place on the Trump campaign’s short target list of states that Clinton carried in 2016.

But the other side of the coin here is how well the Democrats did in 2018. They won the House popular vote by 6 points and flipped two House seats. They also flipped four state legislative seats, including attaining a supermajority in the upper chamber. Most importantly, Democrat Steve Sisolak took the governorship for the Democrats by 4 points, giving them a trifecta in state government. To top it off, Democrat Jacky Rosen defeated Republican Senatorial incumbent Dean Heller by 5 points, giving Democrats control of both of Nevada’s Senate seats.
The basis would certainly appear to be there for the Democratic candidate in 2020 to defend the state against the Trump campaign. The closeness of the 2016 race will give his campaign hope, but Trump’s extremely challenging -21 negative net job approval rating in the state underscores the difficulty of his quest.
Nonwhites made up a large 35 percent of Nevada voters in 2016, dominated by Hispanics at 16 percent, but also including Blacks at 9 percent and Asians/other races at 10 percent. Clinton’s margins among these groups were, respectively, 29 points, 56 points, and 2 points. White college graduates, 22 percent of voters, also went for Clinton, though just barely, by a point, 47 percent to 46 percent. But the dominant group, white noncollege voters, 43 percent of the total electorate, gave Trump an 18-point lead (56 percent to 38 percent), thereby bringing him close in the state.
Looking forward to 2020, we project an unusually large decline in white noncollege eligible voters of more than 3 points. White college-educated eligible voters should also decline, though only modestly, by 0.3 points. Black eligible voters should remain roughly stable while Hispanics should increase more than 2 points and Asians/other races by around a point. As is typical, these changes in the underlying structure of the eligible electorate should favor the Democrats
Trump’s target in the state for 2020 is clear: enhance his 18-point margin among white noncollege voters from 2016. Increasing this margin by 10 points would give him a narrow victory in the state of less than a point, all else remaining equal. A similar result would obtain if Trump manages the more difficult task of increasing his performance among Hispanics, Asians, and voters of other races by 15 margin points.
The Democratic candidate could expand Clinton’s margin in the state by a point by holding Democratic margins at their 2016 levels, due to underlying demographic changes. Expanding their modest lead among white college graduates by 10 margin points would add 2 points to their advantage, but increasing their 2016 lead by 15 points among Hispanics, Asians, and voters of other races would boost their projected margin by more than 4 points.
New Mexico: 5 electoral votes
Clinton won the state by more than 8 points in 2016, though this margin is down from Democratic margins of 10 points and 15 points, respectively, in 2012 and 2008. Perhaps this trend line is why the Trump campaign says it will attempt to flip the state in 2020.9
The 2018 election does not provide much basis for this GOP aspiration. The Democrats overwhelmingly won the House popular vote by 21 points and flipped the GOP’s one House seat in the state. The Democrats also flipped a net of eight state legislative seats and, most importantly, Democrat Michelle Lujan Grisham won the governorship by more than 14 points, flipping that office and thereby giving Democrats trifecta control of state government.
These results do not inspire confidence in the plausibility of Trump flipping the state in 2020. Nor does Trump’s -10 negative net job approval rating in the state, though at least it is better than his Nevada rating.
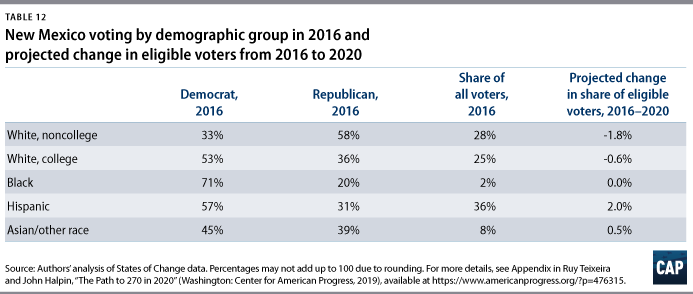
Nonwhites made up a whopping 47 percent of New Mexico voters in 2016, the highest in the country, outside of Hawaii. These nonwhite voters were dominated by Hispanics at 36 percent of all voters, followed by Asians/other races (a group that includes Native Americans) at 8 percent, and Blacks at 2 percent. Clinton carried all these groups by, respectively, 26 points, 7 points, and 51 points. White college graduates, 25 percent of voters, also went strongly for Clinton by 17 points, 53 percent to 36 percent. On the other hand, white noncollege voters—28 percent of the total—backed Trump by 25 points, 58 percent to 33 percent.
In 2020, we project that white noncollege eligible voters should decline by around 2 points relative to 2016, and white college eligible voters should decline by 0.6 points. Black eligible voters should be stable, but Hispanics should increase by around 2 points and Asians/other race by half a point. These changes favor the Democrats.
Trump’s target in the state for 2020 would presumably be to significantly increase his 25-point margin among white noncollege voters from 2016. But even increasing this margin by 10 points would leave him 6 points behind in the state, all else remaining equal. A more effective but more difficult option would be improving his performance among Hispanics, Asians, and voters of other races by 15 margin points, which would narrow his projected deficit to 2 points. Thus, some combination of large shifts among key groups of New Mexicans is probably necessary for him to make the state competitive.
The Democratic candidate in 2020 could expand Clinton’s 2016 margin in the state by around a point by holding 2016 voting patterns constant, given underlying demographic changes in the structure of the eligible electorate. If he or she expanded Clinton’s 2016 lead by 15 points among Hispanics, Asians, and voters of other races plus boosted turnout of these groups, the projected 2020 Democratic margin would balloon into the mid-to-high teens.
Southwest summary
The five Southwest swing states are all marked by fast growth and relatively large populations of nonwhite voters, ranging from a low of 19 percent in Colorado to a high of 47 percent in New Mexico. However, nonwhite voters in these states are dominated by Hispanics, who do not vote as heavily Democratic as Black voters. The Democrats’ base of nonwhite voters in these states is supplemented by an advantage among white college-graduate populations, with the exception of Texas (though the Republicans’ advantage in Texas has been declining over time). Trump’s strongest group here, as in the rest of the country, are white noncollege voters.
In 2020, our estimates indicate that these states should see 2- to 3-point increases in the percent of nonwhite eligible voters relative to 2016, roughly balanced by 2- to 3-point declines in the percent of white noncollege eligible voters. These are all changes that favor the Democratic candidate and should help him or her keep the Democratic advantages in Colorado, Nevada, and New Mexico as well as narrow the 2016 deficit in Arizona. However, the Republicans’ advantage is too large in Texas for these changes to make a significant difference in the projected outcome for Democrats.
Democrats will seek to build on their advantage from ongoing demographic shifts by enhancing their margins among white college graduates and Hispanics and increasing the turnout levels of the latter. These improvements are most necessary for them to capture Arizona and to even make Texas competitive. And in Texas, the Democrats’ white noncollege deficit is so large that some diminution of Trump’s advantage among these voters is also probably necessary.
For Trump, he has a tall order in Colorado, Nevada, and New Mexico given Democrats’ previous advantages in these states and recent trends. There are paths for him in these states, but they are difficult. And in Arizona—key to Democrats’ electoral vote plans—he needs to safeguard his 2016 victory by enhancing his existing strong support among white noncollege voters. As for Texas, without which his electoral plans would fall apart, he needs to stem possible large-scale deterioration of support among white college graduates and Hispanics. If he can do that and keep white noncollege voters’ support, he should be fairly safe in the state.
The New South
The New South includes four states that are likely to be in play between Trump and the Democratic nominee:
- Florida: 29 electoral votes
- Georgia: 16 electoral votes
- North Carolina: 15 electoral votes
- Virginia: 13 electoral votes
Together, these four New South states have 73 electoral votes. In 2016, Trump carried all of them except Virginia. Of the three states that Trump carried, Florida is the real prize for the Democrats and would likely allow for a Democratic electoral victory. Georgia and North Carolina also represent real risks for Trump, though they were not as close as Florida in 2016. Virginia is a must-hold for the Democrats, and based on recent trends, it looks like a heavy lift for Trump.
These New South states are all fast-growing relative to the national average. They also have relatively large and growing nonwhite populations and, importantly, have large Black populations, who vote especially heavily for the Democrats. Overall, these New South states present a demographic profile and growth dynamic that is more favorable for the Democratic nominee than in the Midwest/Rust Belt swing region. That said, Trump enjoys an advantage from exceptionally conservative white populations in these states, which hobble Democrats’ efforts. We now provide a detailed discussion of these states in descending order of electoral votes.
Florida: 29 electoral votes
Trump won Florida by a single percentage point in 2016, following on Obama’s 1-point and 3-point victories in 2012 and 2008, respectively. However, Republicans won by 5 points in 2004 and by a bitterly disputed 0.01 points in 2000, which swung the election to former President George W. Bush. To say Florida is a vigorously contested state is an understatement.

In a year with several Democratic successes, the party had a relatively poor showing in Florida in 2018. Republicans won the House popular vote by more than 5 points, though Democrats did flip two GOP-held House seats. The Democrats also flipped a net of six state legislative seats from the GOP. But Republicans triumphed in the governor’s race as Democrat Andrew Gillum lost to Republican Ron DeSantis by 0.4 points. And Republican Rick Scott defeated incumbent Democratic Sen. Ben Nelson by an even smaller 0.12 points.
The closeness of the 2016 election, as well as the two statewide contests in 2018, certainly give the Democrats reasons to think they can push the needle back over to their side in 2020. But the GOP’s winning streak in the state gives the Trump campaign confidence they can hold off the charge. Adding to this confidence, Trump is currently running a negative net approval rating in the state of just -1, relatively good for Trump’s standing in 2020 swing states.
Florida has a substantial nonwhite population that made up 33 percent of voters in 2016. These voters were 17 percent Hispanic; 13 percent Black; and 3 percent Asian/other races and supported Clinton by, respectively, 78 points, 20 points, and 6 points. Florida’s white college graduates, 24 percent of voters, supported Trump by 7 points—52 percent to 45 percent—which was considerably less than Trump’s support among white noncollege voters, 43 percent of the total, who backed him by 30 points, at 63 percent to 33 percent.
We expect white noncollege eligible voters in 2020 to decline by more than 2 points relative to 2016, while white college-graduate and Black eligible voters should remain roughly stable. Hispanics should increase by 1.3 points, and Asians/other races should increase by 0.4 points. These changes in the underlying demographic structure of the electorate are enough for the Democratic candidate to knock half a point off Trump’s lead in 2020—making a very close state closer—even if voting patterns from 2016 remain in force.
Given the extreme narrowness of Trump’s victory in 2016, and the projected deterioration in his margin from demographic change, Trump needs at minimum to hold his 2016 levels of support from various demographic groups. But that’s probably not an adequate safeguard, even if attained, given possible changes in turnout patterns. The logical place for him to concentrate would be on white noncollege voters, his friendliest group. A 10-point margin shift in his favor among these voters would move his projected advantage in the state up to almost 5 points, all other voting patterns remaining the same. Another possibility is moving Hispanics—a group that includes the relatively conservative Cuban American population—as well as Asians and those of other races in his direction; a 15-point margin shift among these groups would boost his projected advantage to around 4 points.
For the Democratic candidate, a winning coalition could be assembled in several different ways. One possibility would be to move Black turnout and support back to 2012 levels, which projects to a 1-point Democratic victory, all else remaining equal. Even more effective would be a 10-point pro-Democratic margin shift among white college graduates (going from -7 to +3) that would yield a 2-point victory in the state. A 15-point pro-Democratic swing among Hispanics, Asians, and voters of other races, would also work, taking the Democrats’ projected victory margin to around 3 points. Trump will have to guard against a number of potential avenues available to the Democrats for taking back Florida, as we would expect given the closeness of the 2016 race.
Georgia: 16 electoral votes
Trump won Georgia by 5 points in 2016. This was a decline from Romney’s 8-point victory in 2012, making the trend in the state similar to that in Arizona and Texas. Democrats hope to build on this trend and make the state even closer in 2020.

Republicans managed to hold off several attempted incursions by Democrats in 2018. Republicans won the House popular vote by slightly less than 5 points, but the Democrats did flip one GOP-held House seat. The Democrats also flipped a net of 13 state legislative seats from the GOP. But Republicans won the marquee governor’s race in the state, as Republican Brian Kemp defeated Democrat Stacey Abrams by a close 1.4 points. This was the best performance by a Democrat in a Georgia governor’s race in this century, however.
These trends make the Democrats hopeful they can take the state in 2020. But the fact that the state has come no closer than 5 points in the past three elections makes the Trump campaign believe they can hold the line. Adding to this confidence, Trump is currently running a negative net approval rating in the state of -2—not great, but still better than his ratings in many other 2020 swing states.
Georgia’s large nonwhite population—38 percent of the state’s voters in 2016—is dominated by Blacks. Blacks comprised 31 percent of the voting electorate, compared with 3 percent for Hispanics and just less than 4 percent for Asians and other races. These groups supported Clinton by 76 points, 17 points, and 6 points, respectively. Meanwhile, Georgia’s white college graduates, 25 percent of voters, strongly supported Trump by 24 points, at 59 percent to 35 percent. But white noncollege voters were even stronger in their support, giving him a lopsided 63-point margin of 80 percent to 17 percent.
Our estimates indicate that white noncollege eligible voters in 2020 should decline by almost 2 points relative to 2016, while white college graduates should remain roughly stable. Both Black and Hispanic eligible voters should increase by almost a point, while Asians and other races should increase by half a point. These underlying demographic changes are enough to knock almost 2 points off the Democratic candidate’s projected disadvantage in 2020, all 2016 voting patterns remaining the same.
Given the relative closeness of Trump’s victory in 2016 plus the Democrats’ projected bonus from demographic change, Trump will seek to go beyond holding his 2016 levels of support from various demographic groups. Perhaps it’s too much to ask to increase his margin among white noncollege voters over his already mammoth 63-point advantage. But white college voters were also strong for him—and increasing his margin among them by 10 points would project to a 6-point victory in 2020.
For the Democratic candidate, the Black vote in Georgia will loom large. If the Democratic candidate could return Black turnout to 2012 levels, it would move the race to within 1.5 points of victory, all else equal. And if both Black turnout and support matched 2012 levels, it would actually produce a narrow Democratic victory. A 10-point pro-Democratic margin shift among white college graduates would be similar in effect to the increased Black turnout scenario—narrowing the gap but not quite producing victory—while shaving Trump’s immense white noncollege margin by 10 points would, in and of itself, project to a very close Democratic victory.
North Carolina: 15 electoral votes
Trump won North Carolina by just less than 4 points in 2016. This follows Romney’s narrow 2-point win over Obama in 2012 and Obama’s even narrower victory by one-third of a percentage point in 2008. All these performances were dramatically better for the Democrats compared with losing the state by 12 points in 2004 and 13 points in 2000.
Republicans continued to dominate the state in 2018, though Democrats made some progress. Republicans did relatively less well in the House popular vote, narrowly winning it by less than 2 points, but they succeeded in holding on to all GOP-held House seats. But Democrats flipped a net of 16 state legislative seats and broke Republican supermajorities in both chambers. This is of considerable significance because North Carolina’s governor is currently a Democrat.
These trends give the Democrats hope they can take the state in 2020. The Trump campaign, on the other hand, is well prepared to defend North Carolina’s 15 electoral voters—essential for their coalition—even though Trump’s current net job approval rating in the state of -3 is edging into danger territory.
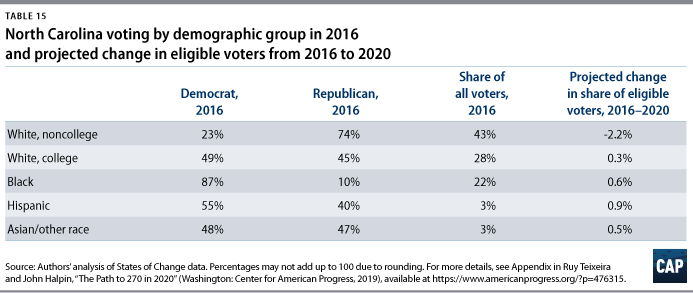
North Carolina’s large nonwhite population accounted for 28 percent of voters in 2016. As in Georgia, Blacks in North Carolina dominate the nonwhite vote, representing 22 percent of all voters, compared with 3 percent for Hispanics and 3.5 percent for Asians and other races. Blacks supported Clinton by 76 points; Hispanics by 15 points; and Asians/other races by 2 points. White college graduates in North Carolina, who represented 28 percent of voters, supported Clinton—but it was close, giving her a 4-point advantage (49 percent to 45 percent). On the other hand, white noncollege voters—43 percent of the voting electorate—gave Trump a whopping advantage of 51 points (74 percent to 23 percent).
We expect white noncollege eligible voters in 2020 to decline more than 2 points relative to 2016, while white college graduates should go up very slightly. Hispanics should increase by a point; Black eligible voters by half a point; and Asians/other races also by half a point. If 2016 voting patterns remain the same, these underlying demographic changes in the eligible electorate would be enough to reduce the Democratic candidate’s projected 2020 deficit in the state by almost 2 points.
As with Georgia, given the relative closeness of Trump’s victory in 2016 plus the projected effect of demographic change, Trump probably needs to go beyond holding his 2016 levels of group support. Increasing his margin among white college-educated voters by 10 points would yield a 5-point victory in 2020, all else equal, while increasing his already-huge lead among white noncollege voters by the same amount would project to a 6-point margin.
For the Democratic candidate, the Black vote, as in Georgia, will have great importance. If Black turnout in 2020 matches 2012 levels (there was a large decline in 2016) that would actually project to a Democratic victory of just less than a percentage point, all else equal. Matching Black support to 2012 levels would further boost the Democrats’ margin. A 10-point pro-Democratic margin shift among North Carolina’s liberalizing white college-graduate population—going from +4 to +14—would project to a narrow victory of the same magnitude as the increased Black turnout scenario. Decreasing Trump’s very large margin among white noncollege voters by 10 points would project to a larger victory.
Virginia: 13 electoral votes
Clinton won Virginia by 5 points in 2016, following on Obama’s 4- and 6-point victories in 2012 and 2008, respectively. These victories represent an impressive breakthrough for the Democrats: Prior to this streak, Republicans had carried the state in every presidential election since 1964.
Republicans did not have much to celebrate in 2018. They lost the House popular vote by an extraordinary 14 points and lost no fewer than three GOP-held House seats. Incumbent Democratic Sen. Tim Kaine also won an easy reelection victory by 26 points. Democrats’ 2018 performance came on top of their 2017 off-year state legislative wins, flipping 15 seats in the lower chamber as well as electing Democrat Ralph Northam governor by 9 points.
The Democratic candidate in 2020 looks strong given these positive trends. Trump’s path looks difficult, especially considering his current negative net job approval rating in the state of -12.
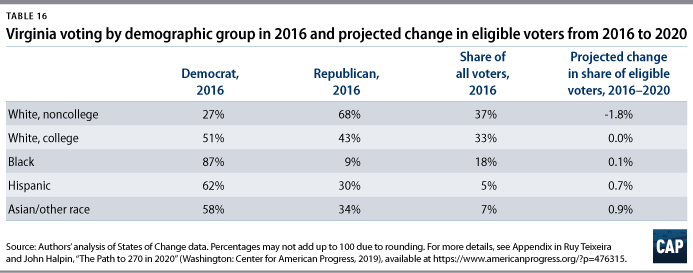
Nonwhites comprised 30 percent of Virginia voters in 2016, most of which were Black, at 19 percent, with Hispanics at 5 percent and Asians and other races at 7 percent. Blacks supported Clinton by 78 points; Hispanics by 32 points; and Asians and other races by 24 points. In addition, white college graduates, one-third of voters, backed Clinton by 8 points (51 percent to 43 percent). The bright spot for Trump was white noncollege voters, 37 percent of the voting electorate, who favored him by 41 points (68 percent to 27 percent).
Our estimates indicate that Blacks and white college eligible voters should remain stable as a share of all eligible voters in 2020, while Hispanics and Asians and other races should each increase by about a point. The sole declining group will be white noncollege voters, who are projected to decline by around 2 points. All these changes favor the Democrats.
The logical strategic choice for Trump would be to pump up his margin among the group that is far and away the most favorable to him in the state: white noncollege voters. However, even a 10-point margin shift in Trump’s direction among this demographic would still leave him 3 points behind in the state, all else remaining the same. To succeed, he would probably need to also reduce his deficit among white college voters significantly, which is a much more challenging target.
The Democratic candidate could expand Clinton’s 2016 margin by a point simply by holding Democratic margins at their 2016 levels, due to underlying demographic changes in the eligible electorate. Increasing Black turnout to 2012 levels would add a point to the Democratic candidate’s margin; furthering their lead by 15 points among Hispanics, Asians, and voters of other races would increase their lead by around two points; and expanding their already strong lead among white college graduates by 10 margin points would add 3 points to their projected advantage.
New South summary
The four New South swing states are all marked by fast growth and relatively large percentages of nonwhite voters, ranging from a low of 28 percent in North Carolina in 2016 to a high of 38 percent in Georgia. Moreover, with the important exception of Florida, nonwhite voting populations in these states are mostly Black—the most heavily Democratic-voting constituency in the country. However, in the key states of Florida and Georgia, white college-graduate voters backed Trump in 2016, making these states different from most other swing states. And white noncollege voters were very strong indeed for Trump in all these states, further hampering Democratic efforts.
Our estimates indicate that in 2020, white noncollege eligible voters in these states should decline by around 2 points relative to 2016 balanced by commensurate increases in nonwhite eligible voters. In North Carolina and especially Georgia, increases in Black eligible voters will be significant, but increases in Hispanics as well as Asians and other races dominate overall. These changes favor the Democratic candidate and should help bring him or her closer to Trump in Florida, Georgia, and North Carolina.
Democrats will seek to build on their advantage from ongoing demographic shifts by increasing Black turnout and enhancing their margins among white college graduates, Hispanics, and Asians/other races. Such improvements could plausibly bring them victory in North Carolina, Georgia, or even Florida, given the extreme closeness of the state.
Trump faces a difficult challenge in Virginia, and it is not clear how strongly his campaign will contest the state. His main task is clearly to safeguard his 2016 victories in North Carolina, Georgia, and particularly Florida, without which his electoral plans will fall apart. To do this, he will seek to increase his already gaudy numbers among white noncollege voters as well as make a run at white college voters in several states. And, at least in Florida, he will try to turn more Hispanics in his direction. It is fair to say that continued success in this region is central to his reelection effort.