Introduction and summary
The Trump administration is working aggressively to ramp up the role local police and sheriffs’ departments play in immigration enforcement. One way it is doing so is through a program called 287(g), which allows local law enforcement agencies to partner with U.S. Immigration and Customs Enforcement (ICE) to enforce federal immigration laws. In 2017 alone, 29 jurisdictions enrolled in the program—nearly doubling the number of jurisdictions training local police to act as immigration agents.1
The Trump administration did not create 287(g), but they are expanding it. In doing so, they are ignoring the problems that have shrouded the program for as long as it has existed, including complaints of racial profiling, discrimination, and unreimbursed costs—not to mention myriad legal battles.2
The goal of this report is to provide data on the contributions that immigrants, including unauthorized immigrants, make to localities with 287(g) agreements, contributions that could be in jeopardy because of these agreements. Unauthorized immigrants are long-time residents in communities across the country and are inextricably linked to other community members, including their children, their neighbors, and their employers. As individuals, they own and operate businesses that are vital to their communities; they infuse the economy with spending; and they generate tax revenue. All of these benefits that would disappear if they were to leave the places they call home—either because they are deported or choose to do so due to a hostile environment.3 As additional local officials look at the possibility of signing new 287(g) agreements, this research should help inform those decisions as well as make clear what is at stake for communities already embroiled in the program.
Methodology
The data in this report are presented in two sections. The first section includes core demographic information on the foreign-born residents of jurisdictions with 287(g) agreements—number of immigrants, both overall and unauthorized; how long they have lived in the United States; and estimates of mixed-status families (those with family members holding different legal status.) The report’s second section quantifies the economic and fiscal contributions of immigrants who live and work in jurisdictions with 287(g) agreements, calculating their rates of business ownership and fiscal contributions in the form of tax revenue and spending power. The terms foreign born and immigrants are used interchangeably throughout the report.
All data presented are from the U.S. Bureau of the Census’ American Community Survey (ACS). The 2011-15 five-year ACS is used to provide a population overview of all 57 cities and counties with 287(g) agreements, while three years (2012, 2013, and 2014) of pooled ACS microdata are used more for detailed cross-tabulations. Due to geographic limitations, this more detailed data is only presented for 40 of the jurisdictions with 287(g) agreements. Additionally, data for Arizona and Massachusetts, the two states with 287(g) agreements that cover the entirety of both states, is not presented.
Measures are presented for both all immigrants and unauthorized immigrants specifically.
287(g) overview
In 1996, the Illegal Immigration Reform and Immigrant Responsibility Act added section 287(g) to the Immigration and Nationality Act, creating an avenue for local law involvement in immigration enforcement.4
The initial wave of 287(g) agreements were signed into effect in the late 2000s, coinciding with a period of growth for immigrant communities in many of the jurisdictions.5 In many suburban and rural communities, especially in the Southeast, job growth attracted new residents—including many Latino immigrants—to historically white places. Some residents were not prepared for the rapid demographic shift and the perceived impacts (such as overcrowded housing and increased traffic congestion) on their daily lives. In attempt to limit the number of immigrants living in their communities, they pressured their local governments to take action to limit these changes to their community.6 It was in this political and social environment that 287(g) agreements targeting unauthorized immigrants became a popular avenue. In 2012, more than 70 287(g) agreements were in effect.7 Between 2006 and 2013, more than 175,000 immigrants were deported as a result of the program.8
Historically, there were three types of 287(g) agreements: jail models, task force models, and hybrid models. Under the jail model, local law enforcement officers could perform immigration duties for individuals booked into jails. Under the task force model, officers could perform enforcement duties in the community at any time. As the name suggests, hybrid models included both types.9 Task force and hybrid models were discontinued in 2012, leaving only jail model agreements.
Local immigration enforcement policies, including 287(g) agreements, have chilling effects throughout and beyond immigrant communities.10 A 2012 survey of U.S. Latinos—regardless of citizenship status—found that 44 percent were less likely to contact the police if they were the victim of a crime out of fear that law enforcement would inquire about their immigration status and the immigration status of people they know. Thirty-eight percent reported feeling under heightened suspicion now that local law enforcement is more entangled in the work of federal immigration enforcement authorities; that rate was even higher for Latino immigrants without legal status.11 Policies targeting unauthorized immigrants have far-reaching consequences for public safety if they make the wider Latino or immigrant community less likely to report crimes—a trend that has drawn comments from police chiefs in Los Angeles, Houston, and Salt Lake City in 2017 and is borne out in the data in other cities.12 One study of the Frederick County, Maryland, agreement between ICE and the sheriff’s office analyzing arrest patterns found a chilling effect on crime reporting, specifically between Latinos and the city police department.13
Since its inception, critics of 287(g) have voiced concerns that the program institutionalizes racial profiling and questionable police conduct. In 2010, the U.S. Department of Homeland Security’s (DHS) Office of Inspector General found that some jurisdictions were acting as a task force model despite only having authority in a jail setting. Moreover, researchers at the University of North Carolina at Chapel Hill (UNC) reported that deputized 287(g) officers in one jurisdiction with a jail model targeted drivers and passengers via traffic checkpoints near Latino churches and soccer fields, profiling the group.14 In 2011, the DHS terminated the Maricopa County, Arizona, 287(g) agreement after a U.S. Department of Justice (DOJ) investigation found what it determined was a “pattern or practice of wide-ranging discrimination against Latinos.”15 A separate lawsuit challenging then-Sheriff Joe Arpaio’s conduct, both while the 287(g) agreement was in place and after it was rescinded led to multiple court injunctions, including one based on the court’s conclusion that the Maricopa Sheriff’s Office engaged in racial profiling.16 (Although President Donald Trump later pardoned Arpaio for his criminal contempt of the court’s injunctions, the trial judge did not vacate the finding of guilt.)17 Furthermore, a 2012 DOJ investigation found evidence of racial profiling against Latinos under the 287(g) agreement in Alamance County, North Carolina.18
There is also a question over who becomes ensnared under 287(g) agreements. A 2011 report from the Migration Policy Institute found that approximately half of detainers issued as a result of 287(g) agreements were for misdemeanors and traffic offenses.19 A 2010 report from UNC found that 87 percent of those detained in North Carolina were charged with misdemeanors.20 More recently, the Naples Daily News reported that three-quarters of immigrants transferred to ICE under the Collier County, Florida, 287(g) agreement were for “misdemeanor traffic offenses.”21
287(g) agreements have also been criticized for the amount of money that they cost jurisdictions.22 Law enforcement agencies, and thus taxpayers, are responsible for the startup costs, including sending officers to ICE trainings, the administrative costs associated with 287(g), and overtime pay for officers who perform immigration-related tasks instead of their actual police duties.23 In addition, costly legal battles around issues of racial profiling—at the jurisdiction’s expense—have been numerous, providing further evidence that 287(g) agreements are a financial burden to jurisdictions, potentially costing taxpayers millions of dollars each year.24
Several factors, including community pushback, concerns about police and immigrant relations, and the cost of 287(g) agreements led to their revocation in jurisdictions across the United States. Other jurisdictions cite the concerns as a reason to not sign 287(g) agreements in the first place.25
The DHS has institutionalized other efforts to engage local law enforcement agencies in immigration enforcement, efforts that can make 287(g) a force multiplier in jurisdictions with multiple local enforcement programs. Secure Communities—a nationwide information-sharing program between law enforcement agencies, the FBI, and the DHS—makes this issue especially salient.26 Under Secure Communities, law enforcement agencies share fingerprints of individuals arrested with the FBI, who then shares them with the DHS to check if an individual has legal status in the United States. With this information, the DHS often requests that the individual be held for further detention. Jurisdictions cannot opt out of this information sharing—it is mandatory—but they can opt out of honoring ICE detainer requests. Secure Communities means that ICE is already alerted to any immigrant in law enforcement custody who DHS has previously encountered. 287(g) agreements allow local law enforcement officers to begin an immigration investigation or choose to begin deportation proceedings on their own. To go even a step further, under 287(g) task force models, officers deputized under 287(g) could conduct immigration patrols, and many used this authority to set up checkpoints in communities.27 In 2012, citing Secure Communities, ICE ended all existing agreements that were task force and hybrid models.28
As a candidate, Donald Trump made immigration enforcement an anchor of his campaign, and the Trump administration has wasted no time in cracking down on immigrant communities. Immigration arrests increased 42 percent during Trump’s tenure in fiscal year 2017 compared with the same time period in fiscal year 2016. Compared with fiscal year 2016, the share of immigrants arrested in fiscal year 2017 with a criminal conviction declined.29 One component of this ramped up enforcement regime is an expansion of 287(g) agreements. The 29 new agreements include several counties with notorious law enforcement issues, including Waller County, Texas, which failed to meet state reform standards after the death of Sandra Bland in 2015, and Knox County, Tennessee, which had its previous application denied because of police misconduct.30 While all agreements in place, as well as new agreements, have been jail models, numerous jurisdictions have expressed interest in reviving the task force model agreements.31
Furthermore, in July 2017, Thomas Homan, acting director of ICE, signaled the administration’s desire to “triple those agreements by the end of the year.”32 As of January 1, 2018, there were 59 signed agreements covering three cities, 54 counties, and two states as well as more than 1,800 law enforcement officials. Dozens of additional jurisdictions have expressed interest in joining the program.33
Demographic snapshot of jurisdictions with 287(g) agreements
Basic demographics
Author’s note: All data in this section are author calculations based on U.S. Bureau of the Census data. They are all available in Appendix Table 1, where they are sourced.
Jurisdictions with 287(g) agreements range widely in terms of their demographics—they are scattered across the nation; are found in places urban and rural; and have immigrant communities both large and small. For the most part, 287(g) jurisdictions are largely located in the Southeast United States as well as in Texas. These jurisdictions range greatly in terms of the size of their immigrant communities. Tarrant County, Texas, for example, ranks as the largest jurisdiction, with more than 1.9 million residents, 302,000 of whom were born in another country. At the other end of the spectrum, four counties in Texas—Goliad, Refugio, DeWitt, and Jackson Counties—each have fewer than 1,000 foreign-born residents. Approximately 6 percent of immigrants in the United States live in the 57 cities and counties with 287(g) agreements, 10 percent when you include Arizona and Massachusetts, the two states with state-wide 287(g) agreements.
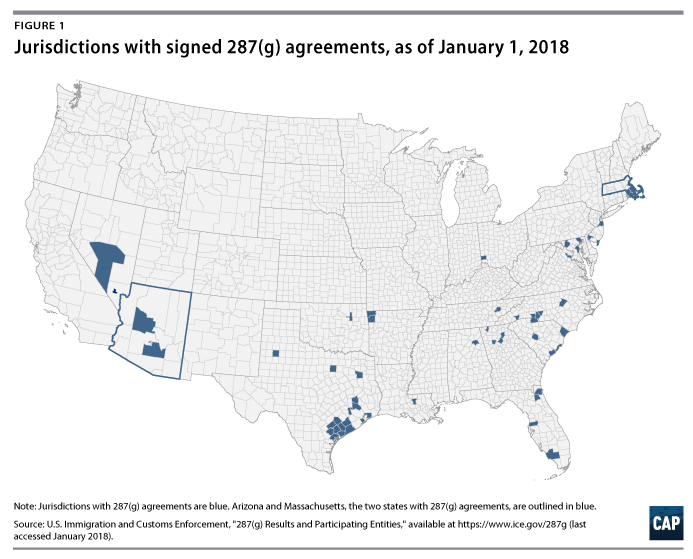
Just as the size of the immigrant community varies in jurisdictions with 287(g) agreements, so too does the share of the population that is foreign-born—ranging from 2 percent in Goliad County, Texas, to 42 percent in Hudson County, New Jersey. Most jurisdictions that enroll in 287(g) agreements—45 of 57—have smaller concentrations of immigrants than the U.S. average. Conversely, traditional immigrant-receiving communities, or those with large shares of foreign-born residents, do not have 287(g) agreements in place. The general theory is that these communities have a longer history with immigrants and tend to be more comfortable with their presence.
On March 2, 2018, Hudson County, New Jersey, terminated their 287(g) agreement. In a county where more than 40 percent of residents are foreign-born, advocacy groups on the ground had long fought back against the agreement.
34 The county executive cited state bail reform as the reason for the change, but one freeholder—the term for county elected officials in New Jersey—specifically mentioned the Trump administration’s position on immigrants as a contributing factor.
35 Home to nearly 75,000 unauthorized immigrants, 19 percent of the county’s population lives in mixed-status families. Immigrants own 3,800 businesses, generate $8 billion in spending power, and contribute $3.3 billion to federal, state, and local taxes each year. At the time of data analysis, Hudson County had a signed 287(g) agreement. Throughout the report, data is presented for the jurisdiction.
At its peak in 2012, 10 percent of the nation’s immigrants lived in cities and counties with 287(g) agreements, 27 percent when including states with 287(g) agreements.36 With the end of task force and hybrid 287(g) models, that share declined substantially. While the number of 287(g) agreements is multiplying under the Trump administration, the expansion is happening in less populous places, both in terms of overall population and immigrant populations.
According to the 2015 five-year ACS, 38 percent of people in the United States are non-Hispanic white. Looking at 287(g) communities more broadly, slightly more than half of these communities have populations that are more diverse than the United States as whole and slightly less than half have populations that are less diverse.
Data on unauthorized immigrants is available for 40 jurisdictions with 287(g) agreements.37 All but one (Clay County, Florida) of these locales have unauthorized immigrant populations larger than 1,000 individuals. In the United States, unauthorized immigrants make up 3.4 percent of the U.S. total population.
Jurisdictions with 287(g) agreements in Southeastern states, such as Georgia, North Carolina, and South Carolina, as well as Texas, tend to have higher shares of immigrants who lack legal status. Jurisdictions in Northern states, such as Massachusetts, New Jersey, and Maryland, tend to have lower shares of unauthorized immigrants, as does Florida. Places with above average shares of immigrants also had above average shares of unauthorized immigrants, while the picture was mixed for places with smaller than average shares of foreign-born residents.
In more than half of jurisdictions with 287(g), unauthorized immigrants make up a smaller share of the population compared to the United States. Conversely, jurisdictions with both large shares of immigrants and large shares of immigrants who are unauthorized see that reflected in their overall population. For example, more than 1-in-10 residents in Hall County, Georgia; Hudson County, New Jersey; and Whitfield County, Georgia are unauthorized. Regardless of the size of the unauthorized immigrant community in a place, studies show that fear of immigration enforcement drives down crime reporting—not only from unauthorized immigrants but also from Latinos more broadly, making entire communities less safe.38 And although unauthorized immigrants make up a small share of residents in most 287(g) jurisdictions, the impacts communities will feel from local law enforcement participation with ICE will be far more significant and widespread and will immediately affect a much larger community.39
Length of time in the United States
Immigrants have longer histories in places with 287(g) agreements than one might anticipate. The median length of time an immigrant has been in the United States based on the data set used for this report is 17 years; 11 years for unauthorized immigrants. In all 40 of the 287(g) jurisdictions, more than half of the foreign-born community has been in the United States for 15 years or more. Not one of the jurisdictions has an immigrant population with a median length of residency less than 10 years.
When looking at unauthorized immigrants specifically, it is striking how long these community members have lived in the United States: 60 percent for more than 10 years. Only one jurisdiction—Clay County, Florida—has a median number of years in the United States less than five years.
These findings certainly challenge the notion that unauthorized immigrants do not have long-term histories with their respective communities and, in turn, suggests that these agreements affect people with deep ties in these jurisdictions.40 In many 287(g) jurisdictions, the median length of time immigrants have lived there mirror the overall U.S. stats.
Looking at median length of time in the United States and the dates on which most agreements were signed, it appears that most jurisdictions entered into 287(g) agreements in the years immediately following the initial arrival of immigrants, and these individuals remain in these communities to this day. While ICE lists all current 287(g) agreements as being signed in 2016 and 2017, many of these dates represent agreement renewals. The bulk of 287(g) agreements were originally signed between 2007 and 2009—which the analysis of time in the United States suggests is just a few years after the arrival dates.41 However, given these trends, two things remain unexplained and are questions that policymakers, advocates, and elected officials in areas considering 287(g) agreements should answer:
- First, why are new, relatively small jurisdictions signing up for 287(g) agreements?
- Second, given that they are targeting groups of individuals who have been a part of the community for more than a decade, why do places continue to re-enroll in 287(g)?
This complicates the prevailing narrative that 287(g) agreements are a response to shifting demographics.42
Mixed status families
Beyond the length of time they have lived in the United States, a stronger measure of unauthorized immigrants’ ties to their communities can be seen in their mixed-status families. Across the United States, more than 10.8 million people live in the same household as an unauthorized family member, representing 4 percent of all households. Approximately 6.2 million young people under the age of 18, representing 8 percent of all youth, live in mixed-status families. Rates of mixed status families in 287(g) jurisdictions are particularly high in Hall County, Georgia, at 30 percent, and Whitfield County, Georgia, at 26 percent.
Collectively, unauthorized immigrants and their families make up 7 percent of the total U.S. population. A ratio can help put these numbers in perspective: Across the United States, 69 out of every 1,000 people live in mixed-status families. For jurisdictions with 287(g) agreements, this value ranges from 10 out of every 1,000 to 213 out of every 1,000 people. In total, more than 1.5 million individuals live in mixed-status families across the 40 jurisdictions described in this report.
Families in the immigrant community are made up of citizens, legal residents, and those lacking legal status, complicating the argument that lawfully present immigrants and U.S. citizens have nothing to worry about when it comes to immigration enforcement. Make no mistake—policies that target immigrants without legal status also harm native-born citizens. Children living in mixed status families are particularly vulnerable after a parent’s detention and deportation, which most often results in the loss of the family’s primary earner.43 Negative effects, such as emotional and behavioral consequences—including anxiety and depression; economic and housing instability; and declines in school performance—all stem from the forced separation.44
Economic and fiscal contributions of immigrants in jurisdictions with 287(g) agreements
Beyond longstanding ties to families and the community, additional reasons 287(g) agreements are not smart and potentially disruptive come down to financial strain. In creating hostile environments for immigrants and their families, jurisdictions that pursue 287(g) jeopardize economic gains that come from business ownership, spending power, and tax revenue attributed to foreign-born residents.
Research on Arizona’s 2007 anti-immigrant legislation can be used as an illustrative comparison of the economic effects that accompany an exodus of immigrants from a given locality. The Public Policy Institute of California estimates the Legal Arizona Workers Act—which mandated the use of E-Verify by employers in the state and imposed state licensing penalties on employers who knowingly hire unauthorized workers—resulted in 17 percent of Latino immigrants leaving the state and a shift for those who remained from the formal economy to the underground economy.45 Moody’s Analytics found that the number of immigrants leaving Arizona was responsible for a 2 percent reduction in the state’s GDP each year from 2008 to 2015 as well as a lower employment rate.46
Business owners
Immigrants are more likely than those who were born in the United States to own their own business.47 Immigrants represent 17 percent of the labor force but 19 percent of business owners. The Fiscal Policy Institute’s (FPI) recent work has shone a light on immigrants’ even larger role in what David Dyssegaard Kallick of FPI calls “Main Street businesses.”48 Data from 2012 to 2014 indicates that these places—“shops and services that are the backbone of neighborhoods around the country,” including restaurants, grocery stores, dry cleaners, gas stations, and the like—are disproportionately owned by immigrants, at 29 percent.
The effects of “Main Street businesses” extend beyond the revenue from the stores and services themselves, as they are, according to FPI, “[P]laying a critical role in making neighborhoods attractive places to live and work.”49 Additionally, immigrant-owned businesses create millions of jobs for native-born workers.50
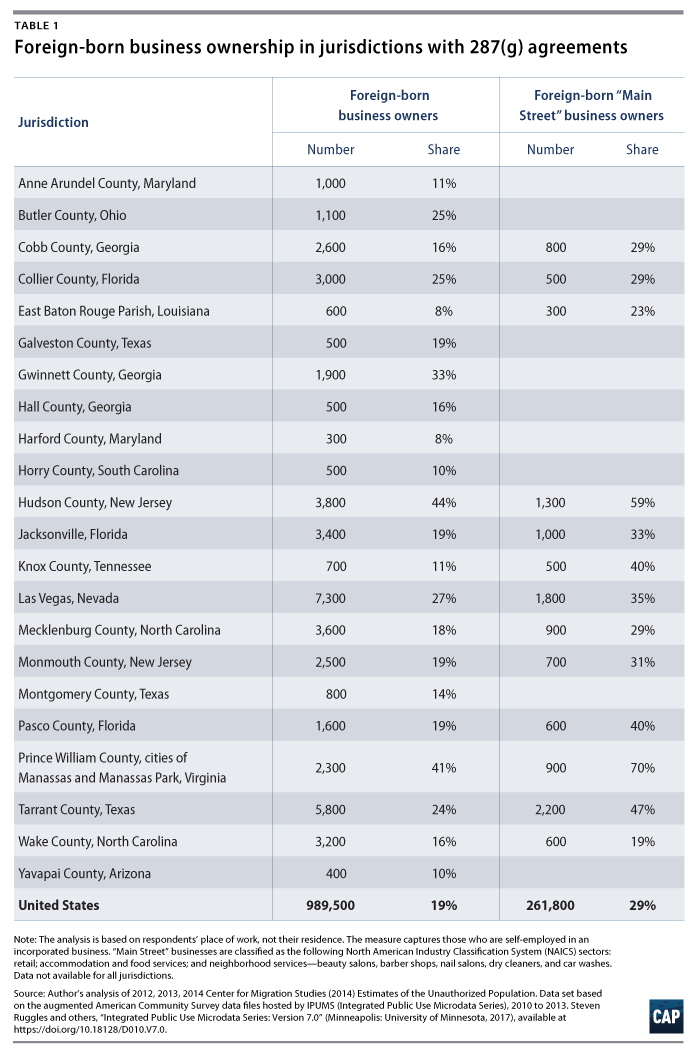
Immigrants make outsized contributions as business owners in many jurisdictions with 287(g) agreements.51 Immigrants own more than one-third of businesses in Hudson County, New Jersey, Prince William County, Virginia, and in Gwinnett County, Georgia. In each of the 13 of the jurisdictions analyzed, immigrants own more than 1,000 businesses that could be threatened by 287(g) agreements. Foreign-born business owners represent more than one-third of the local-serving Main Street businesses in Prince William County, Virginia, Hudson County, New Jersey, Tarrant County, Texas, Knox County, Tennessee, and Las Vegas, Nevada.
Spending power and tax revenue
Another major economic contribution that immigrants make to their communities as well as the United States comes in the form of spending power and tax revenue. Immigrants pay taxes, but they also infuse money into their local economy as they procure goods and services, benefiting all residents regardless of their nativity. Again, as immigrants make the decision to leave a hostile environment, the spending power and tax revenue that they generate also disappears.
Based on methodology developed by New American Economy, in these 40 jurisdictions, households with unauthorized adults have a collective $14.7 billion in spending power.52 In addition, they contribute $3.1 billion in federal taxes and $1.7 billion in state and local taxes annually.53
At the even broader level of all households with a foreign-born adult, the 40 jurisdictions profiled here stand to lose $65.9 billion in spending power. Collectively, immigrant households in these jurisdictions are responsible for $17.3 billion in federal tax revenue and $7.1 billion in state and local tax revenue annually. Jurisdictions with above average share of contributions compared to the United States at large include Hudson County, New Jersey; Prince William County, Virginia; Las Vegas, Nevada; Gwinnett County, Georgia; Whitfield County, Georgia; Cobb County, Georgia; Collier County, Florida; Tarrant County, Texas; and Monmouth County, New Jersey.
Communities that have or pursue 287(g) agreements put these financial gains at risk. In one study, immigrant families’ incomes fell by 70 percent after a parent was detained.54 While this can be devastating to a family, the repercussions extend beyond the family unit. Researchers from the University of North Carolina found that, in the wake of a 287(g) agreement, business owners in Latino neighborhoods in a 287(g) jurisdiction noted declines in the number of Latino customers as well as their spending.55
Conclusion
Under the Trump administration, ICE eliminated the use of prosecutorial discretion, no longer focusing its limited enforcement resources on high-priority individuals.56 With elimination of prosecutorial discretion, ICE has regressed, arresting far more people without criminal convictions while local law enforcement officials take on even greater roles in the federal government’s deportation force. Perhaps the most egregious breach of these standards is the 287(g) program, which goes beyond other immigration enforcement programs by turning local police officers and sheriff’s deputies into ICE personnel. At best, 287(g) agreements intensify federal enforcement efforts and send an adversarial message to the country’s foreign-born residents; at worst they are mechanisms for discrimination that jeopardize large swaths of the communities that participate.
As of January 1, 2018, 59 jurisdictions had 287(g) agreements, a number the Trump administration wants and fully expects to expand. In fact, since completion of this report’s data analysis, an additional 17 jurisdictions announced signed 287(g) agreements, bringing the total to 75, factoring in Hudson County’s decision to terminate its agreement.57 Before community leaders make the decision to pursue or sign a 287(g) agreement, they should take into account this report’s demographic and economic data, which shows there is much at stake if the immigrant community disappears.
About the author
Nicole Prchal Svajlenka is a senior policy analyst with the Immigration Policy team at the Center for American Progress. She is grateful to the Center for Migration Studies of New York for providing access to its data; Pavel Dramski of New American Economy and David Dyssegaard Kallick of the Fiscal Policy Institute for providing insight into their methodologies; as well as Chris Rickerd of the American Civil Liberties Union for his thoughtful review. She also thanks Tom Jawetz and Philip E. Wolgin of the Center for American Progress for their valuable feedback, the other members of the Immigration Policy team for their input and assistance, and the Art and Editorial team for their work on this report.
Appendix
Two types of ACS data are presented in this report. The first is the 2011-15 pretabulated data, accessed via the U.S. Bureau of the Census’ American FactFinder. This dataset includes population estimates for all 59 jurisdictions with 287(g) agreements.
All other cross-tabulations presented in this report come from pooling three years of ACS microdata (2012, 2013, and 2014), provided by the Center for Migration Studies of New York, which estimates the legal status of foreign-born respondents.58
There are several reasons the data are not available for all jurisdictions. Microdata is available in geographies called public use microdata areas (PUMAs), which presents some limitations. First, PUMAs have a population threshold of 100,000, so counties with fewer than 100,000 people will be combined with other counties. Second, places larger than 100,000 people are constructed from multiple PUMAs, but they do not always align perfectly with city or county boundaries. PUMAs are assigned to a city or county if more than half of the population living in the PUMA live in the jurisdiction in question. The PUMAs are then aggregated, and an error rate is created, measuring the share of people who are incorrectly included or excluded. This report presents data for jurisdictions with error rates lower than 15 percent. Given the nature of these PUMA “building blocks,” places that are excluded are typically home to a small foreign-born population.
Length of time in the United States reported is the median and corresponds with the survey year for each of the three years.
The methodology for mixed status families is derived from the Center for American Progress’ “Keeping Families Together” report.59 The original methodology includes only households of two or more people but includes all immigrants regardless of legal status. This analysis instead counts unauthorized immigrants and anyone who has an unauthorized family member in the same household in this measure.
Business ownership—in particular Main Street businesses—is adapted from Fiscal Policy Institute methodology. The analysis is based on place of work instead of respondents’ residence to specifically focus on businesses located in a jurisdiction rather than workers who live there but may own businesses elsewhere. Both place of work and place of residence analyses were run, with results being similar. The measure captures those who are self-employed in an incorporated business. Main Street businesses are classified as the following North American Industry Classification System (NAICS) sectors: retail, accommodation and food services, and neighborhood services (beauty salons, barber shops, nail salons, dry cleaning, and car washes).
Tax revenue and spending power is adapted from New American Economy methodology. Foreign-born households include any household with a foreign-born adult in the labor force; unauthorized households include any household with a foreign-born adult without legal status in the labor force. Income quintiles are based on household income. Federal tax rates come from the Congressional Budget Office’s 2016 estimates, and state tax rates come from the Institute on Taxation and Economic Policy.
Detailed jurisdictional data for all measures can be found in the data tables in the PDF.