Appendix available in the PDF and Scribd versions of this issue brief.
In the wake of the 2012 presidential election, Republican elected officials and conservative political pundits publicly bemoaned the party’s failure to connect with and win over voters of color. Furthermore, they conceded that a failure to fare better with this demographic in future elections would carry dire electoral consequences and doom the GOP’s chances of winning back the White House. Some may view the Republicans’ wide-spread success in the 2014 midterms as an indication that the GOP’s concerns immediately following the 2012 presidential election are no longer applicable. However, it shouldn’t be lost on anyone that midterm elections have historically had low voter turnout rates, and ultimately, the voter makeup of the electorate in midterm years has been very different than in a presidential election. Therefore, the upcoming 2016 election provides the first test case of the Republicans’ post-2012 election predictions.
Since 2012, these demographic challenges have only grown more acute. As people of color become an ever larger share of states’ electorates, the political implications for both parties comes into even sharper focus: In 2016, to win the presidency—as well as many U.S. Senate races—candidates will need to secure substantial support from voters of color.
The demographic changes in the United States are far from being fully realized: Not until 2043 will people of color make up a majority of the U.S. population. Despite the seemingly long trajectory of these changes, the political implications are already being felt in many states. By 2016, demographic shifts will be influential in states such as Florida, where voters of color are an increasingly significant share of the electorate, as well as in states such as Ohio, where elections are close and growth among voters of color is rapidly outpacing the growth of the non-Hispanic white electorate.
This issue brief identifies what the American electorate is projected to look like in key battleground states during the 2016 elections, and based on those projections, identifies the potential electoral influence of voters of color. This is accomplished by estimating the racial and ethnic makeup of the 2016 voter-eligible population and then demonstrating the potential political impact of demographic changes by conducting two election simulations. The first simulation assumes that, across all racial and ethnic groups, voters turn out at the same rate and have the same party preference as they did in 2012. In the second simulation, voter turnout rates are again held constant from 2012, but racial and ethnic groups are assumed to revert to the party preferences they exhibited in 2004. Voter turnout rates are held constant from 2012 so as to isolate the electoral impact of demographic changes at varying levels of party preference. If turnout rates among voters of color are higher in 2016 than those used in these simulations, then the electoral effects will be greater than those presented here. Conversely, if turnout rates fall, then the magnitude of the political effects will be dampened.
Two narratives regarding the 2016 elections are already emerging around voters of color. The first storyline is that the growing number of voters of color in battleground states such as Virginia and Ohio will provide Democrats with an electoral windfall and thus an even smoother path to the White House. The first election simulation tests this theory and quantifies how much of an electoral advantage the growing numbers of people of color will likely yield Democrats if turnout rates and party preferences hold constant to 2012 levels.
The second emerging narrative—which is simply the inverse of the first scenario—highlights the fact that Republicans must make inroads with voters of color if they want to have a fighting chance at winning the White House and a number of U.S. Senate races in 2016. Increased Republican support among voters of color is not unrealistic, particularly given the fact that as recently as the 2004 presidential election, President George W. Bush received 44 percent of the Latino and Asian American vote and 11 percent of the African American vote nationally. Thus, the second election simulation identifies which states, if any, Republicans could win if they regained their 2004 levels of support among voters of color.
Neither of these simulations or their conclusions should be viewed as predicting the outcome of the 2016 election. Instead, they are used to capture—in a quantitative manner—the potential political implications of electoral demographic changes in key states. As the analysis below highlights, the impact and magnitude of demographic changes on the 2016 elections is considerably different across the United States, yet—at the same time—this issue brief elucidates broader trends important for both parties to understand. Highlights from this brief include:
- If Democrats are able to retain high levels of support among voters of color in 2016 as they did in 2012, then they will more easily win battleground states such as Virginia, where Democrats’ margin of victory would increase by more than one-third. More importantly, Democrats could win back some states they lost in 2012, including North Carolina.
- Republicans will need to secure a rising level of support among voters of color in order to compete in key states in 2016. In some states, such as Florida, restoring party preferences to their 2004 levels would enable the GOP to narrowly win back states they lost in 2012 but had won in previous elections. However, in order to win back other key states that the GOP won in 2004, such as Ohio and Nevada, the GOP would need to exceed the share of support it received from voters of color in 2004.
A changing electorate
The United States is undergoing a historic demographic shift, with people of color expected to be a majority of the population by 2043. Similar changes are occurring in the U.S. electorate, albeit at a different rate and driven by different factors. While there are parallels between population changes and electoral shifts, the two do not occur in lock step.
In fact, many changes occurring throughout the population are not ever realized within the electorate. For example, there is a large gap between the Latino share of the broader population—those 18 years of age and older—and their share of the electorate. Since many Latinos are not U.S. citizens—a function of our broken immigration system—they account for a larger share of the U.S. population than they do the electorate. Similarly, there is often a lag between broader population changes and those in the electorate. For example, in California, people of color became a majority of the population in 1999, but it was not until 2014 that enough U.S. citizens had aged into the electorate for people of color to make up a majority of all eligible voters in California.
Although demographic changes in the electorate do not fully track the seismic demographic shifts in the population, there are nonetheless obvious and significant shifts occurring within the U.S. electorate. While each state’s demographics are changing at different paces and are being driven by different racial or ethnic groups, one trend is unmistakable: Non-Hispanic white voters are a shrinking share of the electorate.
From North Carolina to Arizona, populations of color are becoming a noticeably larger share of the electorate. In Arizona, voters of color made up 32.4 percent of all eligible voters in 2012. By 2016, this share will reach 35.6 percent, with Latinos making up 23 percent of the Arizona electorate alone. In other states, voters of color have not reached the point of being a significant share of the overall electorate, but they will still represent the majority of the net increase in eligible voters between 2012 and 2016. In Pennsylvania, for example, people of color made up 17 percent of the electorate in 2012 and will rise to 19.2 percent by 2016.The growth of this electorate represents 87 percent of the net increase in eligible voters in the state and therefore may prove to be influential in close presidential and U.S. Senate races in 2016. (see Table 1 and the appendix for states’ electorate by race and ethnicity)
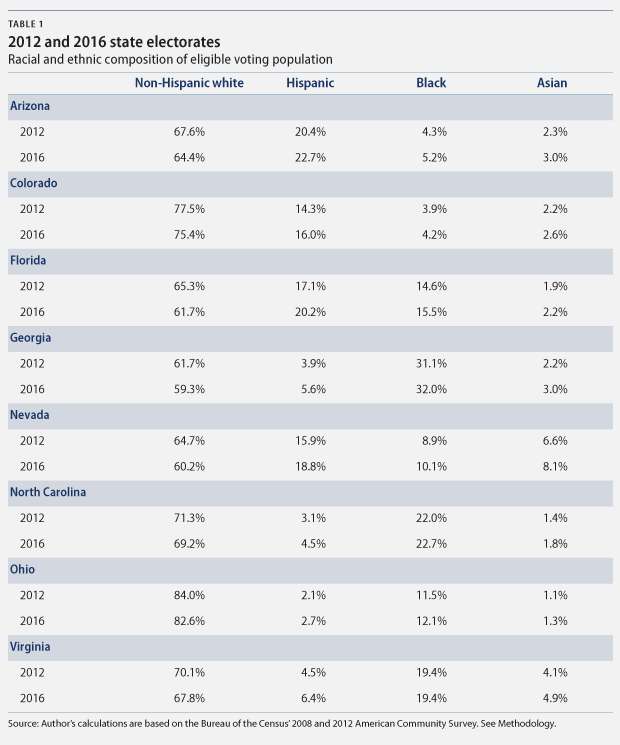
Across various states, different racial and ethnic groups are driving the increase in people of color’s share of all eligible voters. In some states, voters of color are becoming a larger share of the electorate as a result of rapid growth within a specific racial or ethnic group of the electorate, which may on its own be a rather small share of the overall electorate. For example, in Georgia, people of color made up 38 percent of the electorate in 2012. That number will rise to 41 percent by 2016. This growth is attributable in large part to the increasing size of the Latino electorate, which is on track to make up nearly 6 percent of all eligible Georgia voters by 2016—a nearly 50 percent increase since 2012.
Electoral effects of demographic changes
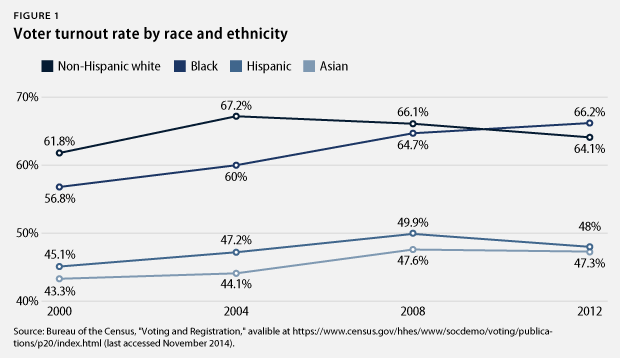
As outlined above, people of color are becoming a larger share of the electorate all across the United States. But as we have seen in past elections, the racial and ethnic composition of the eligible electorate is very different than that of actual voters. Historically, eligible Latino and Asian American voters have had low turnout rates, hovering around mid- to high-40 percent for the past few presidential elections. (see Figure 1) It is clear that voters of color are currently punching below their political potential, making up a much smaller share of actual voters than they are of the eligible voting population.
Given the gap between the racial and ethnic makeup of eligible and actual voters, to what extent will electoral demographic changes translate into political influence? One way to quantify what impact shifting demographics will have in 2016 is to simulate an election. Below are the results of two simulations:
- In the first simulation, it is assumed that voter turnout rates and political persuasion among all racial and ethnic groups remain the same as they were in 2012. This simulation begins to quantify what impact the ongoing demographic changes will have on elections if levels of support for Republicans and Democrats, as observed in the 2012 presidential election, remain the same in 2016.
- In the second simulation, it is still assumed that racial and ethnic groups turn out to vote at the same rates as in 2012. However, in this simulation, the model is changed to one where voters support parties at the same level they did in 2004. This simulation aims to identify potential electoral outcomes if the Republican Party regains the high levels of support among voters of color demonstrated in 2004.
As one would expect, both of these simulations show that the electoral impact of these demographic changes varies considerably between states. Yet these scenarios also clearly reveal that the influence of voters of color on election outcomes is increasing, and, for both parties, the path toward winning elections will require significant support among this growing segment of the electorate.
Results: Simulation 1
By 2016, given the rising share of people of color in the electorate, if Democrats are able to maintain support among voters of color at the same levels they achieved in 2012, then they will more easily win states that were only narrowly won in 2012.
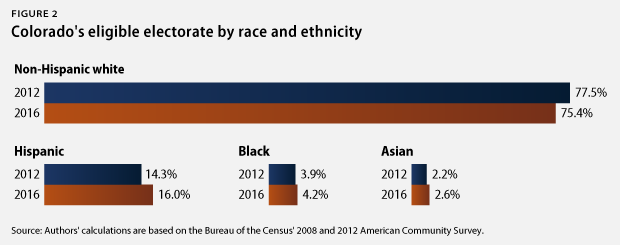
For example, the 2012 presidential election in Colorado was a tight race that President Barack Obama ultimately won—51 percent to 46 percent—in no small part due to his support among voters of color. These voters collectively accounted for more than 20 percent of eligible voters, with Latinos alone making up 14 percent of all eligible voters. By 2016, people of color’s share of the electorate will rise by 2 percentage points to 24.6 percent of all eligible voters. This means that the potential influence voters of color will have on the outcome of Colorado elections will be greater than it was in 2012.
Specifically, in the first election model, CAP identifies that in 2016, the Democratic candidate’s margin of victory in Colorado would increase by 1.6 percent points due to demographic shifts alone, if all else is the same from the 2012 election. In other words, if—across racial and ethnic groups—voters turn out and support political parties at the same level they did in 2012, the Democratic candidate would win the state by a margin of 51.8 percent to 45.2 percent just by virtue of the increase in the number of voters of color as a share of the electorate.

However, demographic changes—and continued support among voters of color—will not only make it easier for Democrats to win states that they previously won in 2012. These demographic changes are also creating an opportunity for Democrats to win back states they lost in 2012.
During the last presidential election cycle, voters of color—and Latinos in particular—created a firewall for President Obama. In 2012, the Latino electorate helped Democrats fend off tough challenges in Colorado by voting for Democrats at high levels. However, the 2012 election also illustrated that not every state has the demographics necessary for Democrats to successfully build a wall of defense against the GOP.
Take Colorado and North Carolina, for example. Obama won both states in 2008, but by 2012, support for Democrats among non-Hispanic white voters had dropped by 6 percentage points in Colorado and 4 percentage points in North Carolina. During the same period, voters of color became a larger share of these states’ electorates, and support for President Obama among these voters increased. In Colorado, these changes were large enough to build a firewall of support for Democrats and keep the state blue. In North Carolina, however, non-Hispanic white voter’s support for Massachusetts Gov. Mitt Romney (R) was so strong that even President Obama’s high level of support support among voters of colors could not keep the state from turning red.
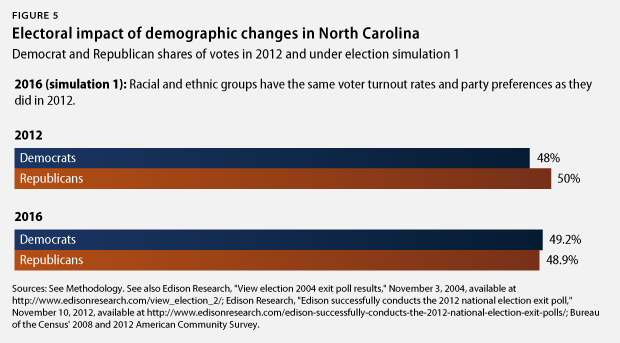
However, CAP’s election simulation indicates that North Carolina’s shifting demographics are such that even if the Democratic candidate fails to regain support among white voters in 2016, Democrats could still retake the state based largely on support from voters of color. By 2016, voters of color will make up 31 percent of the state’s eligible electorate, compared to 29 percent in 2012. While this change isn’t drastic, if the 2016 Democratic presidential candidate is able to retain the level of support Obama secured in 2012 among voters of color, it would translate into enough support to overcome the Republican’s hold on non-Hispanic white voters. Democrats would pick up a net 2.3 points, meaning they would flip the state back in their favor.

But just how great is the potential of North Carolina’s eligible voter of color electorate to act as a counter weight to the growing Republican support among white voters in 2016? It is clear that there are limitations to the rising voters of color firewall in North Carolina. If Republicans, for example, receive 73 percent of the votes cast by white voters—a level of support that is greater than that observed in 2012 but was achieved by Republicans in 2004—growing demographics among voters of color wouldn’t be enough to secure a win for the Democratic candidate.
In other words, while demographic changes between 2012 and 2016 are large enough to act as a counterweight to the Republican support observed in 2012, these changes might not allow Democrats to fend off or upend Republicans if the GOP continues their trend of picking up support among North Carolina’s non-Hispanic white voters.
Results: Simulation 2
While Democrats have a great deal to gain if they are able to maintain support among voters of color, they are not the only political party that is positioned to benefit from the nation’s shifting demographics. The second simulation highlights the political impact of demographic change if the Republican presidential candidate in 2016 is able to secure support among voters of color at the same levels President George W. Bush experienced in 2004.
In many ways, this simulation adds credence to the increasingly frequent claim made by pundits that if the GOP wishes to win key states, it must increase support among voters of color. Nationally, in 2012, Republicans received just 26 percent of the Asian American vote, 27 percent of the Latino vote, and an even smaller share of African American vote, at a paltry 6 percent. If Republicans are able to increase their support among voters of color, it is clear that they will be positioned to win back states they lost in 2008 and 2012.
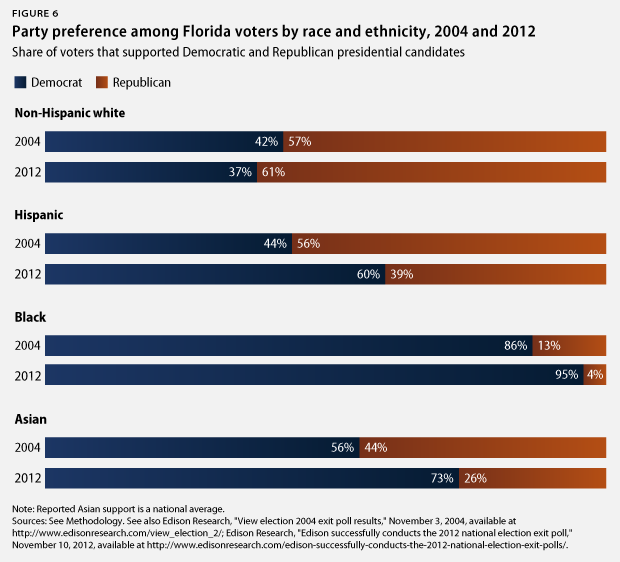
In 2004, in Florida, for example, President George W. Bush took the state with a 5-point margin of victory. Republicans won the state with high support among white voters and solid support among voters of color. In fact, President Bush secured 56 percent of the Latino vote in 2004, but this share fell to 39 percent by 2012. (see Figure 6)
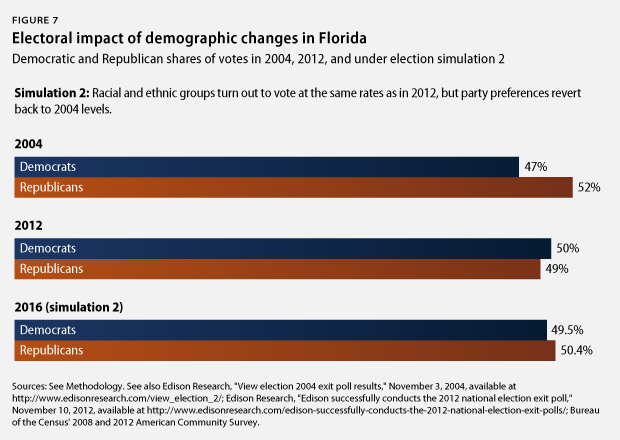
Perhaps obviously, if the 2016 Republican candidate were able to regain the level of support President George W. Bush saw from voters in 2004, the GOP would retake Florida in 2016. But less obvious is the fact that Republican’s margin of victory under such a scenario would fall drastically from what it was in 2004, to just 0.9 percentage points in 2016. (see Figure 7) It is clear that Florida is quickly shifting toward—if not already arrived at—a point where a victory for either party in the state will require a strong showing of support among voters of color.
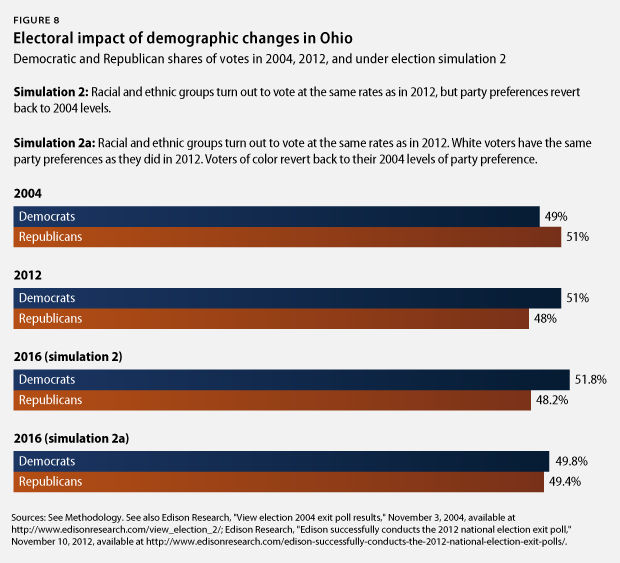
Demographic changes are occurring at such rapid rates that, in some states, regaining 2004 levels of support simply will not be enough for the Republican presidential candidate to win them back in 2016. In other words, as voters of color become a larger share of the electorate, winning a state in 2016 will necessitate a higher level of support among voters of color than in past elections. In Ohio, for example, the GOP took the state in 2004 with slightly more than a 2 percent margin of victory. President George W. Bush obtained noticeable support among voters of color: 16 percent of African Americans in Ohio voted for him. This level of support, however, deteriorated during the next few elections. By 2012, Gov. Romney took only 6 percent of votes cast by African Americans. Between 2004 and 2016, the electorate of Ohio will have changed. When President Bush won Ohio in 2004, voters of color collectively comprised less than 14 percent of the state’s electorate. By 2016, African Americans will constitute more than 12 percent of the electorate, and people of color collectively will account for 17 percent of the state’s electorate. In light of these changes, CAP’s analysis finds that in 2016, if—across racial and ethnic groups—voters cast ballots as they did in 2004, the Democratic candidate would win by a margin of 3.6 percentage points. (see Figure 8)
In 2004, non-Hispanic white voters’ support for Democratic presidential candidate Sen. John Kerry (D-MA) was higher than their support for President Obama in 2012, meaning that, under the second simulation, Democrats would pick up more support among white voters than they did in 2012. But even if the Republican candidate in 2016 maintains the high support that Gov. Romney received among white voters, while at the same time regaining 2004 levels of support among voters of color, the GOP would still lose Ohio. (See Appendix for full results under this modified simulation 2)
Conclusion
As attention turns toward the 2016 elections, political parties, pundits, and policymakers all should take stock of electoral demographic changes sweeping the nation and the potential influence these changes will have on the elections in 2016. This analysis shows—through a variety of election simulations—that as people of color become a larger share of states’ electorates, it will be crucial for both Republicans and Democrats to secure the support of this vital voter cohort. But most importantly, this analysis shows that the level of support among voters of color that a candidate from either party needs to secure in order to carry a state is rising. For Republicans, simply repeating the history of 2004—obtaining significant support among voters of color—will not necessarily mean a win in many swing states, including Ohio and Nevada. While the demographic changes discussed here are far from dictating a clear electoral destiny for either party, the fact remains that voters of color are rapidly becoming a larger share of states’ electorate all across the United States, which means that neither the Democrats nor the Republicans can afford to ignore these powerful voters in the coming years.
Methodology
Eligible voter population estimates for 2016 were estimated for each state by utilizing the Bureau of the Census’ American Community Survey from 2008 and 2012. Specifically, average growth rates for each racial and ethnic group were identified at the state level and then applied forward to estimate the 2016 eligible voting population. In the analysis above, CAP ran two 2016 election simulations. In both simulations, CAP held voter turnout rates from 2012 constant. Voter turnout rates were estimated using 2012 exit polling data collected by Edison Research and as reported by CNN.
In the first simulation, CAP assumed that voter preference stayed the same as in 2012. Exit polling data was used to identify party preference for racial and ethnic groups at the state level. When sample sizes were too small and exit polling data could not indicate party preference of a racial or ethnic group at the state level, CAP utilized the national average.
In the second simulation, CAP again assumed that voter turnout rates remained the same as in 2012, but that across racial groups, party preference reverted back to 2004 levels. Finally, in a modified simulation 2, CAP assumed that white party preference was the same as in 2012, but that among voters of color, party preference returned to 2004 levels.
Patrick Oakford is a Policy Analyst in the Economic and Immigration Policy departments at the Center for American Progress.
The author would like to thank Angela Maria Kelley, Vanessa Cardenas, Marshall Fitz, and Philip E. Wolgin for their assistance in preparing this issue brief.