For the latest facts on immigration today, please see the most recent update of this issue brief here.
Download this issue brief (pdf)
View the brief in your web browser (Scribd)
Below are the latest and most essential facts about immigration in our nation today. The facts are broken down into four sections:
Today’s immigrants
Below are the facts about immigrants today: who they are, where they live, and their impact on the U.S. economy.
Immigrants largely arrive through legal channels
- There were 39.9 million foreign-born people in the United States in 2010.
- 44 percent were naturalized citizens.
- 24 percent were legal permanent residents.
- 29 percent were unauthorized migrants.
- 3 percent were temporary legal residents (such as students or temporary workers).
- 50.9 percent of our nation’s foreign born are women and 54.2 percent of naturalized foreign-born persons are women.
- The foreign-born share of the overall U.S. population is 12.9 percent today, lower than the highest percentage (14.8 percent) achieved in 1890.
Most immigrants have made a home in the United States
- 11.5 million undocumented immigrants were living in the United States in January 2011, an increase of one-third since 2000, when there were 8.5 million undocumented immigrants.
- 86 percent of undocumented immigrants have been living in the United States for seven years or longer.
- 5.2 percent of the U.S. labor force consisted of undocumented immigrants in 2010, even though they comprise only 3.7 percent of the nation’s population.
- 45 percent of unauthorized immigrant households are composed of couples with children. By comparison, the figure for U.S. native households and legal immigrant households is 21 percent and 34 percent, respectively.
- 16.6 million people are in families with at least one undocumented immigrant, and 9 million of these families are of “mixed status” with at least one unauthorized adult and one U.S.-born child.
- 4.5 million U.S.-born children had at least one unauthorized immigrant parent in 2010, an increase from 2.1 million in 2000.
Immigrants have dispersed throughout the United States and even unfriendly laws aren’t making them “self-deport”
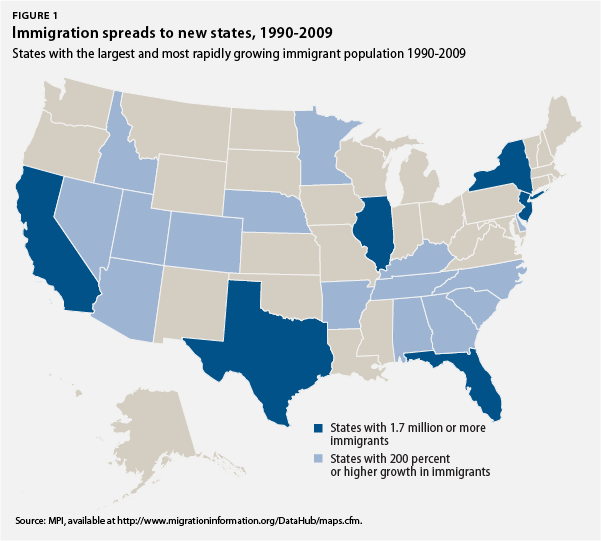
- Undocumented immigrants are increasingly settling throughout the 50 states. Traditional “gateway” states such as California, Illinois, Texas, New York, and Florida continue to be home to large percentages of our nation’s foreign-born. But immigrants are increasingly dispersing to metropolitan areas outside these states. Fifteen states—Alabama, Arkansas, Colorado, Delaware, Georgia, Idaho, Kentucky, Minnesota, Nebraska, Nevada, New Mexico, North Carolina, Tennessee, South Carolina, and Utah—experienced at least a 200 percent increase in their immigrant populations between 1990 and 2009. (see chart above)
- The number of undocumented Mexican nationals arriving to the United States declined by 80 percent between 2004 and 2010. In 2010 fewer than 100,000 Mexican nationals settled in the United States, compared to an annual flow of about 525,000 undocumented persons from Mexico from 2000 to 2004.
- Increased enforcement isn’t encouraging immigrants to return home. Immigration from Mexico is at net zero, with slightly more Mexicans leaving the country than entering it. This decline in immigration can be attributed to tightened border controls, weak job and housing construction markets in the United States, increases in deportations, and declining Mexican birthrates.
- Policies of “self-deportation” do not lead to large-scale resettlement. Immigrants make the decision to stay because most have been in the country for more than a decade, live in families with children, and know that if economic conditions are bad in this country, they are worse in their home countries.
- Immigrants, like other economic actors, are averse to losing their long-term investments. These include investments in homes or their children’s education, for example. Research drawing on cognitive psychology and behavioral economics has shown that this is another reason undocumented immigrants do not leave even in the face of harsh laws.
- Instead of leaving the United States, undocumented immigrants living in anti-immigrant states move to friendlier neighboring states. An abundance of anecdotal evidence stemming from a number of anti-immigrant measures has led researchers to believe that when migrants feel targeted, they resettle elsewhere in the United States.
Immigrants are a net plus for our economy
- $1.5 trillion—The amount of money that would be added to U.S. cumulative gross domestic product over 10 years with a comprehensive immigration reform plan that includes legalization for all undocumented immigrants currently living in the United States.
- $11.2 billion—The amount of money households headed by unauthorized immigrants paid in state and local taxes in 2010.
- $4.5 billion to $5.4 billion—The amount of additional net tax revenue that would accrue to the federal government over three years if all undocumented immigrants currently living in the United States were legalized.
In contrast…
- $2.6 trillion—The amount of money that would evaporate from U.S. cumulative GDP over 10 years if all undocumented immigrants in the country were deported or “self-deport.”
- $285 billion—The cost of removing the entire undocumented population from the United States over a five-year period, including continued border- and interior-enforcement efforts.
- $23,482—The cost of apprehending, detaining, processing, and transporting one individual in deportation proceedings.
Current federal and state immigration policy
The Obama administration has directed an unprecedented amount of resources to ensuring our southern border is secure and undocumented immigrants (criminal and noncriminal) are deported. In June 2012 the Department of Homeland Security announced they would allow DREAM Act-eligible youth to apply for deferred action, granting them protection against deportation and the ability to get work authorization.
Notwithstanding these efforts, in the absence of lasting solutions that fix our broken immigration system, state legislators have passed a wide array of immigration measures, ranging from Arizona’s famous “papers please” measure that has risen to the U.S. Supreme Court, to immigrant-friendly DREAM Act measures.
Our borders are safer than ever
- 81 percent of the U.S.-Mexico border meets one of the top three levels of “operational control” by U.S. enforcement officials. The remaining 19 percent covers the most remote, inaccessible, and inhospitable stretches of the border. And according to 2010 FBI crime reports, there has been a 40 percent decline in violent crime rates in Southwest border states in the last two decades.
- Border Patrol has 100 percent “eyes on the border” in high-density urban areas, meaning that they can view every attempted border crossing in real time.
- Undocumented immigration levels of Mexicans are at net zero. According to the Pew Hispanic Center, 1.4 million Mexicans immigrated to the United States from 2005 to 2010, while approximately 1.4 million Mexicans moved from the United States to Mexico in that same period of time.
Interior and workplace-enforcement tools are on overdrive
- The federal government’s voluntary web-based system that allows employers to verify the work authorization of their employees is used by 4 percent of all businesses in the United States. Some members of Congress are pushing to make E-Verify mandatory for every employer in the country, but a debate exists about the accuracy of the databases and the Congressional Budget Office estimated the program would cost $17.3 billion in revenue over 10 years.
- The federal government has stepped up enforcement against employers who hire undocumented workers through auditing of I-9 forms, the federal paperwork that must be completed by all workers and employers upon hiring. Immigration and Customs Enforcement conducted 2,196 Form I-9 inspections in FY 2010 compared to 1,444 in FY 2009. These inspections led to 196 arrests; $42.9 million in fines, forfeitures, and restitutions; and many undocumented immigrants losing their jobs.
- The Department of Homeland Security’s immigration enforcement program, Secure Communities, has been aggressively expanded under the Obama administration. The Secure Communities program checks the immigration status of immigrants booked into county jails in participating jurisdictions. It is largely thanks to this program that the Obama administration has deported over 1 million people. DHS has expanded the Secure Communities program from 14 jurisdictions in 2008 to over 3,000 in 2012, and will deploy the program to every jurisdiction across the country by 2013. But several states and counties including Washington, D.C., are putting up a fight, arguing the program interferes with local policing priorities and inevitably leads to racial profiling.
- There has been a significant increase in the number of detained noncriminal immigrants. In 2010, 363,064 immigrants were detained, more than twice the 2005 level of detentions. The average cost to detain one person for an average of 30 days is $3,355.
In the absence of federal action, states have filled the legislative gap with their own measures

- Arizona, Utah, Georgia, Indiana, Alabama, and South Carolina have enacted immigration enforcement laws that target undocumented immigrants and increase the authority of local police to enact immigration enforcement policies.
- The U.S. Supreme Court ruled to strike down three parts of Arizona’s S.B. 1070 in June 2012. But the decision left in place Section 2(B) of the law, a dangerous provision that leaves the door open to racial profiling and harassment of people of color in Arizona.
- Though the measures have undoubtedly created a deeply hostile climate for all people of color, citizen or not, in these states there is no evidence that undocumented immigrants have left the United States.
- Arizona’s S.B. 1070 passed in April 2010. Arizona lost $141 million due to conference cancellations and loss of attendees due to backlash to its immigration law. Cost projections from cancellations estimate losses at upwards of about $217 million for the state.
- Georgia’s H.B. 87 was enacted in April 2011. The law has already caused severe labor shortages as workers and their families avoid the unwelcoming state. The state lost an estimated $300 million in unharvested crops with a total possible statewide impact of $1 billion in 2011 alone.
- Alabama’s H.B. 56, the nation’s toughest immigration law, was passed in June 2011. Though a federal court has put a temporary hold on many of the most severe provisions of the law, an Alabama district judge allowed some extreme measures to go into effect in the fall of 2011, causing much damage to the state’s economy, society, and reputation. It’s estimated that the state economy will lose up to $10.8 billion (6.2 percent of its GDP) and up to 140,000 jobs.
- Utah, Indiana, and South Carolina passed anti-immigrant measures in the spring of 2011. The bills signed into law in all three states include Arizona-style enforcement provisions. These laws had been enjoined pending the outcome of the Supreme Court’s decision. The lower courts will now issue new rulings consistent with the Supreme Court’s opinion in the Arizona v. United States case.
- Other states are addressing immigrant communities’ real needs by passing state-level DREAM Acts. State-level DREAM Acts, with some variation, grant access to in-state tuition at public colleges and universities to students who attended a high school in the state for a set number of years, graduated or received an equivalent degree, and meet other criteria, regardless of their immigration status.
- Texas led the way passing the first state DREAM Act in 2001. California, Illinois, Nebraska, New Mexico, New York, Utah, Washington, Kansas, Connecticut, Maryland, and Rhode Island followed.
- State DREAM Acts do not grant permanent residency. Federal inaction limits the impact of state Dream Acts. Despite widespread misconceptions, states do not have the authority to confer immigration status on undocumented immigrants.
- Even these gains are not absolute. Opponents of the Maryland state DREAM Act began a campaign to repeal the bill soon after Gov. Martin O’Malley signed it. Maryland voters will decide in the 2012 elections whether the measure should remain in place and go into effect or not.
Immigration public opinion polling
Public opinion polling has shown that most Americans strongly favor smart and balanced solutions to fix a broken immigration system that is currently failing to serve our core national interests.
Americans reject mass deportation and reward smart and balanced solutions
- Voters overwhelmingly reject mass deportation. Only 19 percent of voters believed that all unauthorized immigrants should be sent back to their home country, according to a December 2011 Fox News poll. A National Journal poll released in the same month found that only 25 percent of voters believed that all unauthorized immigrants should be deported, regardless of length of residency.
- Most Americans believe in a balanced approach. 66 percent of voters believe unauthorized immigrants should be allowed to stay in the country and eventually become citizens after paying back taxes, learning English, and passing a background check according to the December 2011 Fox News poll. And 67 percent support allowing unauthorized immigrants to stay if they have been here for many years and broken no laws, according to the National Journal poll released in December 2011.
- The public at large strongly supports the Obama administration’s decision to grant undocumented youth protection from deportation and work permits. A NBC News/Wall Street Journal poll released in late June 2012 showed that nearly 7 in 10 Americans are in favor of the Obama administration’s new immigration policy toward DREAM-eligible youth. A Bloomberg News poll released just days after the administration’s announcement showed that independents backed the decision by more than a 2-to-1 margin.
- Support for the DREAM Act remains robust among the general electorate. Even in the “show me your papers please” state of Arizona, polling conducted by the Merrill/Morrison Institute release in April 2012 showed that nearly three-quarters of Arizona registered voters support the DREAM Act.
- Americans’ views toward immigration are more positive today than they were in the recent past. A Gallup poll conducted in early June 2012 showed that 66 percent of Americans say that immigration is a “good thing” for the country today. 59 percent said they felt this way about immigrants last year.
Latino electorate strongly supports comprehensive immigration reform
- Latino voters care about immigration reform. Survey respondents in a January 2012 poll conducted by ABC/Latino Decisions/Univision News ranked immigration reform and the DREAM Act as their top priority (46 percent), followed by jobs and unemployment (35 percent), when asked which was the most important issue facing the Latino community. A June 2012 poll conducted by NBC/Telemundo/Wall Street Journal showed that 93 percent of Latinos see immigration as being an important issue to them.
- Latino voters have personal connections to our broken immigration system. 25 percent of surveyed Latino voters in a June 2011 poll by Latino Decisions said they know a person or family who is facing deportation or has been deported. 53 percent said they know someone who is undocumented.
- Support for the Obama administration’s handling of immigration matters is high in the Latino community. A Hispanic oversample in a poll conducted by NBC/Telemundo/Wall Street Journal released in late June 2012 showed that 84 percent of Latinos surveyed knew about the administration’s relief to DREAMers, and 87 percent were in favor of the policy.
- 91 percent of Latinos support the DREAM Act according to a December 2011 poll by the Pew Hispanic Center.
- Latino voters strongly oppose Arizona’s anti-immigrant law, S.B. 1070. In a May 2010 poll conducted by the SEIU, 81 percent of Arizona’s Latino voters opposed S.B. 1070.
- Latino voters reject hateful rhetoric on immigration regardless of a candidate’s other views. According to a November 2011 poll conducted by Latino Decision/Univision News, only 14 percent of Latinos would be more likely to support a candidate whose economic plans they liked but who talked tough on immigration, while 59 percent would be less likely to support that candidate. Conversely, 76 percent would be more likely to support a candidate with an economic plan they support and who had positive things to say about immigrants, while only 6 percent would be less likely.
Demographic and political destiny of Latinos
Latinos are the fastest-growing segment of the electorate as the United States shifts to a majority-minority nation. They will soon make up the majority of new voters in key swing states. Politicians ignore this group at their own peril.
Growing in numbers and in political strength

- Latinos comprise 16.4 percent of the total U.S. population. They are relatively young compared to other Americans, with 62 percent under 44 years old, compared with 46 percent of all Americans.
- Latinos accounted for 55.5 percent of U.S. population growth from 2000 to 2010. This is compared to Asians and African Americans, who accounted for 16 percent and 14 percent of population growth, respectively.
- By 2050 Latinos are expected to make up 24.4 percent of the U.S. population.
- 19.5 million Latinos were eligible to vote in 2008. It is estimated that an additional 2 million Latinos will be eligible to vote in the upcoming presidential elections.
- 6.6 million immigrants naturalized between 2001 and 2010, increasing the importance of the immigrant vote since naturalized citizens can vote.
- In 2010 there were just over 8 million legal permanent residents eligible for naturalization.
- Latinos comprise significant portions of the electorate in key states. Latino Decisions has estimated that Latinos will make up 38 percent of eligible voters in New Mexico, 28 percent in Texas, 24 percent in Arizona, 17 percent in Florida, 14 percent in Nevada, and 13 percent in Colorado in the 2012 election.
- 90 percent of Latinos under age 18 are U.S. citizens and will be eligible to vote once they turn 18. In addition, 50,000 Latino citizens turn 18 every month. That’s compared to the approximately 225,000 non-Hispanic whites that turn 18 every month and 63,000 non-Hispanic blacks that turn 18 every month. We can expect this trend will continue and grow as the proportion of Hispanics to other races increases in the coming years.
- Immigrant women are the drivers of naturalization in their families. Eighty-four percent of the women surveyed in a February 2011 poll by New America Media wanted to become citizens, with 90 percent of female immigrants from Latin American and Arab nations indicating a desire to naturalize.
Download this issue brief (pdf)
View the brief in your web browser (Scribd)
Endnotes can be found in the PDF and Scribd versions.