Introduction and summary
Health care costs ranked among voters’ top concerns in the 2018 midterm elections.1 The federal government estimates that per capita health care expenditures reached $10,739 in 2017 and that costs will continue to grow more than 5.5 percent annually over the next decade.2 Slowing the increase in health care costs will be impossible without reforms to the largest component of health care expenditures: hospital-based care.
Hospitals receive $1 out of every $3 spent on health care,3 and the United States is projected to spend about $1.3 trillion for hospital care alone in 2019.4 Collectively, hospitals boast a margin of 8 percent, a level higher than margins in the pharmacy industry or the insurance industry. Across America’s acute care hospitals, total revenues exceeded expenses by more than $64 billion in 2016, according to a Center for American Progress analysis. Experiences among individual hospitals vary, however, and about one-quarter of both for-profit and not-for-profit hospitals lost money in 2016.
Many hospitals are able to sustain profits and high prices because of their market power, which has grown as competition has dwindled and providers have consolidated through mergers and acquisitions. While the high expenditures in some regions of the country are at least partly explained by local input costs, utilization, or medical practice style, price variation is responsible for most of the geographic variation in expenditures among people with private insurance.5
Commercial insurers are estimated to pay about twice what Medicare does for hospital care. Across all payers, hospitals receive reimbursement averaging about 134 percent of what Medicare pays, according to CAP analysis detailed in this report. High prices do not always indicate better quality; in fact, they often mask inefficiencies in the hospital business.
The first portion of this report examines trends in hospital profits and pricing variation across geographic areas and payers. The second portion describes policy options to rein in the high cost of hospital care. A summary of these recommendations are as follows:
- End abusive hospital billing practices, including surprise billing and excessive charges
- Implement reference pricing to incentivize patients and put pressure on providers
- Implement rate regulation, setting or capping all payers’ rates closer to costs
- Call for more public information on hospital pricing
- Enforce more antitrust measures for the hospital industry
- Impose site neutrality for payments
While most patients do not pay hospitals directly for the full cost of their care, those with private insurance are footing the bill for higher prices through higher insurance premiums and rising deductibles. Taming the overall growth of health care costs requires action to lower the prices Americans pay for hospital care.
Hospital profits are soaring
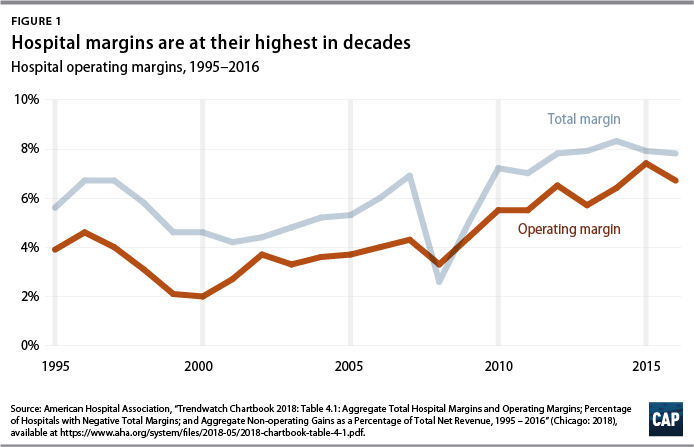
Hospital profitability has risen to its highest levels in decades, boosted by the nation’s rebound from the Great Recession and the Affordable Care Act’s expansion of health coverage.6 A common measure of hospital profitability is the total margin, which is the difference between revenues and expenses relative to revenues, considering all the hospital’s business activity. As of 2016, the total margin across the hospital industry was 7.8 percent. The industry’s operating margin—which measures the expenses and revenues that are directly associated with patient care—was 6.7 percent.7 (see Figure 1)
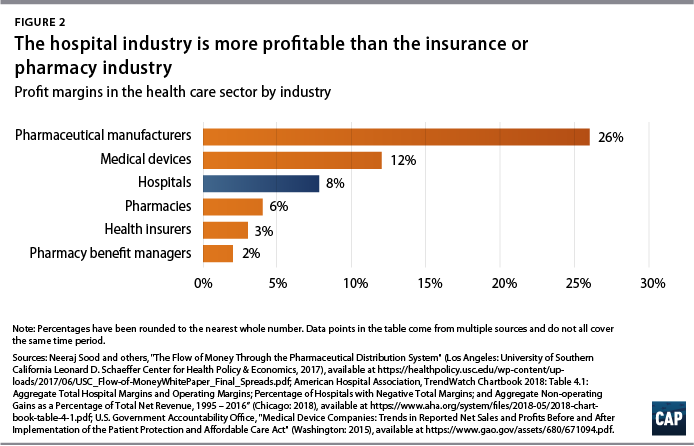
To place hospitals’ total percent margin in perspective, acute care hospitals are more profitable than many other industries in the health care sector. Hospitals rank well above health insurers, pharmacies, and pharmacy benefit managers, though hospital margins are still below profit estimates for the medical device and drug manufacturing industry. (see Figure 2)
Some notable trends in the hospital industry have occurred alongside the growth in profits. First, hospitals have shifted their growth strategy to expanded outpatient services.8 Inpatient care now makes up slightly more than half, or 52 percent, of hospital revenue, compared with about 70 percent in 1995.9 Through acquisition of physician practices, hospitals now offer a wider array of services through their outpatient departments.
Second, with scores of hospital mergers occurring each year,10 competition continues to dwindle. The market for health care providers is growing increasingly consolidated, resulting in higher prices for patients. Hospitals systems are growing more powerful, and indidivudal hospitals are also increasingly likely to belong to a multiprovider health system rather than operating independently.11 Consolidation with physicians enables hospital systems to compete with nonhospital-based practices while qualifying for the federal program for outpatient drugs discounts and the higher Medicare reimbursement rates that the Centers for Medicare and Medicaid Services (CMS) pay to hospitals.12 This is worrying news for the overall rise in American health care costs—and for American patients who pay the price.13
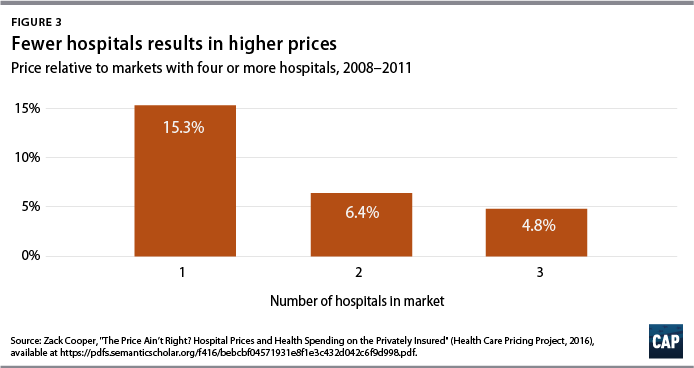
Research by Yale economist Zack Cooper and his team of researchers has demonstrated that greater hospital market concentration leads to higher costs for patients. Compared with regions served by four or more competing hospitals, regions with three hospitals have prices that are 5 percent higher; those with two hospitals have prices that are 6 percent higher; and those with a single hospital have prices that are 15 percent higher.14 (see Figure 3)
Northern California is among the markets that is dominated by a small number of powerful health systems. For example, Sutter Health has a sprawling network that comprises 24 hospitals, 35 outpatient centers, and 5,500 member physicians. A suit by the California attorney general alleges that prices in Northern California have risen faster than those in Southern California because Sutter Health engages in anticompetitive business practices, including abusing its bargaining position in negotiations with insurers.15 Price index data from the independent Health Care Cost Institute show that relative to the national median, health care prices in San Francisco are 64 percent higher, and those in San Jose, California, are 82 percent higher.16
A recent Health Affairs study lays bare that hospital facilities themselves, rather than the physicians who staff them, are the primary driver of rising hospital costs.17 From 2007 to 2014, inpatient hospital prices grew twice as fast (42 percent increase over the period) as physician prices (18 percent increase over the period). For outpatient services, hospital prices rose more than four times faster than physician prices—25 percent and 6 percent increases, respectively.
Hospital profits in 2016
To take a closer look at hospitals’ profitability, CAP analyzed public financial data from hospitals around the nation. All Medicare-certified hospitals are required to file annual reports to the Healthcare Cost Report Information System (HCRIS) of the CMS. The cost report data include information about hospitals’ ownership type, revenues, costs, and size.
CAP limited its analysis to the 3,062 nonfederal, acute care hospitals with valid data for 2016. Among these, 26 percent are for-profit, 61 percent are nonprofit, and 13 percent are public. (see Table 1) The Appendix at the end of this report contains details on the hospital sample used in this analysis.
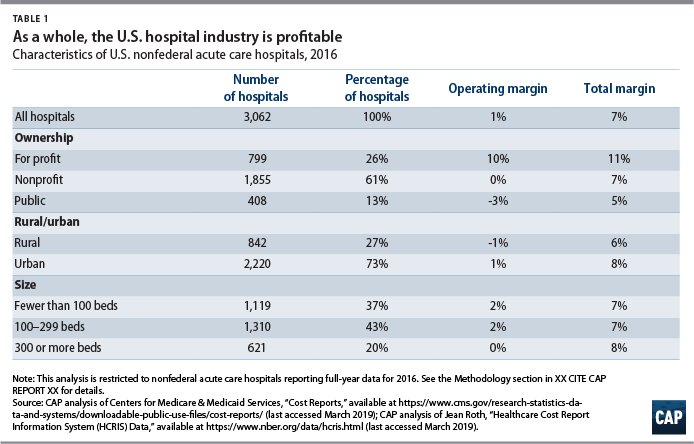
Operating margins—a measure of revenues and expenses directly associated with patient care—were 1 percent across the hospitals in CAP’s sample. Operating margins were lower than total margins for all three categories of hospital ownership in 2016: 10 percent for for-profit hospitals, zero percent for nonprofit hospitals, and negative 3 percent for public hospitals. Hospitals in rural areas had slightly lower total margins than those in urban areas, at 6 percent and 8 percent, respectively.
If revenues and expenses beyond patient care are also included,18 then the hospitals’ total profit margin in 2016 was 7 percent. There is wide variation in profitability among individual hospitals. Grouped by ownership type, for-profit hospitals had the highest total margin, at 11 percent. Total margins were lower among nonprofit hospitals (7 percent) and public hospitals (5 percent). Roughly one-quarter, or 27 percent, of hospitals lost money in in 2016, with public hospitals most likely to experience losses, at 40 percent. Total margins were negative for 26 percent of for-profit hospitals and 25 percent of nonprofit hospitals.
Total profit among the hospitals in CAP’s sample was $63.6 billion in 2016. That amount suggests that stronger rate regulation could save Americans tens of billions of dollars on hospital expenditures, even if rates were tailored to keep afloat loss-making hospitals that are crucial to patient access.
Determinants of hospital prices
Prices depend on where you live
Geographic variation in health care expenditures is well documented. Per capita health care expenditures in high-spending regions of the United States are about 40 percent higher than those in lower-spending regions.19 The variation spending among Medicare beneficiaries is largely driven by differences in utilization rather than in prices because reimbursement rates are set by the federal government, with some adjustment for regional costs.
Among the privately insured population, for whom reimbursement rates are negotiated between insurers and providers, prices play a much larger role in spending variation. A 2013 study by the National Academy of Medicine, formerly the Institute of Medicine, concluded that: “Variation in spending in the commercial insurance market is due mainly to differences in price markups by providers rather than to differences in the utilization of health care services.” Regions with high spending tend to be those where providers have market power.20
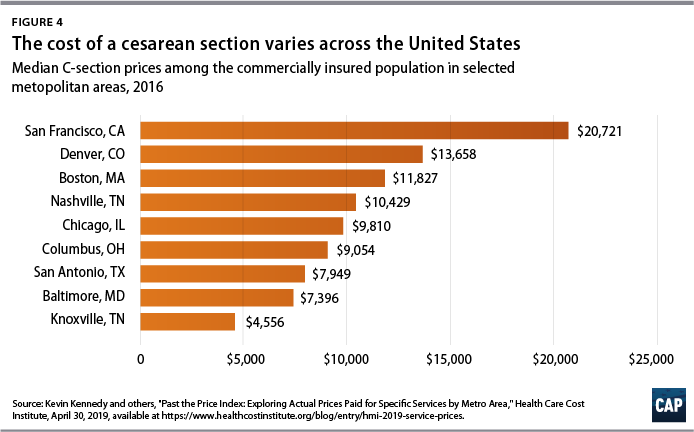
Pricing data for employer-sponsored plans show wide geographic variation in what hospitals are paid for care. Analyses of commercial claims from the Heath Care Cost Institute demonstrate the huge range of the price of care both within and across metropolitan areas.21 For example, the median price for a birth via a cesarean section delivery ranged from a low of $3,636 in metropolitan Knoxville, Tennessee, to a high of $20,721 in the San Francisco area. (see Figure 4)
Insured patients typically pay only a fraction of their hospital bills out of pocket, in the form of coinsurance or copayments, and most patients may not be aware of their hospitals’ total charges. Nevertheless, the cost of high-priced care is passed on to consumers through health insurance premiums. The hospital markets with the least competition have health insurance marketplace premiums that are 5 percent higher than the average, a recent Health Affairs study found.22
Prices depend on who is paying
There is a wide and growing gap between public and private rates. Although patients with private insurance account for one-third of hospital costs,23 they are the source of most hospitals’ profit. Private insurance rates for hospital services are well above hospitals’ cost of providing care.
Although public and private reimbursement rates have indisputably diverged over time,24 precise payment ratios depend on how supplemental governmental payments to hospitals are counted. According to the nonpartisan Medicaid and CHIP Payment and Access Commission, Medicaid reimbursement levels are generally higher than those of Medicare if supplemental payments are counted toward Medicaid payments.25 A report by the Kaiser Family Foundation came to a similar conclusion. Without considering disproportionate share (DSH) payments to hospitals serving indigent populations, hospitals are reimbursed 93 percent of cost for Medicaid patients. If DSH payments are included, Medicaid payments are 107 percent of cost.26
Some recent studies have documented that private payment rates are much higher than of Medicare. Congressional Budget Office researchers estimated that the price of an inpatient stay was on average 189 percent of the Medicare rate in 2013.27 Most recently, a RAND Corporation study found that employer-sponsored plans pay hospitals 241 percent of Medicare levels on average for inpatient and outpatient care, with some hospital systems receiving as little as 150 percent and as much as 400 percent of Medicare rates.28 And a report on California hospitals found similar results, with private insurers paying 209 percent of Medicare rates.29
Another commonly cited metric of hospital profitability is the payment-to-cost ratio, which represents average payment relative to average cost by payer, accounting for both patient-specific clinical costs and fixed costs such as equipment, buildings, or administrators’ salaries. According to the American Hospital Association (AHA), private insurance payments average 144.8 percent of cost, while payments from Medicaid and Medicare are 88.1 and 86.8 percent of cost, respectively.30
A separate but related question is how payment rates relate to marginal costs: If a hospital has an empty bed, can it expect to make or lose money by filling it with an additional patient? When rates are too low relative to the incremental cost of serving that patient, then hospitals have financial incentive to turn the patient away. Studies suggest that Medicare reimbursements are well above incremental cost. The Medicare Payment Advisory Commission (MedPAC) notes in its March 2019 report to Congress that Medicare payments exceed the marginal cost of caring for Medicare patients by 8 percent.31
However, because the degree to which hospitals manage their costs is a part of their business strategy, margins and payment-to-cost ratios may in fact understate the hospital industry’s profitability.32 A hospital’s costs—the denominator in the payment-to-cost ratio—are a combination of external factors such as the local costs for wages or utilities and the hospital’s own behavior, including how efficiently it manages its resources.
A persistent argument in the debate over hospital payment is that hospitals engage in cost-shifting, raising prices on private payers to compensate for insufficient payment from public programs. There is scant evidence that hospitals have the ability to cost-shift and much stronger empirical evidence that high prices for private payers result from hospitals’ market power.33 An alternative explanation for the gap between public and private hospital rates is that hospitals that can demand high prices from private payers enjoy a bigger financial cushion and face less pressure to contain costs, which in turn makes Medicare and Medicaid payments look relatively low by comparison.34
In support of the latter theory, a 2019 MedPAC analysis found that hospitals that face greater price pressure have lower costs. Relatively efficient hospitals, which MedPAC identified by cost and quality criteria, had higher total margins (8 percent) than less efficient hospitals (5 percent).35 In other words, while it may be true that higher-priced hospitals have higher costs, such high-price hospitals also tend to operate inefficiently.
Hospitals’ healthy bottom line
Given the disparity between the public and private reimbursement levels, the average payment a hospital receives depends on its payer mix. According to the AHA, 40.8 percent of hospital costs are attributable to Medicare, 33.4 percent to private payers, 18.5 percent to Medicaid, and 4.2 to uncompensated care.36 Together, these four payer categories are associated with 96.9 percent of hospital costs; the remainder of costs are associated with other government payers and nonpatient costs.
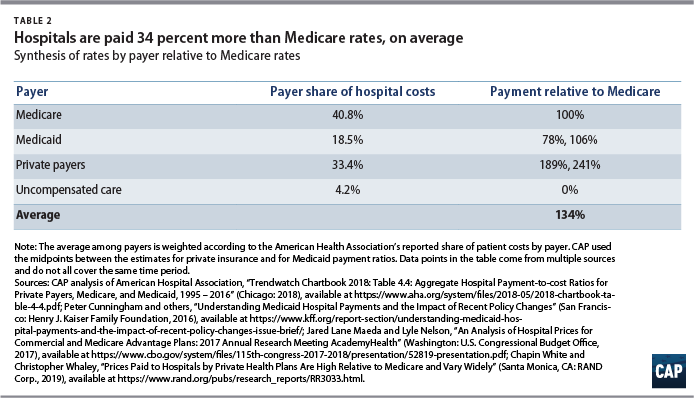
A number of studies have reported hospital reimbursements by payer relative to Medicare levels;37 the results are synthesized in Table 2. Combining the AHA-reported payer mix with published estimates of rates relative to Medicare, CAP estimates that hospitals receive approximately 134 percent of Medicare rates across their main payers.
Payment reforms could achieve even greater savings if hospitals that currently lack competition were pressured to operate more efficiently and lower their costs. Current Medicare rates are designed to cover the costs that “reasonably efficient providers would incur in furnishing high-quality care.”38 This suggests that on average, hospitals are receiving payments that are well above what is needed to cover costs under efficient operation. Given that hospitals currently enjoy an 8 percent margin, average reimbursement across the major payers could be reduced down to 124 percent of Medicare rates while still enabling the industry as a whole to cover its current costs.
Policies to reduce the cost of hospital care
Several policy options could bring down hospital costs, many of which have already been implemented at the federal or state level, bringing down prices and slowing the growth of hospital expenditures. Hospital payment rates could be brought down directly through all-payer rate setting, reference pricing, or regulations to cap rates. Federal policies to improve competition in hospital markets—including stronger antitrust enforcement, fairer payment rules, and greater transparency—could also bring down prices and tame the growth of American hospital costs.
Ending abusive hospital billing practices
At a minimum, congressional and state legislators should act to stop the one of the most egregious billing practices associated with hospital care: surprise billing. Surprise bills typically come from out-of-network physicians working in an in-network facility and can also arise from emergency situations in which patients cannot be expected to locate an in-network provider, such as when suffering trauma from a bike accident or after being dropped off by an air ambulance.39
More than a dozen states have already passed legislation to protect patients from surprise bills.40 Bipartisan bills proposed in the U.S. House of Representatives and U.S. Senate within the past few months provide promising options for relief from surprise bills.41 To bring down the overall cost of hospital-based care, laws aimed at curbing the practice ought to not only provide protection to the patients who would be billed for excessive charges but also prevent providers from charging insurers rates that are far beyond the norm.
Reference pricing
Short of broad-based government action on hospital rates, individual payers can take steps to cut the cost of hospital care through reforms such as reference pricing. Under reference pricing, a payer sets the maximum it will pay for a service or bundle of services, which could be tied to a percentile in commercial claims or to Medicare rates. Providers that decline to accept the reference price are either excluded from the payer’s network, or patients who choose that provider take responsibility for paying the difference out of pocket. Reference pricing incentivizes patients to visit lower-cost providers and puts pressure on providers to lower costs in order to keep their business.
Several states have implemented forms of reference pricing for public plans. The California Public Employees’ Retirement System was among the first payers to adopt reference pricing for a limited set of scheduled procedures, including cataract surgery and joint replacements.42 Montana took a broader approach for its state employee plan by setting a reference price for all hospital services that average 234 percent of Medicare rates.43 In Oregon, the state legislature passed a bill to set provider reimbursements for the state employee plans at 200 percent of Medicare.44 And in Washington state, a new public option to be offered through the state’s health insurance marketplace will cap aggregate provider payments at 160 percent of what Medicare pays.45
Rate regulation
The most direct way for state or federal regulators to lower hospital prices would be to simply set reimbursement rates or cap them. By setting or capping all payers’ rates closer to costs, state or federal regulators could bring down current hospital prices while also slowing price inflation. For example, former Obama administration officials Robert Kocher and Donald M. Berwick suggest capping hospital prices at 120 percent of current Medicare rates.46 Others have suggested 125 percent of Medicare rates as a starting point.47
Even with rates set to hit close to the current average and to allow efficient hospitals to earn some profit, rate regulation could generate savings by simplifying hospital administration and eliminate the need for rate negotiations between hospitals and payers.48 Alternatively, assuming hospitals could cut costs by operating more efficiently, all-payer rates could be set below current levels to capture further savings.
Using AHA data, Stanford University researchers Kevin A. Schulman and Arnold Milstein calculated that reimbursing all hospital care at Medicare rates—as proposed in Sen. Bernie Sanders’ (I-VT) Medicare for All bill—would reduce total payments by 15.9 percent, or $151 billion among hospitals nationwide.49 However, while hospitals and physicians could respond to rate cuts by reducing costs—for example, by improving efficiency—they may also attempt to make up for lost revenue. Faced with changes to prices alone, hospitals might increase the volume of services or shift their business toward higher-margin, lower-value services.
Rate regulation is most effective when combined with other payment reforms. Global budgeting can tame overall hospital costs by limiting the total amount spent on services rather than just the price at which care is provided. One of the most successful examples of state rate reform took place in Maryland, which has used all-payer rate-setting to regulate cost growth since the 1970s and, more recently, adopted global budgets for hospitals.50
Regardless of the regulatory mechanism, lower payment levels present a trade-off between cost-savings and patient access. Any rate-setting proposal should consider the financial sustainability of providers which is crucial to patient access, particularly those providers with already-low margins or located in rural areas, as well as the pace at which hospitals would be expected to adapt to major payment reforms.
Hospital price transparency
One popular response to the opacity and variation in hospital pricing has been to call for more public information on pricing. Price transparency can be most helpful to insurers and employers that desire to direct patients toward lower-cost care. Transparency has limited value for patients. First, much of hospital care isn’t shoppable: A patient can’t price-compare emergency rooms after a bike accident or switch to a lower-priced anesthesiologist in the middle of surgery. Second, the salient price for the patient is not the insurer’s negotiated charge but the out-of-pocket cost, which is a percentage of charges or a flat amount.
In 2018, the CMS began enforcing the Affordable Care Act provision requiring each hospital to post its list prices online. The price lists, known as chargemasters, typically name services using billing code jargon rather than plain English descriptions,51 and the information is neither standardized nor centralized, making side-by-side comparisons difficult.52 Another limitation of publishing price information is that chargemasters bear only a loose relationship to the negotiated rates that insurers actually pay.53 The Trump administration is considering forcing hospitals to disclose the rates they negotiate for providers, medical devices, and drugs—information providers generally consider proprietary.54
More antitrust enforcement for the hospital industry
The growing market power of hospitals and large physician practice groups warrants greater antitrust enforcement to protect consumers and competition. For too long, hospital mergers that harm competition and raise prices have been allowed to slip through.55 While mergers between hospitals in close proximity have the greatest effect on prices,56 economic research shows that cross-market mergers can also result in higher hospital prices by weakening insurers’ bargaining power.57 Given the wealth of evidence that market power raises hospital costs without commensurate improvements in care quality, antitrust authorities should set a higher bar for hospital mergers and monitor health systems’ anti-competitive conduct. The Federal Trade Commission and the U.S. Department of Justice need greater resources in order to monitor the large volume of mergers in the health care industry.58
Site-neutral payments
Medicare payment rules have generally paid higher rates for a service when delivered by a hospital than in another setting. In some cases, this means that Medicare is currently paying too much for services that could safely and effectively be performed by other providers or facilities. In addition, the differential between hospital and nonhospital rates financially incentivizes hospital systems to acquire physician practices, thereby leading to greater consolidation among providers. Medicare payments for procedures that can be safely performed in nonhospital settings such as ambulatory surgery centers or physician offices should not stack the deck in favor of hospitals.
The CMS has already altered its payment rules to impose site neutrality for payments to ambulatory care centers and hospital outpatient services, which is expected to save $760 million in 2019.59 Expanding site neutrality policies to level payments across additional settings60 such as between physician offices and hospitals outpatient departments, where clinically appropriate, would benefit taxpayers and Medicare beneficiaries alike.
Conclusion
The variation in hospital prices across markets, across payers, and over time demonstrates that many Americans are paying more than needed for hospital care. The industry overall remains highly profitable and, after decades of rapid consolidation, exercises tremendous power over payers in many markets. The rise in hospital prices, in turn, continues to drive up premiums and cost-sharing for patients, hitting individuals who have commercial insurance the hardest.
Serious efforts to control health care costs will require addressing the largest sources of U.S. health expenditures. Hospital payment reform is needed to lower costs and improve equity among patients and among payers.
About the author
Emily Gee is the health economist of Health Policy at the Center for American Progress. Prior to that, she worked at U.S. Department of Health and Human Services and at the Council of Economic Advisers at the White House. She holds a Ph.D. in economics from Boston University.
Acknowledgments
This publication was made possible in part by a grant from the Peter G. Peterson Foundation. The statements and the views expressed are solely the responsibility of the Center for American Progress.
Appendix: Methodology
The Healthcare Cost Report Information System (HCRIS) data analysis in this report has been restricted to a sample of nonfederal, acute care hospitals, a subset of all hospitals included in the HCRIS. Data are for fiscal year 2016, the most recent year for which the CMS has a nearly complete set of hospital cost filings. The CMS audits only a small portion of the HCRIS reports for data related to hospital financing, and thus many data fields in the cost reports contain unreasonable values and other errors. CAP downloaded HCRIS datasets formatted for Stata statistical software from the National Bureau of Economic Research61 and supplemented those data with additional variables from the original HCRIS files available from the CMS.
Although hospitals are required to file cost reports annually, some reports contain more or less than 12 months of data. The analysis is restricted to hospitals filing reports covering 10 months to 14 months of data, a “full-year” definition suggested by the CMS for the purposes of analysis.62 This analysis also excludes hospitals with total margins above 50 percent or below negative 50 percent, values that likely resulted from erroneous data. After exclusions, CAP’s analytic sample comprises 3,062 hospitals.