A moment of truth has arrived for the House-passed bill to repeal the Affordable Care Act (ACA). The Congressional Budget Office (CBO) has released its score showing that the bill would eliminate coverage for 14 million Americans next year and for 23 million by 2026. The CBO projects that the bill would destabilize insurance markets; slash Medicaid funding by $834 billion over the next decade; make individual coverage exceedingly expensive for older Americans and people with pre-existing conditions; and increase average premiums by 20 percent next year.
House Republican leaders rushed to hold the vote on the bill before a CBO score became available, perhaps knowing full well that the nonpartisan agency’s findings could undercut their claims that it would lower premiums while protecting people with pre-existing conditions. In early May, a majority of the House opted to “walk the plank” and support the bill rather than wait to make an informed decision.
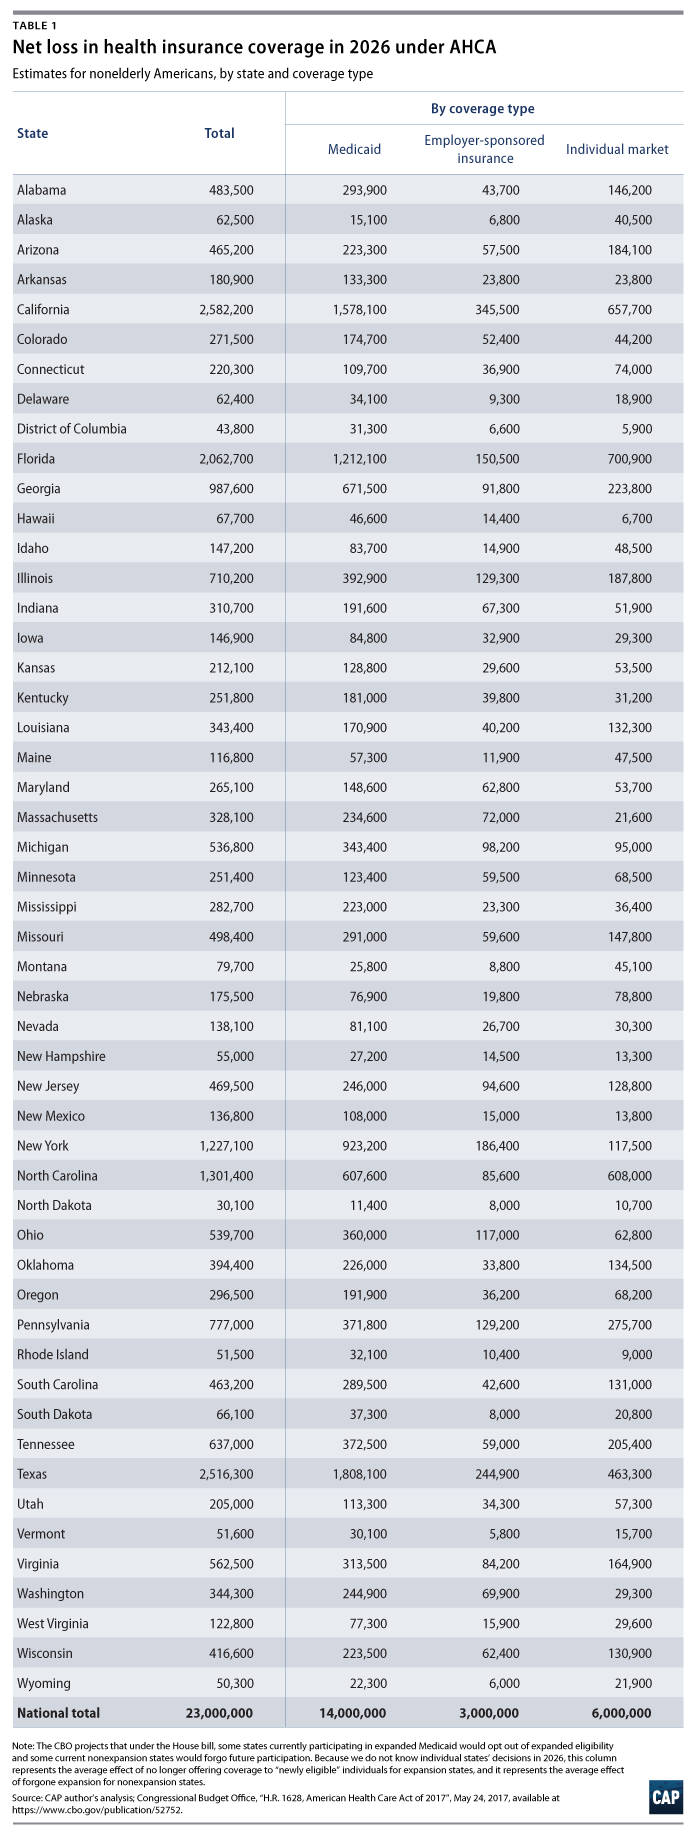
The Center for American Progress has estimated how many Americans would lose coverage by state and congressional district based on the CBO’s projections. By 2026, on average, about 53,000 fewer people will have coverage in each congressional district. Table 1 provides estimates by state, and a spreadsheet of estimates by state and district can be downloaded below.
The coverage losses under the American Health Care Act (AHCA) would be concentrated in the Medicaid program, but the level of private coverage would also drop compared to the current law. The CBO projects that, by 2026, there will be 14 million fewer people with Medicaid coverage, 3 million fewer with employer-sponsored coverage, and 6 million fewer with individual market coverage. Our Medicaid numbers reflect that states that have expanded their programs under the ACA would see federal funding drop sharply starting in 2020 and that the bill would discourage expansion among states that would otherwise have done so in the future.
The bill, as passed, included an amendment that would have allowed states to waive two major consumer protections in the individual market: the prohibition against setting premiums based on health status and the requirement that plans cover basic benefits. The CBO predicts that some states would seek waivers for one or both of those measures, though it does not specify which states.
Accordingly, we did not impose any assumptions about which states would receive waivers in our estimates. Even though the demographic composition of coverage losses would differ among waiver and nonwaiver states, we assume that all states’ individual markets would shrink. The CBO says that, in waiver states, “the increase in nongroup coverage for healthy people and the decrease in coverage for less healthy people would result in an overall decrease in nongroup coverage.”
Pre-existing condition protections would be destroyed
Protections for people with pre-existing conditions would be undermined by last-minute changes to the bill to allow insurers in the individual market to waive requirements for community rating and essential health benefits. Multiple experts had warned well before the House vote that the changes would make it easy for states to waive these protections, thereby imposing health-based rating upon everyone in the market and subjecting people with pre-existing conditions to financial peril.
The CBO score describes at length such scenarios under the AHCA. About half of Americans would live in states that waived at least one of these two consumer protections if the bill becomes law. In states that eliminated federal essential health benefits, people would face “substantial increases” in out-of-pocket spending for basic benefits covered under the ACA. The CBO says enrollees would face additional costs in the “thousands of dollars in a given year” for services such as maternity or mental health.
A secondary, yet equally grave consequence of essential health benefit waivers would be that “the ACA’s ban on annual and lifetime limits on covered benefits would no longer apply to benefits not defined as essential in a state.”
For the millions of Americans with pre-existing conditions, however, the worst scenario would materialize in states that waived both of these crucial consumer protections. The CBO projects that “people who are less healthy (including those with preexisting or newly acquired medical conditions) would ultimately be unable to purchase comprehensive nongroup health insurance at premiums comparable to those under current law, if they could purchase it at all.”
The market would simply unravel in those states. One in every six Americans, the CBO says, lives in an area “in which the nongroup market would start to become unstable beginning in 2020”—just three years from now. The CBO found that the bill’s $8 billion risk mitigation fund, intended to assuage concerns among people with pre-existing conditions, would fall short of solving the problem. Consistent with a CAP analysis before the vote, the agency said such federal funds would “not be sufficient to substantially reduce the large increases in premiums for high-cost enrollees.”
Consumers would be paying more while getting less
The CBO score demonstrates that the bill would increase health costs for many Americans insured through the individual market. While the bill’s proponents have cherry-picked the CBO’s finding that the average individual market premiums would decline relative to current law by 2026, they are taking that finding out of context. First, the relatively low average premium reflects the diminished quality of coverage under AHCA. In states that waive federal essential health benefit requirements, the CBO explains, “insurance policies would provide fewer benefits” and consumers would pay more out of pocket.
Second, the CBO makes clear that the average premium results from younger and healthier individuals buying coverage. The flip side of this is that premiums would spike for older Americans, to the point where many could be priced out of the market.
Under the AHCA, the premiums would rise astronomically for the near-elderly. The CBO projects that in a state that waived just some of the ACA’s remaining coverage protections, the annual premium after tax credits for a middle-income 64-year-old would be $13,600—800 percent greater than it would be under the ACA. In a state that retained those protections, she would owe $16,100 for coverage in 2026 under the House-passed bill. By contrast, the CBO predicts such an individual would pay a mere $1,700 annually for coverage in 2026 under current law.
Medicaid enrollees would also see the value of their coverage hollowed out due to the AHCA. The score contained relatively little discussion of the AHCA’s consequences for Medicaid, given that the House-passed bill’s treatment of the program was largely similar to that in an earlier version of the bill. The CBO did show, however, that the bill would take $834 billion in federal funding from the Medicaid program over 10 years. The CBO’s projected reductions in Medicaid coverage over the next decade imply that, in any given year, roughly 1.1 million fewer people would have coverage for every $10 billion cut from the program.
The bill restructures federal funding for the program in the form of a per capita cap, which would cut federal funding to states to cover low-income adults, children, seniors, and disabled individuals. States unable to make up the lost funding would then be forced to reduce enrollment, raise enrollees’ share of costs, or limit eligibility and benefits.
Conclusion
The CBO’s score delivers the message the bill’s architects tried to bury: the AHCA would harm Americans by rolling back health insurance coverage while raising costs and reducing benefits. It is a damning indictment of congressional Republicans’ and President Donald Trump’s reassurances that the bill guarantees protection for people with pre-existing conditions.
Some House members have already expressed contrition or confessed to not reading the bill, but it is too late. They already cast their votes to take coverage away from 23 million Americans.
Emily Gee is a health economist at the Center for American Progress.
To download the table by congressional district, click here.
Appendix: Methodology
Our estimates of coverage reductions follow the same methodology we used for a previous version of the bill. We combine the CBO’s projected national net effects of the House-passed bill on coverage with state and local data from the Kaiser Family Foundation, the American Community Survey from the U.S. Census, and administrative data from the Centers for Medicare & Medicaid Services, or CMS.
Florida, North Carolina, and Virginia redrew their district boundaries prior to the 2016 elections. While the rest of our data uses Census estimates corresponding to congressional districts for the 114th Congress, we instead used county-level data from the 2015 5-year American Community Survey to determine the geographic distribution of the population by insurance type in these three states. We matched county data to congressional districts for the 115th Congress using a geographic crosswalk file provided by the Kaiser Family Foundation.
Our calculation of reductions in employer-sponsored insurance were most straightforward. The CBO projects a net 3 million fewer people will obtain insurance through the workplace in 2026, and we assigned each district a share proportional to its number of nonelderly people with employer-sponsored coverage in the 2015 American Community Survey.
Estimating reductions in Medicaid by district required more assumptions. In its first score of the AHCA, CBO projected that a total 14 million fewer people would have Medicaid coverage by 2026 under the House bill: 5 million fewer would be covered by additional Medicaid expansion in new states, and 9 million fewer would have Medicaid coverage in current expansion states and among pre-ACA eligibility groups in all states. The CBO projected that, under the ACA, additional Medicaid expansion would increase the proportion of the newly eligible population residing in expansion states from 50 percent to 80 percent by 2026. It projected that, under the House bill, just 30 percent of the newly eligible population would be in expansion states. Extrapolating from the CBO’s numbers, we estimate the bill results in a Medicaid coverage reduction of 3.3 million enrollees in current expansion states by 2026.
We then assume the remaining 5.7 million people who would lose Medicaid coverage are from the program’s pre-ACA eligibility categories: low-income adults, low-income children, the aged, and disabled individuals. We used enrollment tables published by MACPAC to determine total state enrollment and each eligibility category’s share of the total, and we assumed that only some of the disabled were nonelderly. We then divided state totals among districts according to each’s Medicaid enrollment in the American Community Survey. Because each of the major nonexpansion categories is subject to per capita caps under the bill, we reduced enrollment in all by the same percentage.
Because we do not know which individual states would participate in Medicaid expansion in 2026 in either scenario, our corrected estimates give nonexpansion states the average effect of forgone expansion and all expansion states the average effect of rolling back eligibility. We divided the 5 million enrollment reduction due to forgone expansion among nonexpansion states’ districts proportionally by the number of low-income uninsured. We made each expansion state’s share of that 3.3 million proportional to its Medicaid expansion enrollment in its most recent CMS report and then allocated state totals to districts proportional to the increase in nonelderly adult enrollment between 2013 and 2015. For Louisiana, which recently expanded Medicaid, we took our statewide total from state data and allocated to districts by the number of low-income uninsured adults.
Medicaid covers seniors who qualify as aged or disabled. Although the CBO did not specify the Medicaid coverage reduction that would occur among seniors under per capita caps, applying to elderly enrollees the same percentage reduction we calculated for nonexpansion Medicaid enrollees implies that 900,000 could lose Medicaid.
Lastly, our estimates of the reduction in exchange, the Basic Health Plan, and other nongroup coverage are proportional to the Kaiser Family Foundation’s estimates of exchange enrollment by congressional district. The House bill reduces enrollment in nongroup coverage, including the exchanges, by 6 million relative to the ACA. To apportion this coverage loss among congressional districts, we assumed that the coverage losses would be largest in areas with higher ACA exchange enrollment and in states where we estimated the average cost per enrollee would increase most under an earlier version of the AHCA.
The CBO projects that among people with “other coverage” types, the net reduction in coverage would be between zero and 500,000 people in any year. We did not include this category in our estimates.