In June 2009, shortly after President Barack Obama took office, he was presented with a long-term budget outlook that showed skyrocketing costs for Medicare. These budget estimates came from the Congressional Budget Office, or CBO, which said that rising Medicare costs were among the largest drivers of a growing national debt over the long term. Slowing the growth of Medicare spending—and health care costs more broadly—was a major goal of the Affordable Care Act, or ACA, which President Obama signed into law in 2010. Since then, health care cost growth has stayed remarkably low, and the CBO’s projections of Medicare spending have fallen dramatically. Medicare’s fiscal future will be greatly improved in the long-term budget outlook that lands on the next president’s desk.
![]()

Over the next 10 years—from 2017 through 2026—the CBO projects that Medicare will spend approximately $2 trillion less than the amount it originally projected in 2009. (See Methodology section below) The projected savings increases in later years, since Medicare costs are now expected to grow more slowly than before. This is known as bending the cost curve. Figure 1 illustrates the CBO’s Medicare spending projections as a share of gross domestic product, or GDP, from 2009 through 2046 and also shows the savings in dollar terms from 2017 through 2026.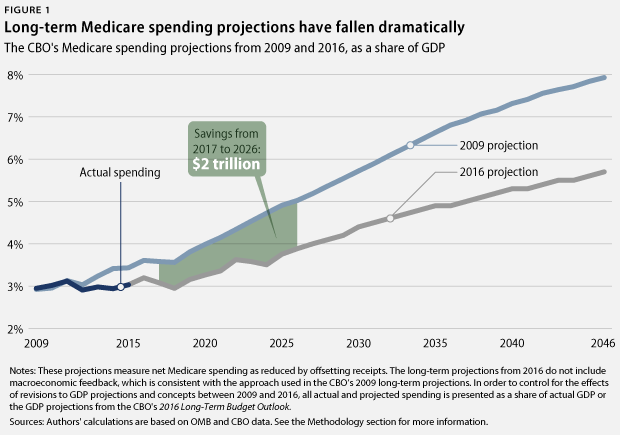 Although there is no way to know if this trend will continue, this is a very promising development. Even the lower Medicare projections in the CBO’s new outlook still expect that health care cost growth will increase somewhat from the current low rate. If health care costs continue to grow very slowly, the CBO’s current long-term projections for Medicare spending and the overall national debt will be substantially lower.
There are several possible reasons for the changes in Medicare cost projections, including the reforms implemented through the ACA. The cost-saving benefits from some of these reforms were reflected in the CBO’s official cost estimate for the bill—just as higher Medicare costs are reflected in the CBO’s estimate for ACA repeal—and these savings are now reflected in the updated budget outlook. Six years after the ACA’s passage, the law’s penalties for hospital readmissions, payment reforms to focus on the quality of care instead of just quantity, and improvements in primary care are all showing promising early results.
While the Great Recession also affected overall trends in health spending, a new study by staff members at the Federal Reserve Bank of New York finds that health care costs actually grew faster in American counties that suffered more during the 2008 financial crisis, perhaps in part because economic stress led to health problems that drove up medical spending. This suggests that health care cost growth has “slowed down in spite of the crisis, not because of it.”
See also
While some commentators claim that Medicare spending is on autopilot because it is not controlled by annual appropriations, the huge improvements in the CBO outlook show that nothing could be further from the truth. In addition to the ACA, Congress passed new Medicare reforms in 2015. Looking ahead, the Center for Medicare and Medicaid Innovation—established by the ACA—will test new reforms to improve health care systems. And if health care cost growth accelerates, the ACA’s Independent Payment Advisory Board will be empowered to recommend additional reforms to lower costs, which will be implemented unless lawmakers pass legislation to supersede them.
This does not mean that it is time to declare “mission accomplished” on health care. But the huge reductions in Medicare projections show that there is no need to turn Medicare into a voucher program—as proposed by Speaker of the U.S. House of Representatives Paul Ryan (R-WI)—in the name of entitlement reform or fiscal responsibility. The Center for American Progress has proposed many new ideas to make the health care system even more efficient and effective, including expanding the use of bundled payments to replace fee-for-service payments; coordinating statewide health systems using an Accountable Care States model; and preventing mergers that reduce competition in the health care sector. While the ACA has reduced the percentage of Americans without health insurance to historic lows, more needs to be done in order to ensure that all Americans have access to high-quality, affordable health care.
As President Obama prepares to leave office, successful Medicare reform will be an important piece of his legacy.
See also
Methodology
The CBO projections used in this analysis measure net Medicare spending, which is reduced by offsetting receipts such as premiums paid by beneficiaries. Actual spending for Medicare from 2009 to 2015 comes from the Office of Management and Budget. For the 2009 projections, the CBO 10-year outlook published in March of that same year provides Medicare projections in nominal dollars for fiscal years 2009 to 2019. The CBO’s June 2009 “The Long-Term Budget Outlook” extends these projections into later years but only presents Medicare spending as a share of GDP.
To convert CBO’s 2009 long-term Medicare projections into nominal dollars, the authors multiplied the figures for Medicare as a share of GDP by the CBO’s 2009 projections for nominal GDP. The CBO’s 2009 long-term budget outlook, however, only includes projections for real GDP. To derive the CBO’s nominal GDP estimates, the authors inflated the CBO’s published estimates for real GDP using a GDP price index. This index was calculated using the CBO’s published estimates for the consumer price index, or CPI, and the CBO’s long-run expectation that the GDP price index would grow at a rate of 0.3 percentage points less than the CPI.
The CBO’s 2009 Medicare projections also had to be converted from calendar years to fiscal years. To do this, the authors added three-quarters of the estimate for the calendar year corresponding to the fiscal year to one-quarter of the estimate for the previous calendar year. Since the fiscal year starts three months before the calendar year—on October 1—one-quarter of the fiscal year falls within the previous calendar year.
The 2016 Medicare projections used in this analysis for 2016 through 2026 come from the CBO’s 10-year budget projections, published in March 2016. As was the case in 2009, “The 2016 Long-Term Budget Outlook” starts with these March projections and extends them into later years but only presents Medicare data as a share of GDP. The authors derived projections for years after 2026 by multiplying the CBO’s nominal GDP projections by the CBO’s projections for Medicare as a share of GDP. Unlike the 2009 outlook, both of these data sets are provided in fiscal years in the CBO’s 2016 long-term budget outlook.
Figure 1 shows the CBO’s 2009 Medicare projections, actual Medicare spending, and the CBO’s 2016 Medicare projections as a share of actual GDP or as a share of the GDP projections from the CBO’s 2016 long-term budget outlook. This controls for the effects of revisions to GDP projections and concepts between 2009 and 2016. This comparison does not include the effects of macroeconomic feedback in the 2016 long-term budget outlook, which is consistent with the CBO’s approach in its 2009 long-term projections.
Harry Stein is the Director of Fiscal Policy at the Center for American Progress. Laura Pontari is an intern with the Economic Policy team at the Center.
The authors would like to thank Richard Kogan from the Center on Budget and Policy Priorities for his advice on the calculations included in the Methodology. Any errors are the sole responsibility of the authors.