This report contains a correction.
Introduction and summary
Elected officials often raise infrastructure as a rare area in which legislative progress may be possible in the current political environment. Democratic leaders in the U.S. House of Representatives and U.S. Senate have voiced their support for putting Americans to work by modernizing the nation’s crumbling infrastructure. President Donald Trump campaigned on a promise of passing a $1 trillion infrastructure package, but he has governed quite differently. Trump has repeatedly called for deep cuts to federal infrastructure programs—including a cut of $159 billion over 10 years for highways and transit—and encouraged state and local governments to privatize public assets.1
Democratic leaders in Congress have been clear that they expect any infrastructure legislation to include measures that will help address climate change. In December 2018, then-House Minority Leader Nancy Pelosi (D-CA) pledged that “when Democrats take the gavel, we will rebuild America with clean energy, smart technology and resilient infrastructure.”2 Senate Minority Leader Chuck Schumer (D-NY) published an op-ed vowing there would be “No deal on infrastructure without addressing climate change.”3 The two leaders reportedly reiterated those points in a meeting with President Trump in the spring of 2019.4
Climate change presents an urgent challenge to the United States and the world. From 2016 through 2018, extreme weather events such as wildfires, hurricanes, and floods cost the United States more than $450 billion.5 According to scientists, the effects of climate change have made many of these events more severe. Higher sea surface temperatures resulting from climate change contributed to the strength and historic rainfall of Hurricane Harvey, which devastated the greater Houston area in 2017, while hotter, drier summers have made wildfires such as the 2018 Camp Fire, which killed 85 people in California, bigger and more destructive.6 Addressing climate change and protecting communities from its effects will involve changing where and how infrastructure gets built—and what kind of infrastructure is supported by direct federal spending.
In January, a Center for American Progress report argued that any infrastructure bill should address climate change not just by strengthening public infrastructure’s resilience to climate impacts, but also by funding infrastructure projects that yield measurable, ambitious reductions in the greenhouse gas emissions that are responsible for driving those impacts.7 The report also argued that setting an emissions reduction target as part of an infrastructure bill would help achieve that goal. CAP has also consistently argued that federal infrastructure legislation should focus primarily on direct investment opportunities and not on tax credits or public-private partnership approaches. The overwhelming majority of infrastructure needs are not well suited to alternative procurement approaches for a number of reasons; many critical infrastructure needs, including in the environmental space, will not produce a reliable stream of revenue that can be used to repay project financing, for instance.
Focusing on direct spending approaches to reduce the greenhouse gas emissions that drive climate change would represent a significant shift in how Congress considers both infrastructure and climate legislation. Over the past several decades, when Congress has debated legislation related to mitigating the greenhouse gas emissions that drive climate change, that discussion has centered on various market mechanisms—such as carbon prices or cap-and-trade programs—that would drive down emissions by increasing the economic cost of carbon pollution. Policies to accelerate the adoption of clean and renewable energy solutions, from wind and solar tax credits to carbon capture and sequestration technology, have largely been adopted through changes to the tax code. Meanwhile, relatively little direct federal spending today is aimed explicitly at reducing greenhouse gas emissions, whether through infrastructure or other programs.
However, it is urgent that Congress pursue all avenues to reduce carbon pollution and address climate change, including through direct federal spending. Due to policy changes enacted by the Trump administration, the United States is not on pace to meet its targets for economywide emissions reductions. Absent a major course correction, U.S. emissions will likely fall 12 percent to 19 percent below 2005 levels by 2025—a far cry from the goal of 26 percent to 28 percent reductions set as part of the Paris climate agreement, according to a recent analysis from the Rhodium Group.8
The purpose of this report is to identify pathways to maximize the emissions reductions possible through direct federal investment in infrastructure. This report prioritizes infrastructure investments for which there are existing federal programs that can be expanded or revised; where the infrastructure is federally owned or operated; or where there are significant market failures that demand a more robust government response. It then calculates emissions reduction potential per federal dollar invested. This report does not consider interactions between existing policies and the direct investment proposals in this report that could yield even larger emissions reductions; for instance, the recent 45Q tax credit for carbon capture, utilization, and storage (CCUS) could be used in concert with a direct grant program for deploying industrial energy efficiency equipment of the kind proposed in this report to achieve greater cuts in emissions than envisioned here. This report also discusses a number of enabling investments that are important for achieving emissions reductions in the electricity, transportation, and industrial sectors but that present technical challenges in calculating associated emissions reductions. For example, renewable energy sources such as wind and solar are typically geographically dispersed, and some of the areas of highest wind energy potential—such as the Great Plains or the Gulf of Maine—are not close to population centers with high energy demand. Therefore, increasing funding for transmission infrastructure is an important enabling investment to support renewable energy deployment, even if emissions reductions cannot be directly attributed to the investment.
What this report does not try to do is present a comprehensive solution to the climate crisis. Ambitious direct federal investment in infrastructure would be a new and effective tool for reducing carbon pollution, but it should not be the only tool. The proposals in this report should be seen as one set of actions that should accompany other policy solutions to address climate change. For example, if existing tax credits supporting deployment of mature renewable energy technologies were to be extended beyond their currently planned sunsets; if a new technology-neutral tax credit were put in place to support proven emissions-reducing clean energy technologies; or if Congress were to enact a price on carbon, different levels of direct infrastructure investment would be necessary in some cases to achieve emissions reductions commensurate with those envisioned in this report.
Taken together, the policies in this report would reduce annual greenhouse gas emissions by roughly 830 million metric tons of carbon dioxide equivalent (MMTCO2e) in 2030. This represents a 13 percent reduction in emissions from current levels and would result in economywide reductions of between 24 percent and 31 percent below expected 2030 emissions levels, depending on broader economic and policy trends such as the economic growth rate and the price of natural gas. Absent other policy changes, lower levels of investment in any of these initiatives would result in commensurately higher greenhouse gas emissions in 2030. All emissions reductions in this report are expressed on an annual basis in 2030.
For more than a century, the federal government has spent money building roads. In 1956, President Dwight Eisenhower signed into law the National Interstate and Defense Highways Act, which began the decadeslong process of building a national system of interstate highways. The main purpose of these investments was to improve the efficiency of interstate travel and to more easily move goods from farm to market. President Eisenhower stated, “Our unity as a nation is sustained by free communication of thought and by easy transportation of people and goods.”9 Under the structure of the 1956 law, the federal government provides funding to state departments of transportation that supplements local infrastructure funding. This basic structure remains in place.
The federal government did not consider these investments’ environmental implications. Subsequent environmental legislation has sought to reduce the harms that building highways and other infrastructure facilities caused, but federal transportation funding is still devoid of meaningful environmental goals. Federal law states in general terms that highway dollars should be used for “protecting and enhancing the natural environment.”10 Yet, there are no requirements that states use federal infrastructure dollars to reduce greenhouse gas emissions or reduce low-density sprawling land use patterns that destroy natural habitats and lock people into auto-dependent mobility. States retain near total discretion for how to spend federal dollars. In effect, federal infrastructure dollars act like an unstructured block grant. To achieve the nation’s climate goals, Washington must hold states accountable to ensure that federal dollars do not support projects that will increase emissions and destroy natural habitats, and it should increase direct expenditures on projects that will help further the fight against climate change.
Cutting power sector emissions through infrastructure investment
The power sector has historically been responsible for the largest share of U.S. greenhouse gas emissions. Since 2005, however, emissions have been declining in the power sector, driven largely by falling costs for natural gas and renewable energy technologies. In 2017, the share of electricity generated by coal fell to the lowest level recorded since World War II, while renewables accounted for 16 percent of generation, which is about double 2005 levels.11 Currently, the electricity sector accounts for about 28 percent of U.S. greenhouse gas emissions, just behind transportation at 29 percent.12
Decarbonizing the electricity sector is important not just because of the approximately 1,800 MMTCO2e directly emitted each year, but also because many technologies to reduce pollution in other sectors—such as plug-in electric vehicles, clean manufacturing, and zero-emission buildings—rely on electrification to replace direct combustion of fossil fuels. Thus, the power grid needs to be cleaned up over time in order to make those technologies true low-carbon alternatives.
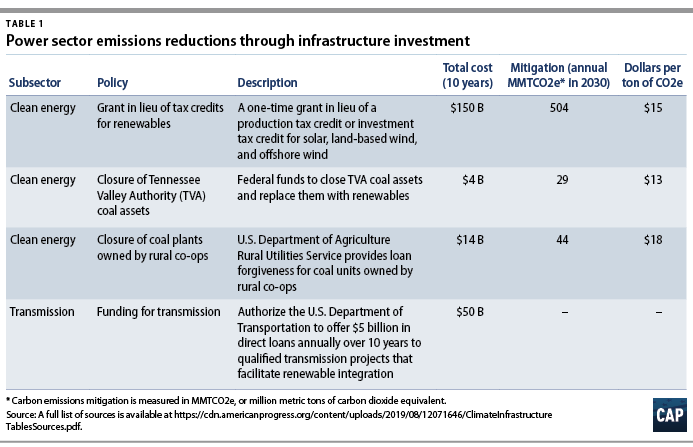
There are a number of straightforward, effective ways to reduce emissions from the electricity sector through direct federal investments. If fully implemented, the following five policy ideas would result in a reduction of at least 577 MMTCO2e in 2030.
Establish a program offering grants in lieu of tax credits for renewable energy production
Two tax credits—the production tax credit (PTC), most commonly used for wind energy, and the investment tax credit (ITC), most commonly used for solar—are among the most important ways the federal government has incentivized the development of renewable energy projects over the past several decades. The tax credits have expired and been extended several times since their creation, most recently in 2015 as part of a bipartisan deal to extend the PTC and ITC and slowly phase them down through 2022.13 The PTC began to decline in value in 2017, while the ITC will begin phasing out in 2019.
At the time the deal was struck, the Obama administration had finalized the Clean Power Plan, which would have set the first federal limits on the amount of carbon pollution that power plants could emit, thereby creating new incentives for utilities to install zero-emission renewable energy. However, the Clean Power Plan was stayed by the courts, and the Trump administration has finalized a replacement rule that would actually increase power sector emissions, leaving the renewable energy industry without a clear picture of the future of federal support for the growing sector.
Democrats in the House and Senate have recently begun voicing support for extending the PTC and ITC. In April, 110 House members asked the House Ways and Means Committee chair to include PTC and ITC extensions in any tax bills passing out of that committee.14 Sen. Schumer has called for making the PTC and ITC permanent.15 But key Senate Republicans, including Senate Finance Committee Chairman Chuck Grassley (R-IA), have stated their opposition to another PTC and ITC extension.16 And in recent testimony, an official from the U.S. Department of Energy (DOE) stated that he did not know whether the Trump administration has a position on a PTC or ITC extension.17
There is another option for Congress to continue—and even increase—support for getting more zero-emission renewable energy on the grid: reauthorizing and revising the Section 1603 “grants in lieu of tax credits” program that ran from 2009 to 2011 as part of the American Recovery and Reinvestment Act.
Often, renewable energy projects do not have enough income in their early years to take full advantage of the tax incentives available to them. Therefore, project operators choose to sell those PTC or ITC benefits, at a discount, to a tax equity investor and use the cash to help capitalize the project. This substantially diminishes the impact and efficiency of these tax credits.18 The Tax Cuts and Jobs Act of 2017 further complicates the picture for the PTC and ITC, since tax equity providers with sufficient tax burden to offset will become scarcer and the lower corporate tax rate means that any given project’s depreciation will be worth less than it would have been before the tax cut, thereby reducing the amount of tax equity capital available for renewable energy projects.19 Reinstating the Section 1603 program would address both of these barriers to renewable deployment by providing an upfront grant and allowing developers to obtain the full value of the incentive.
The Section 1603 program was originally created in response to a decline in the availability of tax equity investment capital to support renewable energy projects as a result of the financial crisis. From 2009 to 2010, the program supported nearly 1,500 renewable energy projects at a cost of $5.6 billion.20
Reauthorizing and revising the Section 1603 grants in lieu of tax credits program could offer several advantages for supporting renewable energy projects. First, to maximize the program’s impact and guard against gold plating of investment costs, the program could limit support to projects providing competitive levels of annual estimated renewable electricity generation per dollar of capital invested. For example, the program could use the industry standard P90 estimate of the minimum projected annual output, and projects could be required to return a portion of their ITC support if they fail to match their projected output level during the first three years of operation.21
Second, because the program offers direct federal assistance instead of indirect tax expenditure support, Congress could direct the DOE to give priority support to renewable energy projects that meet certain criteria. For example, targeted grants could be given to renewable energy projects that deploy relatively novel technologies such as offshore wind or tall turbines, which make wind viable in new regions such as the Southeast United States; replace legacy fossil fuel power plants owned by rural electric co-ops; meet wage and labor requirements; or integrate battery storage alongside new generation capacity.22 Different benefit levels could be specified for different kinds of renewable energy projects as well.
Third, 100 percent of the federal expenditure on a program providing grants in lieu of tax credits would support renewable energy projects, rather than a significant portion flowing to Wall Street investors; indeed, a 2011 Congressional Research Service report noted that grants “may be a more efficient mechanism” than tax credits for supporting renewable energy projects.23
And finally, if Congress is able to agree on a path to extend or revise the renewable energy tax credits—for example, by transitioning to a technology-neutral tax credit for deploying mature technologies—a program providing grants in lieu of tax credits could continue to operate in parallel to help finance deployment in less lucrative markets or to support newer technologies, such as tall turbines, thereby supporting even more deployment of zero-emission power generation.
The frequent expirations and unpredictably shifting value of the tax credits has historically led to irregular spikes and dips in the amount of renewable energy generation coming online year over year.24 A 10-year grants in lieu of tax credits program would provide certainty to the renewable energy sector, utilities, and power market regulators.
As noted above, there are a number of design options that Congress could pursue for reauthorizing and revising the Section 1603 program. One option would be to reauthorize the program for $150 billion between 2020 and 2030, which would support renewable energy capacity additions of at least 30 gigawatts (GW) per year—the near-term pace that the Obama administration’s 2016 United States Mid-Century Strategy for Deep Decarbonization modeled as necessary to prevent the worst impacts of climate change.25 Given the currently planned phaseouts of the PTC and ITC, onshore wind projects should be able to access such a program starting in 2022 and solar projects should be eligible starting in 2024. Offshore wind and tall-turbine wind projects in new onshore regions should be eligible starting immediately in 2020, given that the U.S. offshore wind industry is still in its infancy and merits additional near-term support.
Assuming that a $150 billion program offered grants valued at 2 cents per kilowatt-hour of production for onshore wind and solar without storage, and 3 cents per kilowatt-hour of production for onshore wind and solar when paired with four-hour battery electric storage, it could support 240 GW of new onshore wind and solar generation and storage by 2030. A program providing a grant in lieu of an investment tax credit for offshore wind with one-hour battery electric storage capacity valued at 30 percent would add another 21 GW of renewable energy capacity by 2030. All together, these renewable energy capacity additions would result in cuts of at least 504 MMTCO2e in 2030, at a cost of less than $15 per ton.
Retire remaining Tennessee Valley Authority coal assets and replace them with zero-emission generation
The Tennessee Valley Authority (TVA) was created by the New Deal in the 1930s to spur economic development in one of the most depressed regions in the country, including by bringing electricity service to large swaths of Tennessee, Alabama, Mississippi, and Kentucky for the first time. Today, the TVA still is the largest government-owned provider of electricity.26 However, 24 percent of the TVA’s electricity generation comes from coal-fired power plants.27
In February 2019, the TVA board voted to close two of its coal plants, saying that continuing to operate them was not economically viable.28 Annual operations and maintenance costs of the TVA’s coal fleet run more than $1 billion annually, with the vast majority of that total—$762 million—going to coal fuel purchases.29
Congress could direct the TVA to accelerate the closure of its remaining coal assets and replace them with zero-emission sources, as well as make funds available to offset the costs of new construction and associated transaction costs. As an example, the TVA could invest in building 7,300 megawatts (MW) of onshore wind to replace the 5,800 MW of coal that will remain in the TVA’s fleet after the two coal plant retirements mentioned above. It would cost $10.5 billion to construct that much new onshore wind generation capacity, while closing the TVA’s coal assets would avoid $7.9 billion in coal fuel costs over 10 years, with additional savings outside the 10-year window. The net undiscounted cost over the first decade of transitioning the TVA’s coal assets to onshore wind would therefore come to $3.8 billion, once transaction costs are taken into account, and cut U.S. greenhouse gas emissions by 29 MMTCO2e.
Forgive debts of rural electric co-ops and fund new zero-emission electricity generation
The United States’ network of rural electric cooperative (REC) utilities grew out of the New Deal era. Today, the 893 RECs—62 of which generate and transmit their own power, and the remainder of which transmit electricity generated by other utilities to customers—serve 42 million Americans across 88 percent of counties in 48 states.30 Rural co-ops have been making strides in installing renewable energy on their grids, with such generation increasing 145 percent since 2010, but the majority of REC-owned generation comes from fossil fuel power plants, and 40 percent of it from coal, leading to 110 MMTCO2e in emissions each year.31
Most REC projects are financed in whole or in part by low-interest loans from the U.S. Department of Agriculture’s (USDA) Rural Utilities Service (RUS).32 However, since RECs have limited cash reserves, even a low-interest loan typically sits on a utility’s books until it is paid in full.33 As costs for renewable energy generation continue to decline relative to coal, and as more states pursue commitments to 100 percent clean electricity generation, RECs risk being stuck with expensive stranded assets in the form of their coal-fired power plants. The federal government should step in to prevent that from happening and help RECs further accelerate their community-led clean energy transition. The RUS has $7 billion in outstanding loans supporting coal-fired power plants; forgiving those debts would enable many REC coal plants to close, cutting emissions by at least 44 MMTCO2e.34
Co-ops would be eligible for the grants in lieu of tax credits program for renewable energy described previously, although in the absence of such a program, the RUS and the DOE should be authorized to offer grants to install renewable energy capacity equivalent to the generating potential of retired REC coal plants and further support any improvements to transmission and grid storage necessary to enable the transition to cleaner energy sources.
Accelerate the offshore wind industry with technical assistance and resources for permitting
After years of debate, the first U.S. offshore wind installation came online in 2016 off Rhode Island.35 While the Block Island Wind Farm is relatively small—just five turbines—the offshore wind industry is poised for takeoff.36 There were more than 25,000 MW of Atlantic offshore wind in the development pipeline as of June 2018, according to the National Renewable Energy Laboratory.37 States planning to build significant new offshore wind resources include New York, which intends to install 9,000 MW of offshore wind by 2035, and New Jersey, which intends to install 3,500 MW of offshore wind by 2030.38
With so many offshore wind projects in the pipeline, states and regional transmission organizations must plan how to most efficiently integrate these new-generation resources onto the grid. Congress should direct the DOE to make additional technical assistance resources available to states and electricity system operators to prevent conflicts between offshore wind developers and grid managers and to avoid the overbuilding of offshore transmission infrastructure.
Close coordination with fishing interests is also necessary. As of the time of this writing, the $2.8 billion 800-MW Vineyard Wind project is imperiled by concerns about impacts on the commercial fishing industry. A final environmental impact statement from the Bureau of Ocean Energy Management (BOEM) had been expected by July 2019 but was delayed in order to conduct what a BOEM spokesperson described as a “cumulative impacts analysis” that may not be issued until next year, a timetable that could endanger the project’s financing.39 The recent memorandum of understanding among the Responsible Offshore Development Alliance, which represents the commercial seafood and fishing industry, the National Marine Fisheries Service (NMFS), and BOEM offers one model that may reduce this kind of delay and uncertainty in future offshore wind projects.40 In addition, Congress should increase funding for the BOEM and the NMFS to help accelerate permitting for offshore wind installations.
As noted above, the grants in lieu of tax credits program for offshore wind could support 21 GW of new offshore wind capacity by 2030, which would cut emissions by 51 MMTCO2e. This report’s estimated emissions reductions from the grant program reflect these reductions.
Increase investments in transmission infrastructure to get renewable generation to markets
Significantly more investment in transmission infrastructure is needed to integrate renewable resources into the electric grid and to support projected increases in demand that will come as a result of the rising use of electricity instead of fossil fuels in transportation, buildings, and industry. While utilities invest an average of $15 billion in transmission projects today, demand for new and improved transmission capacity is projected to grow to $22 billion per year by 2030, and as much as $40 billion per year through midcentury, according to a study from the Brattle Group.41 Given projected demand, Congress should authorize the U.S. Department of Transportation (DOT) to distribute up to $5 billion per year in Transportation Infrastructure Finance and Innovation Act loans through 2030 to transmission projects that enable integration of renewable energy resources. Congress could also direct the DOT to prioritize projects that benefit rural, tribal, low-income and fence-line communities to promote equitable access to renewable electricity and should further consider directing the DOE to provide technical assistance and support to state energy offices to help resolve siting disputes in a timely manner—particularly for important multistate transmission projects. While emissions reductions cannot be directly attributed to transmission infrastructure, investing in such infrastructure is critical to enabling the emissions reductions that will result from increased renewable energy and electric vehicle deployment, among other climate solutions.
Summary
Such ambitious levels of direct federal investment in clean energy generation and distribution would be unprecedented in the context of infrastructure legislation, but the urgency of climate change makes it both necessary and appropriate. The amount of emissions reductions achievable if the above policies are fully implemented—577 MMTCO2e—is equivalent to the pollution that 122 million cars or 148 coal-fired power plants emit in a year.42
Congress should consider whether higher staffing levels will be needed at the DOE, the DOT, the USDA, and the U.S. Department of the Interior to ensure that these dollars flow expediently, particularly in light of the Trump administration’s efforts to divert resources away from clean energy and climate change-related programs across the federal government.
Cutting transportation emissions through infrastructure investment
At 29 percent of total U.S. emissions, the transportation sector is now the largest source of greenhouse gas emissions in the United States.43 The clear culprit is driving: Each year, Americans drive more than 3.2 trillion miles—enough to travel to the moon and back 13.5 million times.44 According to the U.S. Environmental Protection Agency (EPA), light-duty vehicles—which include passenger cars and light trucks—account for 60 percent of transportation emissions while medium- and heavy-duty trucks account for 23 percent.45 According to the American Community Survey, 91 percent of U.S. households have at least one private vehicle available to them.46
Direct federal infrastructure investments can help to reduce greenhouse gas emissions from transportation in multiple ways. First, these investments can provide direct federal funding for agencies to purchase zero-emission vehicles in instances where federal, state, and local governments own and operate vehicle fleets. Second, the federal government can subsidize the electrification of private vehicles and associated charging infrastructure through tax incentives to manufacturers, buyers, and utilities. Third, the federal government can alter its highway and transit programs to reward state and local governments that select projects that are more land use efficient. Infrastructure investments shape the built environment. Low-density development patterns and a lack of transportation choice force people to drive to meet their mobility needs, raising household transportation costs and emissions in the process. Federal highway policy should require state and local governments to develop transportation and land use plans that will reduce mobile source emissions and provide safe, convenient, and sustainable alternatives to driving, including public transportation, biking, and walking.
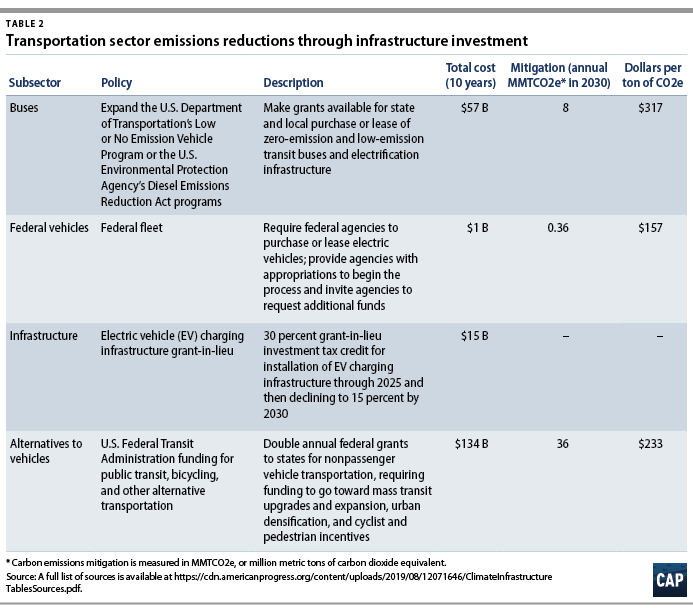
If fully implemented, the following four policy ideas would result in emissions reductions of around 44 MMTCO2e in 2030. (see Table 2)
Significantly increase funding to purchase electric buses for public transit and school districts
There are approximately 66,000 buses in public transit fleets across the country, and approximately 480,000 school buses operated by public and private schools.47 Most of these buses run on fossil fuels, although in recent years the share of public transit buses that use diesel has been falling, with liquified natural gas and biodiesel making up a growing percentage.48 In school fleets, diesel is still overwhelmingly the fuel of choice, according to research by Bellwether Education Partners.49 Running municipal and school buses with fossil fuels contributes both to climate change and to local air pollution.
In recent years, the DOT has helped states and municipalities buy zero-emission buses and install associated charging infrastructure through the Low or No Emission Vehicle program.50 In 2017, $84.5 million in grants was awarded to 40 states through this program.51 Electric buses have a higher sticker price than conventional diesel buses: Electric transit buses cost about $200,000 more than diesel buses, and electric school buses cost about $120,000 more than diesel ones today, although according to Bloomberg New Energy Futures, they are estimated to reach cost parity by 2030.52 Moreover, electric buses have much lower fuel costs and lower lifetime maintenance costs than conventional buses—providing as much as $400,000 in lifetime savings for transit and $170,000 in savings for school buses, which does not account for improved health outcomes owing to decreased air pollution.53
Assuming that the average lifespan of a bus is 12 years, about 8 percent of the bus fleet should turn over annually.54 If the Low and No Emission Vehicle program were revised and expanded to provide grants to cover the price differential between purchasing a conventional bus, and prices decline as expected through 2030, then an investment of $57 billion over 10 years would enable the purchase of 480,000 electric transit and school buses, yielding 8 MMTCO2e in emissions reductions in 2030.
Transition the federal fleet to 100 percent zero-emission vehicles
In 2017, the federal government owned or held leases on a total of 93,683 vehicles across all sizes.55 Only about 200,000 electric vehicles (EVs) were sold in the United States that year, thus planned federal purchases would provide a significant market signal to manufacturers over the next decade.56 Much like with transit and school buses, EVs have lower fuel costs than traditional internal combustion engine vehicles, with the cost of an e-gallon coming in at about half the price of a gallon of gas, according to the DOE. Therefore, transitioning to EVs should save the federal government money on fleet fueling.57
If Congress were to direct the federal government to replace subcompact, compact, and midsize vehicles in the federal fleet with EV versions—and make funds available to make up the cost difference between traditional internal combustion engine vehicles and EVs—0.36 MMTCO2e would be cut in 2030 at a cost of $884 million.58 Over the expected lifetime of the vehicles, 4 MMTCO2e in emissions would be avoided and agencies would enjoy considerable savings in operating costs. Congress should also direct the General Services Administration to clarify procurement rules for federal agencies to make clear that purchasing or leasing EVs is the preferred option whenever possible.
Expand public and workplace EV charging infrastructure
Conventional internal combustion engine vehicles are supported by a network of more than 100,000 fueling stations nationwide, whereas as of 2018, there were just 18,000 public charging stations for EVs.59 While EV owners can charge their vehicles at home, concerns about batteries running down while out and about—sometimes referred to as “range anxiety”—is a major concern for many consumers.60 Potential EV owners who do not own their own home could also be barred by landlords from installing home EV chargers, making public and workplace charging opportunities even more important.61 And it takes considerably less time to refuel an internal combustion engine vehicle at the pump than it does to fully recharge an EV, meaning a robust EV charging network may need to be considerably larger than that of the 100,000 gas stations in the United States today.
A 2018 Center for American Progress report estimated that the United States will need to add enough workplace charging stations to support 14 million EVs by 2025 to align with the transportation emissions reductions goals of the Paris climate agreement.62 The demand for public EV charging will continue to climb after 2025. One study by McKinsey & Company found that even absent additional policy interventions, EVs will account for 14 percent of new vehicles sold in the United States in 2030, up from 1.15 percent of new vehicle sales in 2017—and those numbers do not account for a growing demand for used EVs.63
Since many EV charging stations will be privately owned and operated, the federal government should not be responsible for paying for 100 percent of costs but should take steps to accelerate the installation of public and workplace EV chargers. One approach would be to create a 10-year, $15 billion program providing grants in lieu of investment tax credits administered by the DOE, beginning with covering 30 percent of installation costs from 2020 to 2025 and then declining through a sunset in 2030.64 This would enable the installation of an estimated 1.2 million Level 2 chargers—which take about 3 1/2 hours to provide 80 miles’ worth of charge—and an estimated 55,000 direct current fast chargers, which take just 30 minutes to provide the same amount of charge but are seven times as expensive as Level 2 chargers.65
Double grants to states to expand nonpassenger vehicle transportation options
In addition to accelerating the deployment of zero-emission personal and public vehicles, the federal government can and should do more to support investments in and improvements to transportation solutions beyond car travel. Increasingly, Americans are seeking to live in denser communities with multiple transportation options, including public transit; bicycling infrastructure; shared mobility systems such as bike sharing and electric scooters; and safe pedestrian options. Cities across the country have voluntarily committed themselves to the Vision Zero agenda, which aims to eliminate traffic fatalities, many of which are the result of cars hitting pedestrians or bicyclists.66 The federal government should do more to support investments in well-planned public transportation systems and nonvehicular personal transportation infrastructure.
The Federal Transit Administration provides a variety of grants and policy guidance to states and municipalities for nonvehicular transportation systems. Doubling these grants would result in reductions of at least 36 MMTCO2e in 2030, at a cost of $134 billion over a decade. This figure understates the impact of these investments through midcentury by avoiding locking in suburban sprawl and freeing up land for other uses such as carbon sequestration.
Summary
Given federal infrastructure legislation’s historic focus on building and repairing highways, Congress should use infrastructure spending to reduce emissions from the transportation sector. Reducing emissions from transportation through increased vehicle electrification will also have a number of positive public health effects—particularly in urban areas where conventional air pollution from passenger vehicles and transit buses contributes to higher-than-average incidences of asthma and respiratory diseases.67 The 44 MMTCO2e in reductions directly attributable to the above policies are equivalent to taking more than 9 million cars off the road for one year—a figure that does not capture the climate benefit of the millions of zero-emission passenger vehicles that would be supported by the creation of a national EV charging network.
Cutting building emissions and energy use through infrastructure investment
Commercial and residential buildings make up 12 percent of U.S. greenhouse gas emissions, a calculation that takes into account both direct emissions from the burning of fossil fuels and the landfilling of waste as well as indirect emissions from the consumption of electricity generated by fossil fuels.68 The high upfront cost of new, energy-efficient equipment and building retrofits is a major barrier to reducing greenhouse gas emissions from the buildings sector.69 Congress should seek to expand proven federal programs that can improve energy efficiency and increase on-site clean energy generation in public buildings, commercial buildings, and residential housing.
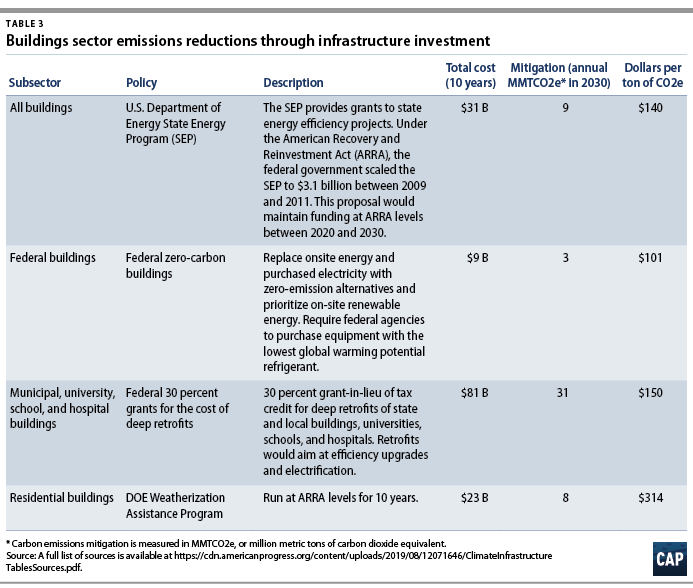
If fully implemented, the following four policy ideas would result in an annual emissions reduction of around 47 MMTCO2e in 2030. (see Table 3)
Increase funding for the DOE’s State Energy Program
Since 1996, the DOE’s State Energy Program has provided grants and technical assistance to states to help finance energy efficiency and clean energy initiatives; the recipient states typically also use state or private resources to amplify the impact of the federal grant. For every federal dollar spent through the State Energy Program, beneficiaries realize $4.50 in energy savings.70 The American Recovery and Reinvestment Act of 2009 rapidly scaled up funding for the State Energy Program from $33 million in the previous fiscal year to $3.1 billion, which was disbursed to states between 2009 and 2011. The Oak Ridge National Laboratory conducted a peer-reviewed study of State Energy Program outcomes both pre- and post-stimulus and found that the expanded program supported more than 135,000 jobs and lifetime emissions reductions equivalent to taking 126 million cars off the road for one year.71
If Congress reauthorized the State Energy Program at its stimulus levels for a decade—$31 billion—it would result in reductions of roughly 9 MMTCO2e in 2030.
Make federal buildings zero-carbon
As with the federal vehicle fleet, the energy technologies used in federal buildings can provide a powerful market signal to the commercial building industry. In fiscal year 2016, the federal government owned and held leases on more than 250,000 buildings totaling 2.6 billion square feet; office space comprised 21 percent of that square footage.72 Since 1975, efforts to improve the energy performance of federal buildings have saved $50 billion.73 Past legislation has set timelines for improving energy efficiency in federal buildings and mandated the increased use of specific technologies, such as solar-powered water heaters. However, advances in the commercial building sector in recent years have put truly 100 percent-electrified and zero-carbon buildings well within reach for the federal government.
If Congress directed federal agencies to replace purchased electricity and on-site energy generation consumption for space and water heating with zero-emission alternatives, and mandated that new cooling equipment purchased for federal buildings use refrigerants with the lowest global warming potential, 3 MMTCO2e would be mitigated in 2030 at a cost of $8.9 billion.
Incentivize deep retrofits of municipal buildings, universities, schools, and hospitals
There are approximately 912,000 municipal buildings, university buildings, school buildings, and hospitals (MUSH) in the United States. Energy costs for the MUSH sector typically represent significant portions of municipal budgets; for example, energy costs are typically school districts’ second-largest budget item, after salaries.74 Financing deep retrofits of MUSH buildings to improve energy efficiency; electrify boilers and other equipment currently powered by fossil fuels; install on-site renewable energy; and replace older refrigeration systems with low-emitting alternatives would help cut costs for local governments while combating climate change. One study found that in Minnesota alone, reducing energy use just 20 percent through improved efficiency in the MUSH sector would create 15,000 jobs and save $3.1 billion in energy bills.75
According to the Rocky Mountain Institute, a deep retrofit of a commercial-grade building—which most MUSH buildings qualify as—costs between $25 and $150 per square foot.76 While deep retrofits and equipment replacement can net significant energy savings over time, the upfront capital costs are significant; one energy efficiency retrofit at a New Jersey hospital is expected to save $600,000 per year but cost $5.7 million to complete.77 For many cash-strapped municipalities, public school districts and universities, and hospital systems, cost-saving energy efficiency retrofits will remain out of reach absent increased access to financial assistance.
One option to accelerate the retrofitting of MUSH buildings would be to create a dedicated grant program at the DOE that would cover 30 percent of a deep retrofit’s costs. The remainder of funding could come from other public budgets, on-bill savings programs in partnership with utilities, or energy savings performance contracts, which enable building owners to use ongoing savings to pay back the costs of a retrofit over time. Assuming a $75 median cost per square foot, an $8.1 billion annual federal program would cut nearly 31 MMTCO2e by 2030 and support deep retrofits in up to 6,500 MUSH buildings per year.
Run the Weatherization Assistance Program at increased capacity for 10 years
Low-income households face higher energy burdens than middle- and high-income Americans, both because paying for energy eats up a larger share of their salaries—a median of 7.2 percent for low-income Americans, compared with 3.5 percent for all Americans—and because their homes tend to be older, leakier, and have outdated appliances and equipment.78 Since the 1970s, the DOE’s Weatherization Assistance Program (WAP) has supported energy efficiency retrofits and new equipment for low-income households; however, the need for such support has consistently outstripped the amount of funding available.
Under the 2009 American Recovery and Reinvestment Act, WAP was scaled up rapidly, from $230 million in annual funding to $5 billion over a three-year period.79 Since WAP had been successfully operating for a long time, increasing spending on the program was expected to support immediate hiring during the economic downturn while easing financial burdens on low-income households. A comprehensive study conducted by the Oak Ridge National Laboratory looked at the number of homes weatherized, energy savings, cost-to-savings ratio, number of jobs supported, and cumulative carbon reductions resulting from WAP both during and in the period immediately before the American Recovery and Reinvestment Act funding surge.80
While the study identified some challenges during the Recovery Act period resulting from increasing oversight requirements, public scrutiny, and the cost of training new workers, overall, the program was able to effectively spend the increased funding, with more than 340,000 households benefiting and carbon emissions cut by more than 7 MMT over the lifetime of the improvements.81 Running the WAP at American Recovery and Reinvestment Act levels for 10 years would cost $23 billion and result in roughly 4 MMTCO2e in emissions reductions in 2030.
Summary
Retrofitting buildings for energy efficiency creates multiple benefits: It saves building owners and operators money, creates construction jobs, raises demand for energy efficiency products and materials—many of which are manufactured in the United States—and reduces greenhouse gas emissions. The 47 MMTCO2e reductions that would result from the above policies are equivalent to more than 8 million homes’ annual electricity usage. Congress should have a high degree of confidence that the programs proposed here for expansion can handle the additional funding appropriately, given the extensive studies of the DOE’s weatherization and efficiency programs’ effective response to the influx of American Recovery and Reinvestment Act funds.
Cutting industrial and noncarbon emissions through infrastructure investment
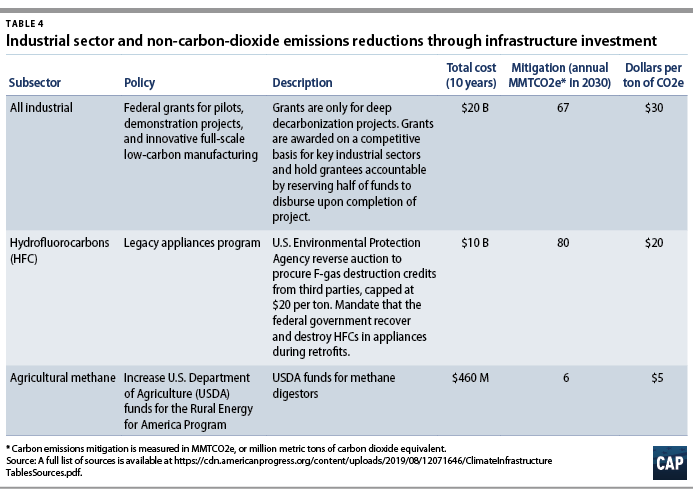
Effectively combating climate change requires reducing greenhouse gas emissions across the entire economy. Much of this activity outside the power, transportation, and buildings sectors does not fit the definition of infrastructure used for the purposes of identifying areas for investment in this report. However, there are some important investments that can—and should—be included in an ambitious infrastructure bill in order to help phase down industrial and agricultural pollution while supporting domestic manufacturing growth and rural economic development. Combined, these measures would yield reductions of around 153 MMTCO2e in 2030.
Provide grants for innovative, low-carbon manufacturing
Industrial activity accounts for 22 percent of greenhouse gas emissions in the United States and given the heterogeneity and complexity of industrial facilities and the trade exposure of U.S. manufacturing, the industrial sector is widely considered one of the most difficult to decarbonize.82 Compared with other sectors of the economy, industrial emissions come from a wide range of sources and processes. While there is a high technical potential to electrify many industrial processes that currently rely on fossil fuels, according to a study from the Lawrence Berkeley National Laboratory, there are significant challenges, including a lack of data about proprietary industry practices and the high economic cost of new equipment.83
Beyond electrification, some of the most promising technologies for decarbonizing industry include carbon capture, utilization, and storage as well as the production of hydrogen by electrolysis to provide fossil fuel alternatives for high-heat industrial processes.84 However, these technologies have not been deployed at scale in the industrial sector in the United States or elsewhere. With the right incentives, the United States has an opportunity to build out clean manufacturing—decarbonizing U.S. and global industrial trades while onshoring manufacturing and growing domestic jobs. As part of an infrastructure package, Congress should create a 10-year, $20 billion grant program to support innovative, low-carbon manufacturing that has the potential to deeply decarbonize key industrial subsectors, including iron and steel production, cement, and chemical production. These technologies could include electrification, deploying CCUS, scaling biomass-based feedstocks, or using green hydrogen as a source for process heat, among others. The benefit of the technology-neutral grant program is that it allows for the potential of all these technologies to fill niche roles within the complex industrial subsectors. Given the lack of data, abatement potential in the industrial sector is likely underestimated. In this analysis, using current technology costs of CCUS as a proxy for the suite of potential deep decarbonization technologies, a $20 billion grant program would yield emissions reductions of up to 67 MMTCO2e in 2030.85
Rapidly phase out superpolluting refrigerants and find and destroy stocks
While carbon dioxide is by far the most prevalent of the greenhouse gases that drive climate change, other heat-trapping gases from human activity also contribute to the problem. Hydrofluorocarbons (HFCs)—chemicals that are frequently used in refrigeration and air conditioning—are a particularly potent greenhouse gas, trapping thousands of times as much heat per ton released into the atmosphere as 1 ton of carbon dioxide.86 Phasing out HFCs worldwide could prevent between 0.2 degrees and 0.44 degrees Celsius of warming by the end of the 21st century.87 During the Obama administration, the United States helped negotiate the Kigali Amendment to the 1987 Protocol to do just that, but the Trump administration has refused to send the agreement to the Senate for ratification.88 States have begun stepping up ambitiously to address potent industrial gases, including reducing new production and consumption of HFCs as well as destroying existing stocks of HFCs and other fluorinated gases.89 Congress could achieve significant emissions reductions by including provisions in an infrastructure bill requiring government contractors to recover and destroy HFCs from appliances during MUSH building retrofits and in the WAP program and by providing grants to states to support their efforts or potentially creating a reverse credit auction at the EPA to incentivize private operators to find and destroy existing stocks of HFCs.90 Combined, these initiatives would cost no more than $10 billion over 10 years and result in reductions of up to 80 MMTCO2e in 2030.
Increase funding for methane digesters in agricultural settings
Agriculture accounts for 9 percent of U.S. greenhouse gas emissions, including from methane emissions resulting from livestock production.91 Methane is another greenhouse gas that is more potent than carbon dioxide in the near term, trapping between 28 and 36 times as much heat as carbon dioxide per ton emitted.92 Methane enters the atmosphere from a variety of processes, including oil and gas production, landfills, and the decomposition of food and animal waste. Methane emitted from livestock manure pits and lagoons not only contributes to global warming, but it also represents a wasted economic opportunity for farmers, because methane can be captured and burned as fuel. During the Obama administration, the USDA set a goal of funding and installing 500 anaerobic digesters—which can be installed at manure pits to capture methane—by 2025.93 Congress should appropriate sufficient funds and direct the USDA to meet that 2025 goal and continue providing grants for the installation of anaerobic digesters at the same rate through 2030. Doing so would cost $460 million and yield 5.5 MMTCO2e in reductions in 2030.
Summary
The industrial and agricultural sectors are important drivers of climate change both in the United States and around the world but have relatively few ready-made solutions for reducing emissions in a cost-effective way. By investing in policies such as those outlined above through direct infrastructure investment, Congress can jump-start broader policy and technological development critical to the long-term decarbonization of these sectors. The 153 MMTCO2e emissions reductions resulting from these policies is equivalent to the amount of emissions from 39 coal-fired power plants in one year.
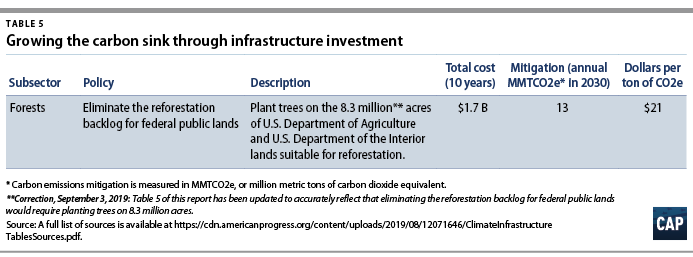
Growing the carbon sink through infrastructure investment
Any serious, comprehensive infrastructure package will recognize—and fund—natural infrastructure, as well as more traditional built infrastructure. Healthy and resilient wetlands, forests, and coastlines, for example, are often the most effective and low-cost avenue to protect communities from the worst effects of climate change. Direct investment in forests—specifically, planting trees on national public lands—provides a cost-effective, ready solution to sequester carbon from the atmosphere. There are an estimated 8.3 million acres of public lands managed by the U.S. Department of the Interior and the USDA that could benefit from reforestation.94 Using existing authorities and tools, including annual appropriations and the Reforestation Trust Fund, Congress could quickly eliminate the reforestation backlog and build bigger carbon sinks. Doing so would cost $1.7 billion and result in reductions of approximately 13 MMTCO2e in 2030. (see Table 5)
Protecting environmental review and public input through infrastructure investment
Increased federal infrastructure spending must come with guardrails to protect and encourage existing pathways for community engagement in federal projects, as well as protect existing requirements for environmental review under the National Environmental Policy Act (NEPA). Instead of giving into red-tape arguments about streamlining permitting by cutting back on critical environmental reviews, infrastructure investment needs to include direct funding for agencies—particularly the EPA—to support a robust NEPA process. Additionally, direct investments must not only protect but also further support opportunities for robust public engagement during project reviews and approval stages.
The 2015 Fixing America’s Surface Transportation Act created a fee authority through which project proponents would partially reimburse the government for their costs incurred in conducting environmental reviews.95 Unfortunately, the Trump administration has so far neglected to fully implement this new authority, which, in addition to proposed budget cuts for the agencies responsible for permitting approval, has left NEPA reviews woefully underfunded. Direct infrastructure spending should therefore include funding for agencies to support these basic review and permitting processes, with particular emphasis on funding for the EPA, given that it is the agency with the most tools and talent available to support other agencies in undertaking environmental reviews. Funding of this sort to agencies must also put a premium on public input throughout the permitting and review process.
Conclusion
Climate change is already affecting every facet of the U.S. economy, and achieving the deep reduction in carbon emissions necessary to avert climate change’s worst future impacts will require using every tool available. Direct federal infrastructure investment has the potential to achieve significant emissions reductions, help fund projects of significant public importance, and target investment to communities that may not attract the attention of private investors, such as rural areas and low-income households. However, infrastructure investment must be understood as one tool among many. Ultimately, it will take all levers of government and private sector activity to build the 100 percent clean energy economy that the United States needs in order to combat climate change.
About the authors
Kristina Costa is a senior fellow at the Center for American Progress.
Christy Goldfuss is the senior vice president for Energy and Environment Policy at the Center.
Kevin DeGood is the director of Infrastructure Policy at the Center.
Acknowledgements
The authors would like to thank current and former CAP staff Luke Bassett, Bianca Majumder, Ryan Richards, Sally Hardin, Alison Cassady, Miriam Goldstein, Lia Cattaneo, and Miranda Peterson for their contributions to this project, as well as CAP editorial and art staff Will Beaudouin, Shanée Simhoni, Christian Rodriguez, Keenan Alexander, and Chester Hawkins. Analytic support and additional policy research were provided by Gigaton Strategies (Rick Duke) and Peter Hansel, for which the authors are deeply grateful.