Introduction and summary
For more than 100 years the internal combustion engine (ICE) dominated vehicle design, bringing with it large increases in greenhouse gas (GHG) emissions. In 2015, the number of fossil fuel-propelled cars in the United States rose to 113 million,1 up from just 8,000 in 1900.*2 Now, plug-in electric vehicles (PEVs) provide a cleaner alternative that not only reduces GHG emissions, but also provides local air quality, noise reduction, and national security benefits. PEVs are an integral component in the suite of technologies that will help meet the United States’ commitments under the Paris Agreement—an ambitious 26 percent to 28 percent reduction in GHG emissions by 2025, compared with 2005 levels.3
As with any major technological transformation, transitioning to an electrified transportation system will not be easy nor cheap. A century of public and private development led to the existing fleet of ICE vehicles, complemented by more than 100,000 gas stations,4 federally funded roads that connect communities,5 and a vast network of service stations and dealerships. With about 800,000 PEVs6 and 18,000 charging stations7 on the road now, the revolution is just beginning.
Overview of PEVs and charging infrastructure technology
This content relies on language published in a previous CAP report on electric vehicles8 and is provided here for background.
“Electric vehicles” (EVs) is a broad category that can mean different things in different situations. To avoid confusion, this report generally avoids using the term “electric vehicle.” It focuses on the benefits of and policies related to the deployment of PEVs. PEVs can be charged in whole or in part by an off-board electric power source. This is distinct from hybrid electric vehicles, which supplement an ICE with battery power—often charged through regenerative braking—but cannot be plugged in.
PEVs are further divided into plug-in hybrid electric vehicles (PHEVs) and battery electric vehicles (BEVs). PHEVs typically run on electricity for shorter ranges—currently up to about 40 miles—then switch over to a gasoline-powered ICE when the battery is depleted. BEVs run only on electricity; they typically travel up to 100 miles on a single charge, and high-end models can reach up to 250 miles.9
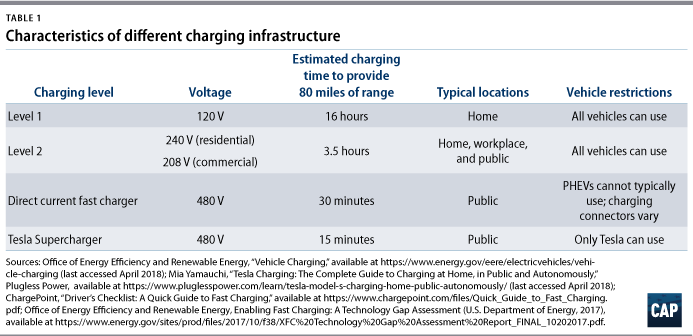
PEVs can be connected to the electricity grid and recharged through charging infrastructure—sometimes referred to as EV supply equipment. The types or levels of charging infrastructure are commonly defined as Level 1, Level 2, and direct current (DC) fast chargers. As battery technology improves, vehicles will be able to go farther on a single charge. This report focuses on public Level 2 chargers and DC fast chargers.
Tipping the balance of vehicles toward PEVs requires the funds to incentivize the widespread adoption of new vehicles and their charging infrastructure, along with the will to overhaul the existing system. State and federal policymakers need to find new and creative ways to put more PEVs on the road. Policy leaders across the country are spurring investment in charging infrastructure through the use of state financial incentives and funds available through the Volkswagen (VW) settlement, which requires VW to make payments to resolve the federal government’s allegations that the company cheated emissions standards.10 But current levels of investment are not enough.
This report focuses on what states can do to ensure that adequate charging infrastructure is available. It first provides background on the number of PEVs needed to reduce GHG emissions from the transportation sector. It then discusses the charging infrastructure investment gap and provides policy recommendations to help close it.
The Center for American Progress estimated the number of vehicles and charging stations that the country will need to deploy by 2025 in order to meet its Paris Agreement targets, as well as the capital costs of installing the new public chargers needed. CAP found that:
- The United States needs to add 14 million new PEVs and more than 330,000 new public charging outlets by the end of 2025.
- Many states are well on their way to having the public Level 2 and DC fast charging infrastructure needed by 2025, but the country needs significantly more to meet the Paris Agreement goal. California, Colorado, Connecticut, Hawaii, Maryland, Nevada, Oregon, Vermont, and Washington state are leading the way.
- Existing state and VW funds can provide only about 50 percent of the funding needed to deploy adequate public charging infrastructure through 2025. Additional public resources and private investment are necessary to close the remaining $2.3 billion gap.
As states spend VW settlement funds, they will need to find new funding sources to continue progress into the midcentury. States should work with their utilities and legislatures to advance new investment mechanisms, as well as apply for federal grants and join or create revenue-generating carbon pricing programs. Additional private investment is also necessary, as is the extension of federal tax credits for EV charging infrastructure—which expired at the end of the 2017 tax year.
Cutting GHG emissions from the transportation sector
In its 2015 submission to the U.N. Framework Convention on Climate Change in accordance with the Paris Agreement, the United States committed to reducing GHG emissions 26 percent to 28 percent below 2005 levels by 2025.11 In 2005, the transportation sector was responsible for 27 percent of all U.S. GHG emissions, a figure that rose to 28.5 percent in 201612—the first year that transportation surpassed electricity to become the largest source of U.S. GHG emissions.13 Light-duty vehicles (LDVs) have consistently made up about 60 percent of the transportation sector’s emissions.14
EVs can help the United States reduce LDV emissions and move the country closer to its climate goals. Reducing LDV emissions by 16 percent below 2005 levels by 2025 would meet an ambitious national goal of a 26 percent reduction in the LDV sector—factoring in the approximately 10 percent reduction from the 2005 baseline that LDVs already achieved.15 CAP converted this reduction from a percentage to the specific number of vehicles and chargers needed to meet U.S. emissions goals.
Vehicles
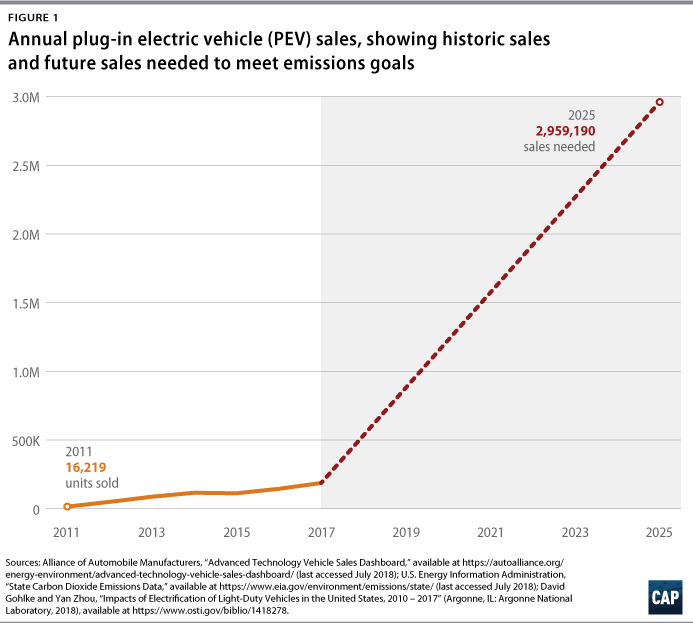
Estimating the number of PEVs needed to achieve emissions reduction goals in the LDV sector is a complex calculation that involves many assumptions. CAP’s analysis is based on a 2018 report by the Argonne National Lab16 that estimated carbon dioxide emission savings from PEVs as compared with those from an ICE vehicle in the 75th percentile for fuel economy in its class size and year—in other words, the ICE vehicle that a PEV would replace. (see Appendix for full methodology) Figure 1 shows the number of PEVs sold in the United States from 2011 through 2017, as well as the number of new PEVs needed through 2025 to achieve intended emissions reductions—assuming a linear increase in vehicles from 2017 through 2025. The United States needs to add nearly 3 million PEVs in the year 2025—and 14 million vehicles cumulatively from 2018 to 2025.
A national target of 14 million new PEVs is on par with existing commitments from states. In 2013, the governors of California, Connecticut, Maryland, Massachusetts, New York state, Oregon, Rhode Island, and Vermont signed a memorandum of understanding (MOU) that set a goal to have a collective 3.3 million zero-emissions vehicles—PEVs and another EV category, fuel cell EVs17—in their states by 2025.18 These states comprised a combined 26 percent of the U.S. vehicle market in 2017;19 thus, if all other states and Washington, D.C., strive for a similarly ambitious goal, the country could reach the 14 million vehicles needed to meet the Paris Agreement target.
Charging infrastructure
PEVs will require charging infrastructure to support them. The U.S. Department of Energy (DOE) has developed a new tool—EVI-Pro Lite—that uses data on personal vehicle travel patterns, EV attributes, and charging station characteristics to estimate the quantity and type of charging infrastructure necessary to support regional adoption of EVs.20 Based on the cumulative number of PEVs that CAP determined are needed in a given state, the DOE tool provides an estimate of that state’s charging infrastructure needs. (see Appendix for more information) CAP found that overall, the United States needs to deploy at least 330,000 new public charging outlets by 2025 to meet PEV demand. Figure 2 and Figure 3 show what percentage of Level 2 and DC fast chargers, respectively, each state already has compared with what CAP determined it will need through 2025. Only public Level 2 chargers and DC fast chargers are considered in this report, though states will need workplace and residential charging as well.
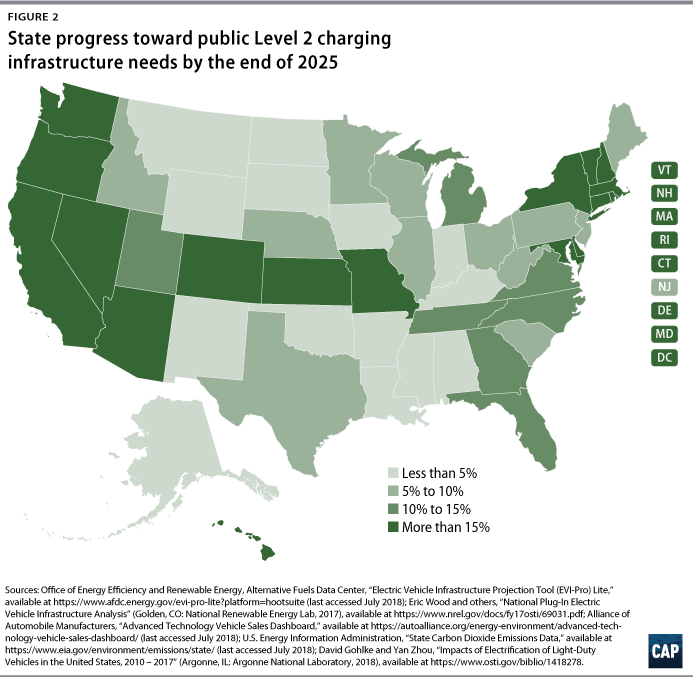
States have made varying amounts of progress toward their 2025 goals. California, Colorado, Connecticut, Hawaii, Maryland, Nevada, Oregon, Vermont, and Washington state are leading the way. These states have more than 15 percent of both the public Level 2 and DC fast chargers that CAP determines they will need for 2025. (see Figure 2 and Figure 3) Washington, D.C., has nearly all of the Level 2 chargers it needs to contribute to the United States’ emissions reduction goals, but no other state is above 50 percent. No state—including Washington, D.C.—has more than a third of the DC fast chargers needed by 2025, and Alaska and North Dakota still have no DC fast chargers.
Some regional trends are apparent from Figure 2 and Figure 3. Many states in the West, Midwest, and New England are particularly far ahead in terms of Level 2 charging deployment. (see Figure 2) The eight states working toward a collective 3.3 million zero-emissions vehicles on their roads—those that signed the 2013 MOU—each have more than 15 percent of the public Level 2 chargers that CAP determined they will need by 2025. To some extent, states with larger populations are further ahead on Level 2 charging, though notably, Missouri and Kansas have significant charging infrastructure. This progress largely can be attributed to Kansas City, which, driven by investments from Kansas City Power and Light Co., has seen a rapid and substantial increase in its number of EVs and charging stations in the past several years.21
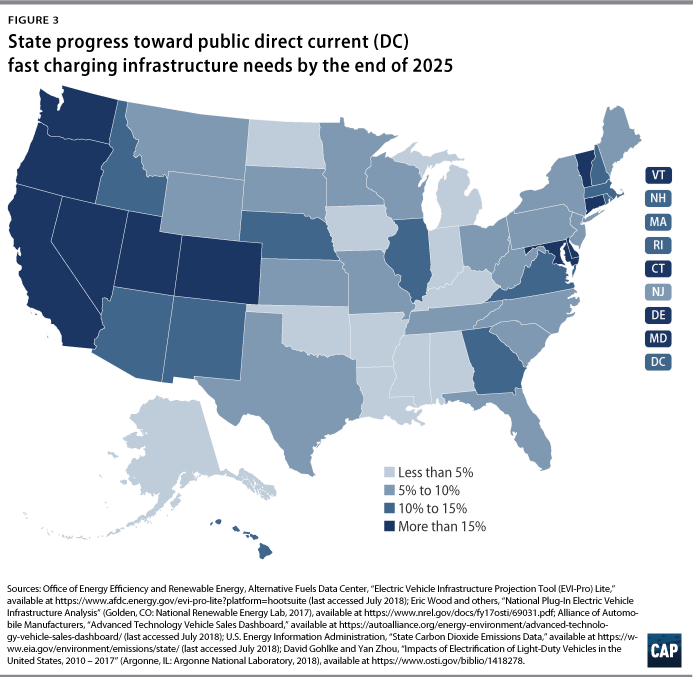
Many states in the West and Northeast already have more than 15 percent of the DC fast charging infrastructure that CAP determined they will need by the end of 2025. (see Figure 3) Some of the progress in the West is likely due to the Regional Electric Vehicle Plan for the West (REV West) and its goal to create an Intermountain West Electric Vehicle Corridor made up primarily of DC fast chargers. This corridor would “make it possible to seamlessly drive an electric vehicle across the Signatory States’ major transportation corridors.”22 Currently, the signatory states are Arizona, Colorado, Idaho, Montana, Nevada, New Mexico, Utah, and Wyoming.
The REV West and MOU states demonstrate that concerted policy effort can produce results. Yet, while many states are well on their way to having the public Level 2 and DC fast charging infrastructure that CAP determined they will need by 2025, significantly more investment is needed. The next section explores the funding currently available and what states still need to close the observed gaps in charging infrastructure.
The charging infrastructure investment gap
Figure 2 and Figure 3 demonstrate that there is a substantial gap between the amount of public Level 2 and DC fast chargers currently available and what is necessary to support the scale of PEV deployment needed to reach U.S. climate goals. Building the necessary chargers will require large-scale capital investment.
This report considers only the cost of the unit and installation and applies mean values for these costs across the country. (see Appendix for more detailed methodology) The capital costs of installing charging infrastructure can vary widely, reflecting region-, site-, and charger-specific costs, and installers may find ways to reduce the cost of purchasing and installing charging infrastructure. For example, they could select less expensive charger models, choose sites strategically, or plan for charging infrastructure in new building construction.
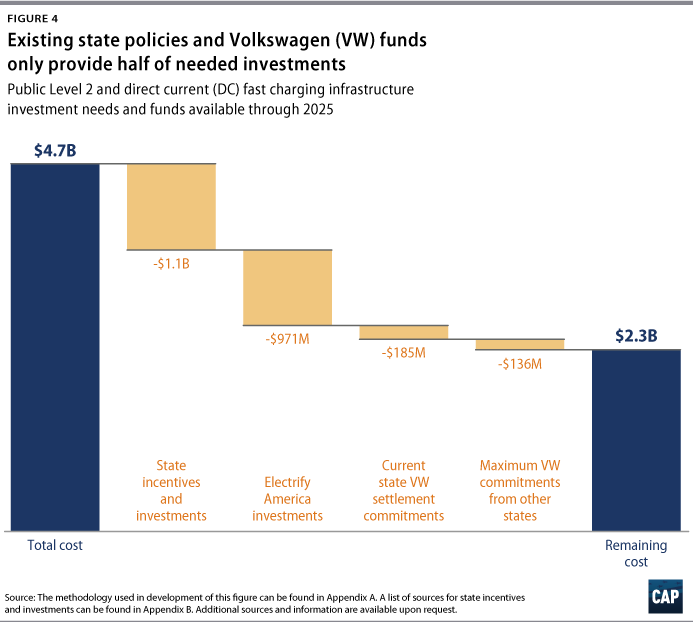
In order to purchase and install by 2025 the 330,000 new public Level 2 and DC fast charging outlets that CAP’s analysis determined are necessary, the country will need to spend a cumulative $4.7 billion through 2025. States have already found ways to fund nearly half of this through financial incentives and other investments and allocation of VW funds.
State-level financial incentives and investments
Existing state-level financial incentives and investments, if maintained, could provide about a quarter of the funding needed through 2025—an estimated $1.1 billion. States currently provide a variety of financial incentives for charging infrastructure, namely in the form of grants, tax credits, and rebates. Seventeen states have a financial incentive that lowers the cost of public Level 2 and DC fast chargers for installers.23 These incentives range from Washington state’s tax exemption for installation of chargers24 to New York state’s commitment of $250 million for charging infrastructure through 2025.25 These numbers are calculated based on CAP’s determination of a state’s charging infrastructure needs, though some states may invest more. New York state’s commitment, for example, will likely result in more chargers by 2025 than this analysis considers necessary—but the investment sets New York state and the country on a much-needed path to deep decarbonization by the midcentury.
VW settlement
Between 2016 and 2017, Volkswagen AG, Audi AG, Dr.-Ing. h.c. F. Porsche AG, Volkswagen Group of America Inc., Volkswagen Group of America Chattanooga Operations LLC, and Porsche Cars North America Inc.—known collectively as “Volkswagen”—agreed to settlements to resolve the federal government’s allegations that the company cheated emissions standards for oxides of nitrogen (NOx) under the Clean Air Act.26 Of the settlement funds, $2.7 billion will be used to establish an Environmental Mitigation Trust that states and territories may use over the next 10 years to invest in specific transportation projects proven to reduce NOx emissions. Each U.S. state and Washington, D.C., receive a specific allocation of funds. Of that, they may designate up to 15 percent to build EV charging infrastructure.27
At the time of publication, 18 states had finalized their mitigation plans detailing how they intend to spend their allocations.28 Seven states plan to spend the full 15 percent on charging infrastructure, and four states have elected to devote none of their funds to charging infrastructure. However, an additional 12 states in the draft plan phase have proposed allocating the full 15 percent. Figure 4 presents the cost reduction possible given that all states maintain their final or draft plan allocations, and all states in predraft phase commit the full 15 percent. This could reduce the total cost of charging infrastructure investments by $185 million and $136 million, respectively.
In addition to the Mitigation Trust, VW will also invest $2 billion over the next 10 years in charging infrastructure and in the promotion of zero-emission vehicles—including BEVs, PHEVs, and fuel cell EVs. Of the $2 billion, $800 million is to be spent in California and the remaining $1.2 billion will be invested in other states. VW established an organization, Electrify America, to manage the investments. Electrify America has detailed its spending plan for the California and national funds and has begun to build out infrastructure and improve educational outreach across the country.29
Figure 4 considers the impacts of funds managed by Electrify America on the total investment needed by the end of 2025. For its first cycle of investments—January 2017 through June 2019—in states outside California, Electrify America plans to spend $190 million on DC fast chargers and $40 million on community charging, including public Level 2 chargers.30 In this first cycle, these investments will be in several cities: Boston; Chicago; Denver; Houston; Miami; New York City; Philadelphia; Portland, Oregon; Raleigh, North Carolina; Seattle; and Washington, D.C.31
Considering other infrastructure
This report covers a small piece of the charging infrastructure landscape; additional research and investment is needed in workplace charging and residential charging. According to CAP’s analysis, the United States needs nearly 500,000 workplace chargers by the end of 2025. There is no comprehensive data set, however, that tracks the number of workplace chargers in the United States already to determine how close states are to this target. For comparison, the DOE’s Workplace Charging Challenge aimed to partner with 500 employers who commit to providing their employees with access to charging by 2018. By the end of 2016, partners had planned to install nearly 7,500 stations.32
Putting 14 million new PEVs on the road by 2025 also will require additional home charging capacity. Using the DOE EVI-Pro Lite tool, CAP estimates that the country will need nearly 13 million additional home chargers by 2025. As with workplace charging, data gaps exist for residential charging. And while there are a variety of state programs to fund workplace and residential charging, without these data, it is difficult to know to what extent policy should support development in these sectors.
Policy recommendations
Existing state incentives and funds from the VW settlement can only provide about half of the United States’ public charging infrastructure needs through 2025. According to CAP’s analysis, states need additional public resources and private investment to close the remaining gap of $2.3 billion. This funding should come from a combination of increased federal, state, and local ambition, as well as the private sector.
Increase state ambition
The easiest way states can fund charging infrastructure is to fully utilize the funds available to them through the VW Mitigation Trust. Combined with planned allocations in final and draft plans, the total cost of necessary investments could be reduced by $322 million if all states in the predraft phase of their mitigation plans commit all funds available.
Yet, as states spend the VW settlement funds, they need to establish an alternative funding source to continue progress into the midcentury. Even after taking into consideration VW funds and state-level financial incentives, there is still a $2.3 billion gap by 2025. After 2027—the end of the Electrify America investment cycles and the expiration of Mitigation Trust funds—the country will need to find a new way to fund investments in charging infrastructure deployment.
States could do the following to increase funding for charging infrastructure:
- Work with state legislatures to provide financial incentives for charging infrastructure. California, for example, has continually increased ambition and innovated around charging infrastructure funding and financing. These efforts have resulted in the state already reaching more than 40 percent of the public Level 2 charging it needs by 2025. In fiscal year 2017, California allocated $17 million to charging infrastructure and about the same in fiscal year 2018. However, after using the DOE’s EVI-Pro Lite model to analyze the charging infrastructure needed to match the state’s vehicle deployment goals, California plans to invest $134.5 million in fiscal year 2019—and Gov. Jerry Brown (D) has set ambitious targets for the state’s future spending.33
- Work with utilities to provide financial incentives for and to invest in charging infrastructure. Utilities can facilitate the PEV revolution by directly investing in charging infrastructure. States should work to engage utilities and eliminate regulatory barriers that may preclude their investment. Chargers can provide revenue for the utility and at the same time allow for the much-needed deployment of clean transportation solutions. The role of the utility in financing and operating charging infrastructure is being actively debated in states across the country and many public utility commissions are starting to permit the rate-financing of charging infrastructure.34 For example, Ohio regulators approved a rate plan for American Electric Power Company in April 2018 that allows the utility to provide rebates aimed at deploying 300 public Level 2 charging stations and 75 DC fast charging stations.35
- Join or start a carbon pricing program that generates revenue that could be used for charging infrastructure. Delaware, for example, is a member of the Regional Greenhouse Gas Initiative (RGGI) and uses a portion of the money it receives from RGGI to fund rebates for chargers and a competitive grant program for DC fast chargers.36 In most existing and proposed programs, states have flexibility in determining how revenue is used.
- Direct state departments of transportation to consider ways to incorporate charging infrastructure into their investment plans. State departments of transportation could investigate their use of the Federal Highway Administration’s Congestion Mitigation and Air Quality (CMAQ) Program funds—specifically, how they could be used for charging infrastructure. CMAQ provides reliable funding to all states to improve air quality, and the funds may be used to establish charging infrastructure.37 The North Florida Transportation Planning Organization used $450,000 of its CMAQ funding to expand a network of Level 2 and DC fast chargers.38 State departments of transportation generally choose to use their CMAQ money to fund projects that improve traffic flow and provide transit options,39 but they could dedicate more funding to charging infrastructure instead.
- Apply for federal grants for charging infrastructure. The U.S. Department of Transportation’s Better Utilizing Investments to Leverage Development (BUILD) Transportation Discretionary Grant program40 can be used for charging infrastructure. This program was formerly known as the Transportation Investment Generating Economic Recovery (TIGER) Discretionary Grant program. Although program funds are limited and competition is fierce, states should consider applying for funds for charging infrastructure projects or for larger projects that include charging infrastructure. The Georgetown Climate Center in Washington, D.C., has compiled a list of federal funds potentially available for use in charging infrastructure deployment.41
Leverage private investments
The private sector must be an integral partner in order to deploy the EV charging infrastructure needed to meet the United States’ carbon goals. Private companies play an active role in building charging infrastructure—from installing it at workplaces to owning and operating it as a core business to installing it for use by the company’s vehicles. Most of the state- and utility-sponsored financial incentives are used by private companies.
On the workplace side, businesses outside the EV industry can play an important role in closing the gap, though this report does not fully investigate this. Companies can also help provide other publicly accessible charging infrastructure, such as at malls. Installing charging infrastructure at malls allows PEV owners to charge while shopping, eating, and resting, as well as provides mall owners with an additional marketing tool and a revenue source.42 The Simon Property Group, one of the largest outlet mall owners, has an expanding network of 466 chargers in 20 states.43 Like malls, others in the retail industry such as big-box stores and supermarkets are also beginning to see the value in investing in public chargers.44 At the end of fiscal year 2017, Walmart had installed more than 300 stations45—the same number of stations Kroger had installed by April 2013.46 Kroger, Walmart, Sam’s Club, Costco, and Safeway were the top big-box stores or supermarkets selling gasoline in 2016,47 and it is not hard to imagine these stores profiting similarly from investments in public charging infrastructure. Although the current scale of investments is small, as demand grows, malls and large retailers could be a major source of investment in public charging.
EVgo and other companies that operate charging stations are also building additional stations. EVgo has installed and now operates more than 1,050 DC fast chargers across the country; the company opens a new station every six to eight weeks.48
Tesla is somewhat of an anomaly in the EV space. All commercially available PEVs can generally use the same Level 1 and Level 2 charging equipment,49 but Tesla has a proprietary plug and DC fast charger called the Supercharger that can only be used by Tesla’s vehicles. (see Table 1)50 Both Tesla and non-Tesla vehicles and chargers are included in this analysis. Other automakers currently provide just vehicles and rely on others to build the infrastructure; Tesla is installing infrastructure itself for use by Tesla customers.51 The Union of Concerned Scientists provides an interesting map of Tesla charger locations compared with non-Tesla stations that demonstrates Tesla’s strategy of placing chargers across the country, compared with other stations, which tend to be clustered in large metropolitan areas.52
Many states and utilities have financial incentives that are specifically applicable to businesses installing charging infrastructure. Public and private sector entities should work together to close the cost gap.
Extend federal tax credits
Extending the federal tax credits for PEV charging infrastructure is a key way to reduce the public Level 2 and DC fast charging infrastructure funding gap. The Energy Policy Act of 2005 authorized tax credits for the alternative fuel vehicle refueling property credits—known as the 30C tax credits for their location in the U.S. code—which allowed businesses and individuals to receive tax credits for the installation of EV charging infrastructure.53 For individuals, tax credits are 30 percent of the cost of the unit and installation, up to $1,000; for businesses, they are 30 percent of the cost of the unit and installation, up to $30,000. The 30C credits were extended in the Tax Cuts and Jobs Act passed in February 2018 but only retroactively for purchases made in 2017. Although the original Senate bill contained an extension for 2018, this was not in the final legislation, and reauthorization for future tax years is uncertain.54 If the tax credit were to be extended, a significant portion of the funding gap for 2025 could be eliminated.
Conclusion
Reducing emissions from the United States’ transportation sector will require a multibillion-dollar investment in a new, electrified system. Not accounting for operations and maintenance, the investments needed to simply build out the public Level 2 and DC fast charging infrastructure portion of the system are large but manageable. Many states are making clear progress toward having the infrastructure they will need in the near future, and current state incentives and funds available from the VW settlement can provide half of the funds needed by 2025. With increased commitment from governments and the private sector, finding the additional 50 percent—$2.3 billion—is an attainable goal.
About the author
Lia Cattaneo is a research associate for Energy and Environment Policy at the Center for American Progress.
Acknowledgments
The author would like to thank Luke Bassett, Alison Cassady, Kristina Costa, and Nyah Spearman for their contributions. This report was also improved with input from many partners in federal, state, and local governments, as well as others in the public and private sectors.
*Correction, July 30, 2018: This report has been updated to correctly state the year during which there were 8,000 fossil fuel-propelled cars.
Appendix A
This section details the methodology and assumptions used in this report.
Getting to emissions goals
Vehicles
The first step in this analysis was to identify the emissions reductions needed from the transportation sector in order to make progress toward U.S. emissions reduction goals.
A variety of sources exist documenting the GHG emissions from transportation.55 This analysis used the total of state-level transportation emissions data from the U.S. Energy Information Administration from 2005 and 2015 since the data set provides a state-by-state breakdown.56 The U.S. Environmental Protection Agency (EPA) estimates that LDV emissions made up 62 percent of transportation emissions in 2005 and 60 percent in 2015.57 Combining these estimates, CAP determined that there was a 10 percent reduction in LDV emissions in the United States from 2005 to 2015. In order to reduce emissions 26 percent below 2005 levels—the upper bound of the United States’ intended nationally determined contribution submitted to the U.N. Framework Convention on Climate Change58 as part of the Paris Agreement—an additional 16 percent, or 195.8 million metric tons of carbon dioxide equivalents, is needed.
Estimating the number of vehicles needed to achieve a given emissions reduction is a complicated task that could include estimating vehicle miles traveled, fuel efficiency of the entire fleet of vehicles on the road, vehicle retirement rates, and more. To avoid making so many assumptions, CAP relied on data from an Argonne National Lab study that estimated the carbon dioxide savings from PEVs for 2011 through 2017, compared with equivalent ICE vehicles.59 This analysis assumed the 2014 U.S. national grid average for electricity and compared each vehicle with the 75th percentile ICE vehicle for fuel economy in its class size in each year—in other words, the ICE vehicle that a PEV would have replaced. The relationship between total number of PEVs sold in a given year and carbon dioxide reduction achieved fits best to a power function (R2 = 0.97). This relationship was used to determine the PEV sales needed in 2025 to achieve the desired emissions reduction.
CAP assumes that the full curve is likely to be sigmoidal, approaching the total number of LDVs sold in the United States—15.9 million in 2017.60 Therefore, a power function is appropriate for relatively low PEV sales, in this case less than one fifth of total yearly sales. This approach is somewhat conservative if the emissions-intensity of the grid improves and ICE vehicles do not improve as much. According to news reports, the Trump administration is expected to freeze fuel efficiency and carbon emission standards at 2020 levels through 2026.61
CAP allocated the total vehicles needed in 2025 to states based on the states’ percentage of U.S. transportation emissions in 2005. For each state, CAP calculated the number of vehicles needed in each year from 2018 through 2024, assuming a linear path from the number of PEVs sold in the state in 2017 and the number needed in 2025. Then, CAP calculated for each state a cumulative number of vehicles on the road—starting from 2011, given available data62—by the end of 2025.
The DOE’s EVI-Pro Lite tool uses data on personal vehicle travel patterns, EV attributes, and charging station characteristics to estimate the quantity and type of charging infrastructure necessary to support regional adoption of EVs.63 Given the cumulative number of PEVs needed in a state, the tool provides the estimate of the state’s charging infrastructure needs that was used in this report.
EVI-Pro Lite does not allow the user to input a number of PEVs that is greater than 10 percent of LDVs for the state. This was only a problem for Alaska. Using the methods detailed, Alaska needs a cumulative 126,360 PEVs in 2025, but the maximum allowable under the calculator is 64,859. The latter value was used in the calculations for 2025. Originally, CAP’s calculations required EVs to generate a 15.87 percent decrease in LDV emissions in order to achieve a 26 percent overall reduction in the sector, factoring in existing progress from 2005. Working backward, this change in Alaska’s PEV sales results in a 15.72 percent reduction in U.S. LDV emissions, for a total emissions reduction of 25.85 percent below 2005 levels by 2025.
Charging infrastructure
The EVI-Pro Lite tool was used to determine the number of public Level 2 and DC fast chargers needed in each state to support the PEVs needed through 2025. In all states, CAP assumes:
- There is a constant PEV mix of 15 percent 20-mile electric range PHEVs; 35 percent 50-mile electric range PHEVs; 15 percent 100-mile electric range BEVs; and 35 percent 250-mile electric range BEVs. This is the default provided in EVI-Pro Lite and similar to the modeling assumptions made in the DOE’s “National Plug-In Electric Vehicle Infrastructure Analysis.”64
- PHEVs rely partially—half of full support—on gasoline. This is the default provided in EVI-Pro Lite and the same assumption made in the DOE’s “National Plug-In Electric Vehicle Infrastructure Analysis.”65
- The share of drivers with access to home charging is 88 percent. This is the default provided in EVI-Pro Lite and the same assumption made in the DOE’s “National Plug-In Electric Vehicle Infrastructure Analysis.”66
Additionally, the EVI-Pro Lite tool does not have functionality for predicting changes over time because of improvements in technology, so all outputs are the same regardless of the year assumed.
For each state, the number of vehicles needed through 2025 was input into the calculator and the results were recorded. The calculator also provides the DOE’s count of existing charging plugs, sourced from its alternative fuel station locator.67 Except for the Washington, D.C., all data were collected on June 25, 2018, so that the count of existing charging plugs was consistent across states. The Washington, D.C., did not have any existing plugs reported in the calculator, but there were plugs reported in the alternative fuel station locator; the plugs for Washington, D.C., were recorded on July 2, 2018.
This analysis calculated the gaps between each state’s existing Level 2 and DC fast charging infrastructure and its needs for those charger types through 2025.
The charging infrastructure investment gap
The DOE has studied the cost of purchasing and installing charging infrastructure.68 It reports an average unit cost of $3,000 to $6,000 for public Level 2 chargers and $10,000 40,000 for DC fast chargers. Costs can vary widely given a variety of factors, including—but not limited to—the communications; access control; point of sale; energy management and demand response capabilities; and automated diagnostic capabilities of the unit. The DOE estimates that the installation costs for public Level 2 chargers vary from $600 to $12,700 with an average of $3,000 per port. The installation costs for a dual-port DC fast charger vary from $4,000 to $51,000, with an average of $21,000. These ranges are wide, reflecting region-, site-, and charger-specific costs. For example, the DOE found that among major cities, installation costs in Atlanta were more than double those in Washington, D.C., due to differences in electric cord lengths and wall-mounting units versus pedestal units. Aesthetic choices could potentially increase prices, too, more than doubling the installation cost in some cases.
Most costs are estimated per plug. For those that are not, the DOE notes that stations with multiple ports may have a price higher than the ranges provided.69 The DOE report also notes a typical breakdown of installation costs, noting that taxes account for about 5 percent of the cost. This value was used to determine the value of Washington state’s tax exemption policy.70
CAP used the mean value for the unit and installation costs of charging infrastructure, though a wider range of costs is likely to be observed.
State-level financial incentives and investments
Seventeen states have a financial incentive that lowers the cost of public Level 2 and DC fast charger installation. (see Appendix B for citations used in these calculations) Some states have incentives that provide a percentage of the unit plus installation cost of the charging infrastructure, up to a certain value. Others provide a flat percentage with no total cost cap, while Rhode Island provides all costs up to a total. Washington state provides an exemption for the taxes associated with installing a charger. Some states, often with the help of their utilities, have committed to investing large amounts of money in charging infrastructure.
Many utilities are involved in charging infrastructure investments. Some plan to invest a total amount of money and others offer deals to customers who purchase charging infrastructure. CAP considered utility investment plans, such as Massachusetts’, that provide details about the number of chargers that the utility will deploy. CAP did not consider utility incentives for customers, since those cannot be applied to investment needs across the state. Yet, although these incentives—such as Rocky Mountain Power’s71—are not included here, they will be important for reducing the 2025 cost gap.
These investments and incentives were applied to the costs applicable in each state. For example:
- Georgia provides the lesser of 10 percent or $2,500 of the unit and installation costs; Georgia needs 10,073 Level 2 chargers and 2,063 DC fast chargers by the end of 2025. The average cost for the unit and installation is $7,500 for a Level 2 charger and $46,000 for a DC fast charger. With the tax credit, these costs are reduced to $6,750 and $43,500, respectively, for a total combined cost of $157,733,250.
- Maryland provides 50 percent of DC fast charger project costs—up to $55,000 with a maximum amount of $500,000 through fiscal year 2019. The state also provides rebates of 40 percent of the cost of the unit and installation—up to $5,000—which was applied to the remaining costs for Level 2 and DC fast chargers, respectively, after subtracting $500,000 from the DC fast charger total.
- New Jersey-based utility Public Service Enterprise Group recently committed to investing $300 million in the state by 2025 to set up a network of up to 50,000 charging stations in residential areas, at workplaces, and along traffic corridors. The utility’s reports do not indicate how it intends to allocate funding to each charging type. Since New Jersey’s combined workplace, Level 2, and DC fast charging gap is half of what the state plans to install, CAP assumes all need is met through this program.
VW settlement
The EPA provides information about the amount of funding each state may receive under the Mitigation Trust.72 Proposed usage of Mitigation Trust funds is detailed in each state’s mitigation plan. CAP reviewed state plans to determine how much funding states will or plan to allocate toward installation of light-duty PEV charging infrastructure.73
Electrify America’s spending plans for the California and national funds74 indicate that for the first cycle of investments—January 2017 through June 2019—Electrify America will spend $190 million on DC fast charging, $40 million on community charging, and $25 million on public education nationwide;75 in California, it plans to spend $75 million on DC fast charging, $45 million on community charging, $20 million on public education, and $44 million on PEV and fuel cell electric vehicle access initiatives.76 CAP assumes community charging will mostly be public Level 2 chargers and that these spending ratios remain relatively constant in investment cycles through 2025. The same assumptions are made for California’s investment plan. While investments are geographically restricted in the first investment cycle, CAP assumes that by the end of the settlement’s 10-year investments, funding will be allocated across the country.
Appendix B
The following is a list of references used in the calculations of state-level financial incentives and investments.
California Air Resources Board, “Charging Equipment Costs,” available at https://www.driveclean.ca.gov/pev/Costs/Charging_Equipment.php (last accessed July 2018).
California Energy Commission, “Alternative and Renewable Fuel and Vehicle Technology Program Proceedings,” available at http://www.energy.ca.gov/altfuels/ (last accessed July 2018).
California Energy Commission, “Workshops, Notices, and Documents: 2018-2019 Investment Plan Update for the Alternative and Renewable Fuel and Vehicle Technology Program” (2018), available at http://www.energy.ca.gov/altfuels/2017-ALT-01/documents/.
Clean Air Fleets, “Charge Ahead Colorado,” available at http://cleanairfleets.org/programs/charge-ahead-%20colorado (last accessed July 2018).
Daniel Gatti, “More Electric Vehicle Infrastructure Coming to Massachusetts,” Union of Concerned Scientists, December 1, 2017, available at https://blog.ucsusa.org/daniel-gatti/more-electric-vehicle-infrastructure-coming-to-massachusetts.
Emma Foehringer Merchant, “California Regulators Approve Landmark Utility EV-Charging Proposals,” Greentech Media, May 31, 2018, available at https://www.greentechmedia.com/articles/read/california-cpuc-approves-landmark-ev-charging-proposals#gs.vLJCIL0.
Fixr, “Home Electric Vehicle Charging Station Cost,” available at https://www.fixr.com/costs/home-electric-vehicle-charging-station (last accessed July 2018).
Georgia Environmental Protection Division, Air Protection Branch, “Alternative Fuels and Tax Credits,” available at https://epd.georgia.gov/air/alternative-fuels-and-tax-credits (last accessed July 2018).
James M. O’Neill, “PSEG plans $3 billion in energy efficiency projects and 50,000 vehicle charging stations,” NorthJersey.com, June 1, 2018, available at https://www.northjersey.com/story/news/2018/06/01/pseg-plans-3-billion-plan-save-energy-use-and-add-charging-stations/661213002/.
Jeffrey Tomich, “AEP approved for EV-charging rebates as part of Ohio rate plan,” E&E News, April 26, 2018, available at https://www.eenews.net/energywire/2018/04/26/stories/1060080157.
Louisiana Department of Revenue, “Alternative Fuel Credit: Title 61, Section 1913,” available at http://revenue.louisiana.gov/LawsPolicies/2012_12RevenueRule.pdf (last accessed July 2018).
Maryland Energy Administration, “Guidelines for Alternative Fuel Infrastructure Program” (2018), available at http://energy.maryland.gov/transportation/Documents/Guidelines.pdf.
Maryland Energy Administration, “Electric Vehicle Supply Equipment (EVSE) Rebate Program 2.0,” available at http://energy.maryland.gov/transportation/Pages/incentives_evserebate.aspx (last accessed July 2018).
Missouri Department of Economic Development, Division of Energy, “Missouri Alternative Fuel Infrastructure Tax Credit,” available at https://energy.mo.gov/assistance-programs/missouri-alternative-fuel-infrastructure-tax-credit (last accessed May 2018).
Nevada Public Utilities Commission, “Agenda 12-18; Item No. 3-C Draft Order for discussion at utility agenda,” June 19, 2018, available at http://pucweb1.state.nv.us/PDF/AxImages/DOCKETS_2015_THRU_PRESENT/2018-2/30912.pdf.
New York Power Authority, “EVolve NY,” available at https://www.nypa.gov/innovation/programs/evolveny (last accessed July 2018).
Office of Governor Andrew M. Cuomo, “Governor Cuomo Announces $250 Million Initiative to Expand Electric Vehicle Infrastructure Across New York State,” Press release, May 31, 2018, available at https://www.governor.ny.gov/news/governor-cuomo-announces-250-million-initiative-expand-electric-vehicle-infrastructure-across.
Office of Tax and Revenue, “Alternative Fuel Vehicle Infrastructure and Conversion Credits FAQs: Individual Income, Corporate and Unincorporated Franchise Taxes” (Washington: Government of the District of Columbia, 2014), available at
https://otr.cfo.dc.gov/sites/default/files/dc/sites/otr/publication/attachments/AlternativeFuelVehicleInfrastructureandConversionCreditsFAQs.pdf.
Personal communication from Ashley Arax, air pollution specialist, California Air Resources Board, July 18, 2018.
Personal communication from Mark Brady, energy efficiency specialist, Nevada Governor’s Office of Energy, July 13, 2018.
State of Rhode Island Office of Energy Resources, “Charge Up!,” available at http://www.energy.ri.gov/transportation/ev/charge-up.php (last accessed July 2018).
Texas Emissions Reduction Plan, “Alternative Fueling Facilities Program (AFFP): Request for Grant Applications (RFGA), Fiscal Year 2018-2” (Austin, TX: Texas Commission on Environmental Quality, 2018), available at https://www.tceq.texas.gov/assets/public/implementation/air/terp/FY18_2_AFFP_RFGA_FINAL.pdf.
U.S. Department of Energy’s Office of Energy Efficiency and Renewable Energy, Alternative Fuels Data Center, “State Laws and Incentives,” available at https://www.afdc.energy.gov/laws/state (last accessed June 2018).
Washington State Department of Revenue, “Electric vehicle batteries and electric vehicle infrastructure (charging stations) – sales/use tax exemption, leasehold tax exemption,” available at https://dor.wa.gov/content/electric-vehicle-batteries-and-electric-vehicle-infrastructure-charging-stations-salesuse-tax-exemption-leasehold-tax-exemption (last accessed July 2018).