Solar energy has become a tangible solution to rising electricity costs and carbon emissions for many Americans. Declining installation prices and solar-friendly policies in many states have led to tremendous growth in rooftop solar installations. In 2013, residential solar photovoltaic, or PV, capacity increased 60 percent over the previous year, reaching 792 megawatts. Today, a new solar power system is installed every four minutes in the United States.
The rooftop solar phenomenon took off in states such as California, Arizona, and New Jersey—the three largest U.S. solar markets—and has been spreading, albeit at a slower pace, to other states. Maryland, Massachusetts, and New York, for example, are developing strong residential solar markets, but the number of residential installations in each state is less than half of the total residential installations in Arizona and New Jersey and less than 10 percent of the total residential installations in California.
Residential solar photovoltaic systems—also referred to as “rooftop solar” in this issue brief—consist of an array of solar panels that generate electricity from sunlight and can either connect to the electric grid or be used solely onsite by the system owner.
Last year, the Center for American Progress released an issue brief titled “Solar Power to the People: The Rise of Rooftop Solar Among the Middle Class,” which found that rooftop solar systems were being overwhelmingly adopted in middle-class neighborhoods with median incomes ranging from $40,000 to $90,000 in Arizona, California, and New Jersey. This issue brief explores the income make-up of rooftop solar adopters in the developing markets of Maryland, Massachusetts, and New York.
Interestingly, these emerging residential solar markets have some similarities to—as well as some marked differences with—the more established solar markets, such as California and New Jersey, in terms of the income characteristics of solar energy system owners. New York and Massachusetts have followed rooftop solar adoption trends similar to those of more developed markets, with more than 80 percent of residential solar installations in New York and nearly 70 percent of residential installations in Massachusetts occurring in ZIP codes with median incomes ranging from $40,000 to $90,000. Maryland, however, has not followed the same pattern, as just 45 percent of its residential solar installations have occurred within neighborhoods in the $40,000–$90,000 median income range.
In this issue brief, we present the findings of our rooftop solar adoption analysis in each state and then discuss the importance of good solar policies, including the effect they can have on whether middle- and low-income residents take advantage of solar technologies.
Rooftop solar adoption in Maryland, Massachusetts, and New York
Maryland, Massachusetts, and New York are a few of the up-and-coming residential solar markets in the United States. “Solar Power to the People” hypothesized that the more established residential solar markets—including California, Arizona, and New Jersey—would provide important insights into the way that rooftop solar is being adopted in other states. This theory holds true for Massachusetts and New York, but the income characteristics of residential solar customers in Maryland deviated somewhat from the more mature markets.
Comparison of emerging markets
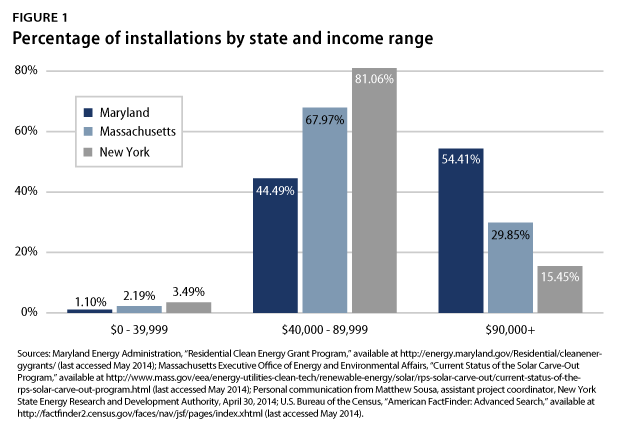
We analyzed residential solar installations within each ZIP code and their corresponding median household incomes to determine the distribution of installations by income level and state. (see Figure 1) Of the three states, Maryland has the lowest percentage of residential installations in the $40,000–$90,000 range at just 44.5 percent; New York and Massachusetts have more than 80 percent and 67 percent, respectively, of installations in this range.
To understand whether the distribution of installations follows the population distribution, we plotted the number of installations and the number of households in one graph for each state. (see Figure 2) In these graphs, the number of households should be used as a point of reference, rather than as a direct comparison to installations. For example, if the number of households peaks at a certain income range, one would expect the number of installations within that range to peak if the distribution of installations was following the same pattern as household distribution. In other words, if there are more households in the $50,000–$60,000 range, one might expect there to be more installations in that range as well.
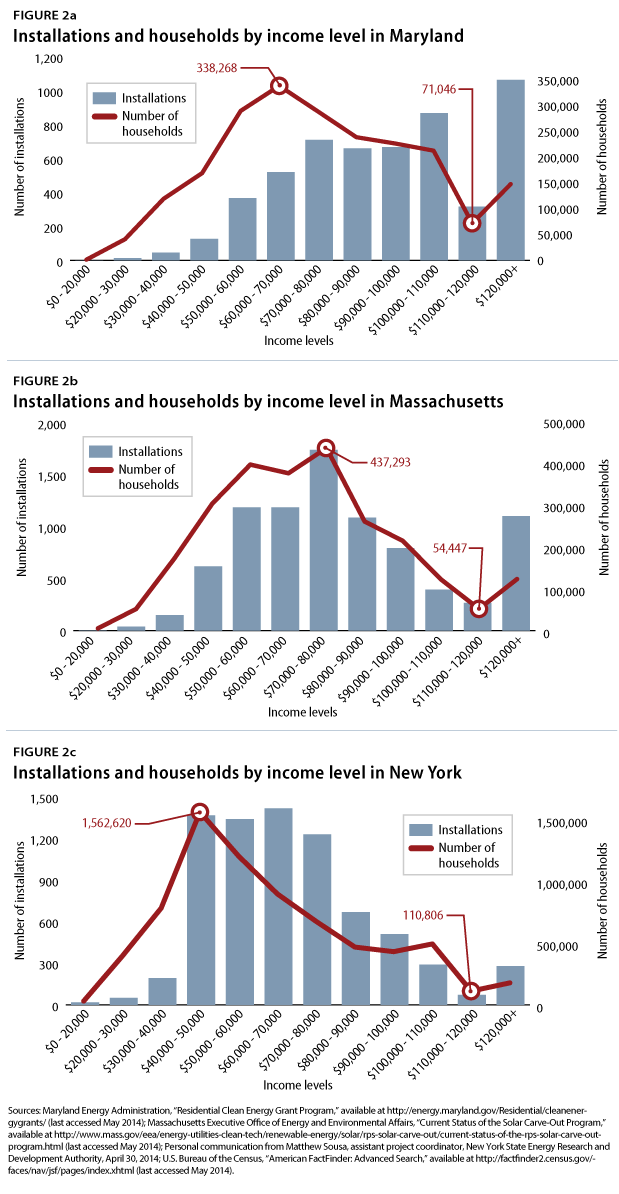
Massachusetts provides a good example of how the adoption of rooftop solar across income levels can follow household distribution almost perfectly, with residential installations spread fairly evenly over the population. Rooftop solar adoption in New York follows household distribution at the lower and higher ends of the spectrum, but installations are more heavily concentrated compared to population in the middle-income levels. In Maryland, residential solar installations follow a similar pattern to household distribution but are skewed more toward the higher income brackets.
We also examined the growth of rooftop solar installations across income levels in each state by year since 2009. (see Figure 3)
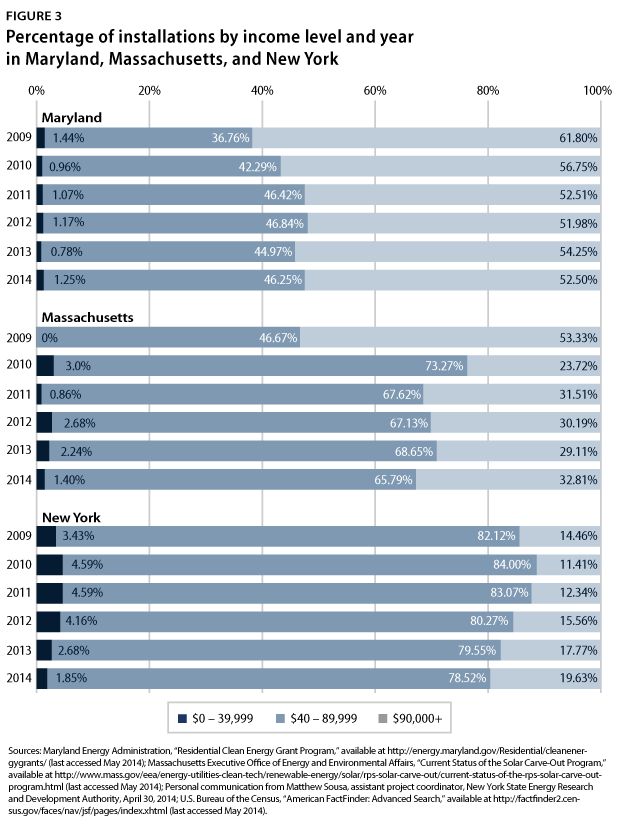
While rooftop solar installations in areas with median incomes ranging from $40,000 to $90,000 have increased in both Maryland and Massachusetts since 2009, they have not followed the same year-over-year growth trend as residential installations in middle-class neighborhoods in the more developed markets. In New Jersey, for example, the percentage of installations occurring in neighborhoods with median incomes in the $40,000–$90,000 range increased steadily every year from 2009 to 2012—rising from 55.9 percent in 2009 to 65.5 percent in 2012. In Maryland and Massachusetts, residential installations in middle-class neighborhoods have not shown the same predictable upward pattern over the past five years. Similarly, New York’s rooftop solar installations in the $40,000–$90,000 range have hovered around 80 percent since 2009.
Other findings
Through this analysis, we also identified the areas that experienced the most growth from 2012 to 2013 among the three emerging solar markets. In Massachusetts and Maryland, the highest percentage increase in annual residential installations from 2012 to 2013 occurred in neighborhoods with median incomes ranging from $40,000 to $50,000. Massachusetts saw a 106 percent increase within that income range—from 162 installations in 2012 to 334 installations in 2013. Maryland’s residential installations within the $40,000–$50,000 income range grew from 26 installations in 2012 to 34 installations in 2013—a 31 percent increase. In New York, residential installations that fell within the $110,000–$120,000 income range saw the highest percentage growth, from 12 installations in 2012 to 35 installations in 2013—a 192 percent increase.
Although it is difficult to tie the findings from our analysis to particular policies, it is clear that policy plays an important role in the accessibility and affordability of rooftop solar. The next section discusses the impact that good solar policies can have on residential solar markets and highlights policies that could ensure that even more middle- and low-income households have access to solar technology.
Policy is critical
Policy has been integral to developing strong solar markets, and states that are able to capture all of the economic and environmental benefits that solar technology can provide will be better positioned to meet current and future renewable energy targets, as well as carbon-emissions standards.
California has established itself as a leader in energy and environmental policy in the United States and should be a model for other states on how to effectively scale rooftop solar installations. Under solar policies, such as the California Solar Initiative, or CSI—which has provided rebates to residential and nonresidential solar customers of the three major investor-owned California utilities since 2007—the Golden State has seen incredible solar growth and has become the largest residential solar market in the country. Case in point: California went from about 2,000 residential solar installations registered in the CSI database in 2007 to more than 90,000 residential installations today.
Maryland, Massachusetts, and New York have not come close to the number of residential installations in California but have implemented several policies that could help them eventually get there. (see Table 1)
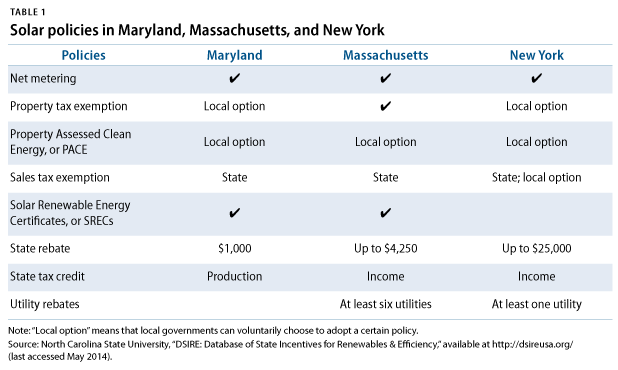
The solar policies listed in Table 1 have been effective tools to encourage solar adoption and increase its affordability. Net metering is a state policy that allows rooftop solar system owners to receive credit on their electric bills for any excess power that they generate beyond what they use onsite, which can shorten the payback period for a residential solar photovoltaic system. Because rooftop solar systems are essentially taxable property, many states and municipal governments have exempted them from local property tax and sales tax to keep related costs low. Property Assessed Clean Energy, or PACE, programs allow homeowners to borrow money from local governments to finance PV systems or energy-efficiency upgrades. These low-interest, municipal loans are then typically repaid through a special assessment on the owner’s property tax bill. Solar Renewable Energy Certificates, or SRECs, provide a market-derived credit for every 1,000 kilowatt hours of electricity generated from solar PV systems, which system owners can sell upfront or over time to reduce their system’s cost. State tax incentives provide tax credits based either on the cost of the system or on the amount of electricity produced by the system, lowering a system owner’s tax bill at the end of the year.
These policies are vital to the affordability of rooftop solar and its continued growth among middle- and lower-income residents. Although solar installation costs have dropped dramatically over the past few years, the average cost for a 5-kilowatt system—the typical size of a residential solar power system—in Maryland is currently about $23,250. Without rebates and other solar policies, it would be extremely difficult for middle- and low-income Maryland households to purchase a system outright.
Even with rebates and tax incentives, it can be challenging to pay the upfront costs, as processes to claim rebates can take months and tax credits can only be realized during the following year’s tax season. Solar leasing programs have helped address this issue by reducing or eliminating the upfront costs, but they are not available in every state, and not every household can meet the minimum credit score of 680 or 700—depending on the state—needed to qualify for a lease. State green banks and financing authorities, which help facilitate private-sector financing for clean energy projects, could begin to fill the gap by offering or backing solar leases and loans for those with lower credit scores, but these financing authorities currently only exist in Connecticut, California, Hawaii, Massachusetts, and New York. Connecticut’s green bank provides solar leases to residents with credit scores as low as 640.
An example of an effective state initiative that is currently making rooftop solar affordable for low-income residents is California’s Single-family Affordable Solar Homes, or SASH, program, which was established as part of a 2006 law that directs 10 percent of CSI funding toward helping low-income households access solar technology. Managed by nonprofit solar contractor GRID Alternatives, the program provides free or low-cost solar PV systems to low-income homeowners and has leveraged private-sector investment and community volunteers to install 3,684 PV systems to date. This type of program is needed in other states to ensure that low-income communities can access rooftop solar.
Regardless of the income level of those taking advantage of solar technology, the benefits that rooftop solar power systems provide to the electric grid are the same: reduced transmission and distribution costs; avoided fuel costs; decreased demand during peak periods, or the periods when electricity is more expensive, in certain regions; and an energy source with zero carbon emissions. This is important to consider, especially as some utilities are calling for policies, such as net metering, to be altered or eliminated entirely based on the assertion that rooftop solar system owners are not paying their fair share for use of the electric grid.
Because of net metering and other solar policies, rooftop solar is within reach for many Americans. Smart solar policies and programs have made solar technologies more accessible and have empowered households across the country to invest in a clean energy future, but more can be done to ensure that rooftop solar reaches a greater share of middle- and low-income Americans.
Conclusion
Our analysis of three emerging solar markets shows that middle-class homeowners make up a significant percentage of rooftop solar customers, especially in Massachusetts and New York. Regulators and policymakers in these two states and Maryland, as well as across the country, should be thinking about ways to provide more access to solar and other distributed technologies, rather than scaling back good solar programs and policies. Effective residential solar policies expand access to middle- and low-income residents while also increasing the use of clean, distributed power that can reduce carbon emissions and add value to the grid.
Data collection and methodology
To determine the income distribution of rooftop solar system owners, we collected data from the Maryland Energy Administration, Massachusetts’s Executive Office of Energy and Environmental Affairs, and the New York State Energy Research and Development Authority. The Maryland Energy Administration and the New York State Energy Research and Development Authority track all residential and nonresidential solar installations for which individuals or entities receive a solar rebate within their respective states. In Massachusetts, the Executive Office of Energy and Environmental Affairs tracks all solar installations that are registered as qualified generation units under the solar carve-out requirement of the state’s renewable portfolio standard. The installation data used in this analysis for Maryland and New York were current as of April 30. The Massachusetts solar installation dataset was updated on May 1.
Using the Bureau of the Census’s 2012 five-year estimates from the American Community Survey, we found the median household income for each ZIP code in which there was a residential solar installation accounted for in the Maryland, Massachusetts, and New York databases. We analyzed 5,359 installations and 369 ZIP codes in Maryland, 8,557 installations and 470 ZIP codes in Massachusetts, and 7,429 installations and 1,074 ZIP codes in New York.
Data limitations
We analyzed median income data at the ZIP-code level from the Bureau of the Census because actual income data for each installation are not publicly available. Actual incomes associated with each installation could be higher or lower than the median incomes.
Mari Hernandez is a Research Associate on the Energy team at the Center for American Progress.