Public higher education also hit an important inflection point during this period: 2017-18 was the first time that white students no longer constituted a majority of undergraduates in U.S. public colleges.2 Similarly, in 2018-19, there were 12 states plus Puerto Rico and the District of Columbia where white students did not represent a majority of the undergraduate population at public colleges.
These statistics are a function of three divergent stories in undergraduate enrollment in public colleges, especially when compared with the prime college-aged population of people between the ages of 18 and 24. First, there has been a decline of more than 200,000 Black students, which is not quite as large as the decreasing overall numbers of Black individuals ages 18 to 24; second, there has been growth in enrollment of Latinx students, well above the increase in the 18- to 24-year-old Latinx population; and third, there was a decline of 810,000 white students, while the white prime college-aged population saw even larger declines.
These trends are not a function of students moving between public and private colleges. The number of Black and white students in private nonprofit and for-profit institutions also declined over this period. Among Latinx students, meanwhile, numbers increased at private nonprofit colleges and declined in the for-profit sector by an amount that was far smaller than their gains at public colleges.3
The first two trends—the decrease in Black undergraduate enrollment and the increase in Latinx undergraduate enrollment—have significant implications for efforts to eliminate disparities in college attainment by race and ethnicity. There are large gaps between white young adults with at least an associate degree and their Black or Latinx peers—differences of 19 percentage points and 27 percentage points, respectively.4 And absent significant increases in graduation rates, declines in the number of Black students in college will make it hard to shrink their attainment gap relative to white students. On a more positive front, however, continued growth in Latinx enrollment could help with the continued reduction in the white-Latinx gap, but only if colleges enrolling more Latinx students take steps to serve them better and improve graduation rates.
The white enrollment story is a bit more complex. The declines are worrisome, but compared with those of Black students, they are not as disproportionate relative to population changes. States and institutions, therefore, should take a closer look at whether these declines may be greater among some subgroups of white students, such as those who live in rural areas or those who are first-generation students.
This report takes a closer look at trends in the number of undergraduate students enrolled in public colleges, disaggregated by race and ethnicity, state, and type of public college. It examines U.S. Department of Education data from the 2014-15 and 2018-19 academic years. The report also compares these results with 2014 and 2018 data from the U.S. Census Bureau to determine how enrollment changes relate to overall demographic trends in the number of college-aged individuals by state.
Public higher education must recognize the significance of these changes. Many of the systems, policies, and practices in postsecondary education were built for wealthier white consumers. Yet that is not who most learners are today. Higher education must change to meet students where they are. Such an effort must include being intentional in addressing seemingly small issues, such as students not understanding jargon such as “office hours,” to ensuring that advisers are proactive in working with students and have the necessary cultural competence to connect with their advisees. Institutions of higher education must also take on more systemic issues such as restrictive credit transfer policies and the rising cost of attendance, as well as the fundamental question of whether students get enough value from their degrees given racial disparities in wage gains.
Addressing these challenges requires a range of policy solutions, which must start with a new commitment from the federal government to postsecondary education in the form of big investments in debt-free college—plus requirements for states and institutions to address equity gaps and improve outcomes. As part of this effort, institutions and states will have to take a close look at their policies, practices, and supports to ensure that they are doing all they can to serve today’s learners well.
More specifically, this report recommends that the federal government do the following:
- Make a big federal investment in debt-free college. In 2018, the Center for American Progress called for a significant new investment in delivering debt-free college to students at public and private nonprofit colleges through a plan called “Beyond Tuition.”5 Under this plan, the federal government would award additional funds to states and colleges that would allow them to eliminate charges for low-income families and to cap prices at a reasonable share of income for those in the middle class and above. These funds would cover not just tuition but also living expenses such as food, housing, and transportation. Moreover, this additional investment would need to replace tuition while also providing greater resources to community colleges and minority-serving institutions, which operate today with much lower revenue than other institutions.
- Increase the maximum Pell Grant. Additional investments in grant aid would help increase college access and completion for low-income students.6 For instance, providing a much more generous Pell Grant—ideally, doubling the award from its current level of $6,345—could help reverse enrollment declines.7
Additionally, states and institutions should take the following actions:
- Conduct equity audits to identify policies and procedures that colleges need to adjust. As the Center for American Progress has proposed in the past, an equity audit would provide a top-to-bottom review of colleges’ policies, procedures, and supports, ranging from admissions and recruitment to career services and graduation.8 The goal here is to identify missing supports as well as practices that may have unintended negative effects on certain groups of students. This includes looking at the demographics of high schools where colleges recruit, whether there are disparate impacts from the way colleges determine who needs remedial education, and whether certain types of students are less likely to use supports such as advising or tutoring. Colleges can then use these audits to figure out how to better serve Black and Latinx students, as well as other underserved students.
- Conduct quantitative and qualitative work to better understand the Black enrollment decline. States and public institutions should start by looking at the colleges with the biggest declines in Black enrollment and investigate whether institutions are drawing fewer Black students from specific geographic areas than they did in the past. This analysis should consider whether declines are among adults or those coming straight from high school. It should also examine whether declines are disproportionate relative to overall demographic changes. Moreover, colleges should conduct extensive interviews with local high school leaders, students who previously attended the college, and those currently enrolled to better understand shortcomings in how they recruit, admit, or serve Black students that may make them a less welcoming or attractive option.
- Adapt programs to meet the needs of Latinx students. While colleges work to stem declines in Black enrollment, they must also ensure that they are adapting to meet the needs of their growing numbers of Latinx students, since higher enrollment rates will come to naught if students are poorly served and do not make it to graduation. In doing so, institutions must better understand who they are serving and how their needs may be unique. This approach should combine quantitative and qualitative analyses. Specifically, institutions should look at issues such as noncompletion rates; seek to identify early factors indicating that students may leave college; and identify courses that are bottlenecks for Latinx students. In addition, they should try to better understand these data as well as factors that cannot be easily measured, such as campus climate and culture.
The novel coronavirus makes responding to these enrollment changes even more important. While it is currently unknown how the pandemic will affect college attendance and completion for the full academic year, initial data suggest that there has already been a significant decline in Black student enrollment over the summer.9 There is also a risk that the gains made among Latinx students could slow or reverse—as well as other negative outcomes. While colleges will struggle to handle the financial implications of the crisis for years to come, they must make sure to avoid any disparate effects on Black, Latinx, and other students of color.
About the data
This report uses data from two sources. First, it considers unduplicated 12-month enrollment data for undergraduate students at public colleges and universities, as reported to the Integrated Postsecondary Education Data System (IPEDS) for the 2014-15 and the 2018-19 academic years—the most recent year available—providing a snapshot of how enrollment changed from the start to end of a five-year period.
The analysis aggregates these data to look at enrollment for public colleges overall, public four-year colleges, and public colleges of two years or less. The third category includes both certificate and associate degree-granters. “Institutional sector” is defined based on a college’s category, not the highest degree awarded. This ensures that a community college that grants a bachelor’s degree is still counted as a two-year institution.
The data about population estimates come from the U.S. Census Bureau. These are one-year estimates from the calendar years 2014 and 2018—providing the start and end points of a five-year period that overlaps with the academic years considered. This analysis looks at changes in the wider population of 18- to 24-year-olds. This is an age range that represents about two-thirds of public undergraduate students, according to data from the U.S. Department of Education.10 Nationally, about 40 percent of these individuals are enrolled in undergraduate or graduate postsecondary education, compared with just 12 percent of those between the ages of 25 and 29 and 6 percent of those ages 30 to 34.11
All references to enrollment in this analysis apply to undergraduate students at public colleges, while all references to two-year colleges refer to public colleges of two years or less. Similarly, the report uses the term “Black” to refer to individuals identified in the IPEDS data as Black or African American or in the census data as Black or African American alone. Meanwhile, it uses the term “Latinx” to refer to individuals identified in the IPEDS or census data as Hispanic or Latino of any race. In the context of census data, “white” is used to refer to white individuals who are not Hispanic or Latino. Finally, unless otherwise noted, all references to population figures are for 18- to 24-year-olds of the same race or ethnicity being discussed.
This analysis does not consider the trends for Asian students for several reasons. First, in many states, Asian enrollment is less than Black and Latinx enrollment, making it harder to assess changes. Second, the Asian demographic category is currently too broad as constructed. This category needs to be disaggregated to better understand trends among different Asian communities.12
For more on the data used in this analysis, see the Methodology at the end of the report.
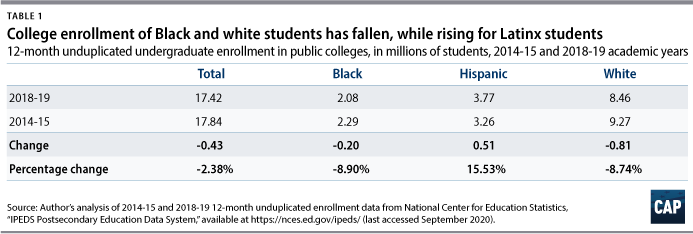
Public colleges enrolled 17.84 million undergraduate students in the 2014-15 academic year. Five years later, that number had fallen by almost 425,000 students—a drop of nearly 2.5 percentage points. However, as Table 1 shows, these results are not evenly distributed. The number of Latinx public undergraduate students increased over this five-year period, with a particularly large gain of more than half a million—510,000—students among the group. At the same time, enrollment for Black and white students fell by slightly less than 9 percent, a loss of more than 200,000 and 810,000 students, respectively. (see Table 1)
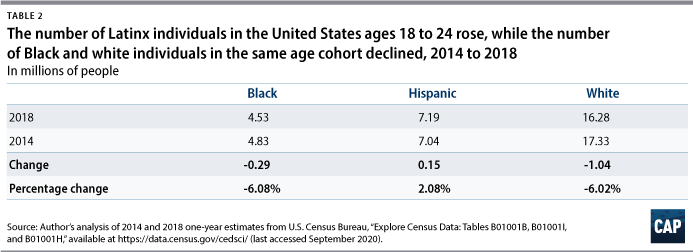
Compared with demographic data from the U.S. Census Bureau, the changes in Latinx enrollment exceeded population trends, while the number of Black and white students did not decline by as much as the overall decreases in their respective populations. Nationally, the number of Latinx individuals ages 18 to 24 increased by 146,000—well below the 510,000 increase in college enrollment. The Black population, meanwhile, decreased by 294,000—slightly more of a decline than the drop in college enrollment. Similarly, the white population decreased by 1.04 million individuals—a larger drop than the 810,000 student decline in public college enrollment. (see Table 2).
The gains of Latinx students, coupled with the declines in white student enrollment, mean that the national public higher education system has hit a tipping point. Starting in 2017-18, white students no longer represented the majority of undergraduate students in public higher education. And by 2018-19, the white student population fell to 48.6 percent of all undergraduate students. This is because there are 12 states, plus Puerto Rico and the District of Columbia, where white students are not the majority. These states include the four largest by enrollment—California, Texas, Florida, and New York—plus four others in the top 15. Given the size of these states and the fact that they enroll so many nonwhite students, white students are no longer a majority in public higher education nationally despite still occupying that place in 38 other states.
Just as the enrollment changes are not evenly distributed by race, there are also major differences by institution sector. Overall, public four-year colleges increased enrollment by more than 178,000 students from the 2014-15 to the 2018-19 academic year. At the same time, enrollment in two-year public colleges dropped by more than 603,000 students—a 5.5 percent decline. (see Table 3) There is no definitive evidence for why enrollment fell so much more at community colleges than it did at four-year colleges, but community colleges generally see their enrollments fall during good economic times and rise during recessions, as more people go to college when jobs are scarce.
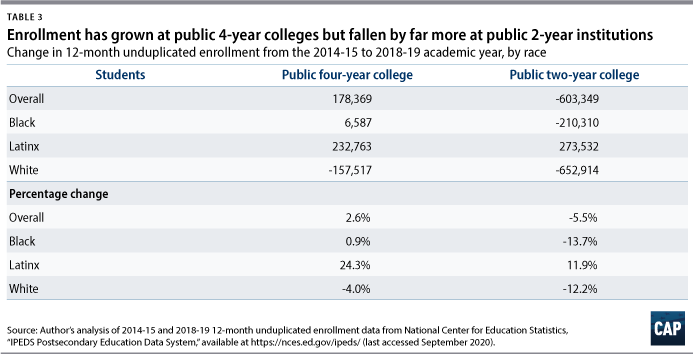
Trends by race and institution type followed similar patterns. Black enrollment rose very slightly at public four-year colleges, increasing by approximately 6,600 students. However, it also dropped by nearly 14 percent at two-year colleges, resulting in around 210,000 fewer students attending these institutions. White students, meanwhile, saw a 4 percent drop in enrollment at four-year colleges, compared with a drop of more than 12 percent at two-year colleges—a decline of nearly 653,000 students at those schools. Once again, the Latinx story was slightly different: This group saw gains in enrollment for both types of public colleges. In terms of percentage, the increase in enrollment at public four-year colleges was double what it was at two-year institutions—24 percent versus 12 percent. But because more Latinx students go to community colleges than four-year institutions, this still represented a larger increase in the number of students attending two-year public colleges—a 273,500 increase in community college students versus an increase of 233,000 students at public four-year colleges.
One challenge with these national results, however, is that the net picture may be different than the situation in individual states, which have their own stories for enrollment and population changes. For that reason, the rest of this report only looks at state-level results, with separate narratives for Black, Latinx, and white students.
Black students
Among all 50 states plus the District of Columbia and Puerto Rico, 44 reported a decline in Black enrollment. Meanwhile, those states that reported an enrollment gain—including South Dakota, Idaho, Utah, Vermont, and Maine—all had low levels of Black enrollment to begin with. No state reported more than 540 additional Black undergraduates in its public colleges.
However, there was a noticeable difference in enrollment changes by institution sector. Overall, 28 states plus Puerto Rico saw an increase in Black students attending four-year colleges from 2014-15 to 2018-19, compared with just six states, plus Puerto Rico, that had gains in two-year college attendance. Notably, all of these increases at two-year colleges were minimal; the largest increase was 235 additional Black students in Maine.
The gains that states made in terms of Black enrollment at four-year colleges were much smaller than the declines at two-year public colleges. Texas, for example, saw the largest gain of Black students in public four-year colleges, with an increase of nearly 5,800 students, or a 9 percent gain. Texas also experienced the sixth-largest drop among two-year public colleges, losing more than 13,600 Black students attending two-year institutions—an 8 percent loss. Results were similar for Georgia and Maryland, which each added more than 4,000 additional Black students to their public four-year college rolls while losing nearly double that many Black students in their two-year public colleges.
Unfortunately, the data cannot show why the trends are divergent across the two types of public colleges. In particular, a lack of data on enrollment by race and age means that it is not possible to see if perhaps there are two different trends at work, such as older individuals choosing jobs over community college, whereas traditionally, college-aged students have chosen four-year campuses.
Demographics
The declines among Black students are particularly concerning because, in many states, the drops in enrollment are larger than the overall decrease in prime college-aged Black individuals during this same time. Among the 35 states, plus District of Columbia, that saw a decline of at least 400 Black students, 16 experienced larger drops in enrollment than they did in the overall population of Black 18- to 24-year-olds; and a 17th state, Virginia, was within 100 students of the population change. For example, Illinois’ 28,500 decline in Black enrollment was larger than its decline of 25,500 Black prime college-aged individuals. The story was the same in South Carolina, which lost more than 11,250 students, compared with a drop of 7,400 in the Black population. Texas, meanwhile, saw its Black enrollment drop by 7,850, while its Black population rose slightly. (see Table 4)

In many cases, states that lost fewer students than their population drop still present cause for concern. For one, 2018 census data show that about 40 percent of individuals between the ages of 18 and 24 are enrolled in undergraduate or graduate studies.13 This suggests that a proportional enrollment change should be roughly half the size of the demographic shift. It also implies that instances where the enrollment rise or fall is similar to what is going on in the broader population may well be a sign of disproportionate effects on college enrollment. And of course, the college population by no means stops at 24 years of age. According to federal data, only about two-thirds of students in public colleges fall within this age range, including just 55 percent of those at community colleges, where declines are greater.14 Similarly, not everyone attends their in-state public college. A significant chunk of students at many selective public four-year institutions come from out of state, which could keep overall enrollment figures a bit higher. These are further reasons why an enrollment decline close to the change in prime college-aged population almost certainly represents a disproportionate decrease relative to changes in the population.
Two examples show how enrollment declines that are close to overall population trends among 18- to 24-year-olds are cause for concern. Michigan and North Carolina enrolled 19,000 and 17,700 fewer Black students, respectively, in the 2018-19 academic year than they did during 2014-15. Those drops are smaller than their respective Black population declines of 25,900 and 19,400 for those between the ages of 18 to 24 from 2014 to 2018. But if this population comparison had been expanded by five years to include those between the ages of 25 and 29, it would have shown that the Black population in Michigan fell by only 1,500 individuals, while it went up by 13,500 individuals in North Carolina. These results suggest that the loss of Black students cannot simply be explained by demographic changes.
Other states, meanwhile, lost far fewer Black students relative to declines in the Black population. New York, for example, saw its annual Black student enrollment fall by 5,600 students, compared with a population decline of 40,000 individuals. The story was similar in Louisiana, where 6,400 fewer Black students were enrolling in college but the Black prime college-aged population declined by more than 14,000.
Overall, the results in this section should raise significant concerns about how effectively states and colleges were enrolling Black students over this time period. It is true that the total number of Black individuals in their prime college-going years declined in many states over the same five years, but in many states, the fall in college enrollment outstrips what one might expect based on the demographic changes. More must be done—and quickly—to avert further declines.
Latinx students
Except New Mexico and Puerto Rico, every state plus the District of Columbia reported increases in the number of Latinx students. At the high end, states such as Tennessee, Georgia, and Idaho reported increases of 45 percent or more, representing thousands of additional students. And though smaller in percentage terms, California and Texas added more than 178,000 and 108,000 Latinx undergraduate students in their public colleges, respectively—a 16 percent and 18 percent increase, respectively. (see Table 5)
While Latinx students have traditionally enrolled at two-year colleges at higher rates, many states reported a greater increase at four-year colleges in absolute terms. New York, for example, added 14,000 more Latinx students at its four-year colleges, compared with a slight decline in enrollment at two-year public colleges. Arizona, meanwhile, added about two times as many public four-year students—12,300 versus 6,500.
There are some notable exceptions to this pattern. For example, California enrolled more than 56,000 additional Latinx students at its public four-year colleges, compared with 122,000 more students in public colleges of two years or less. Texas, similarly, enrolled about 10,000 more students at its public colleges of two years or less than it did at its four-year institutions.
Demographics
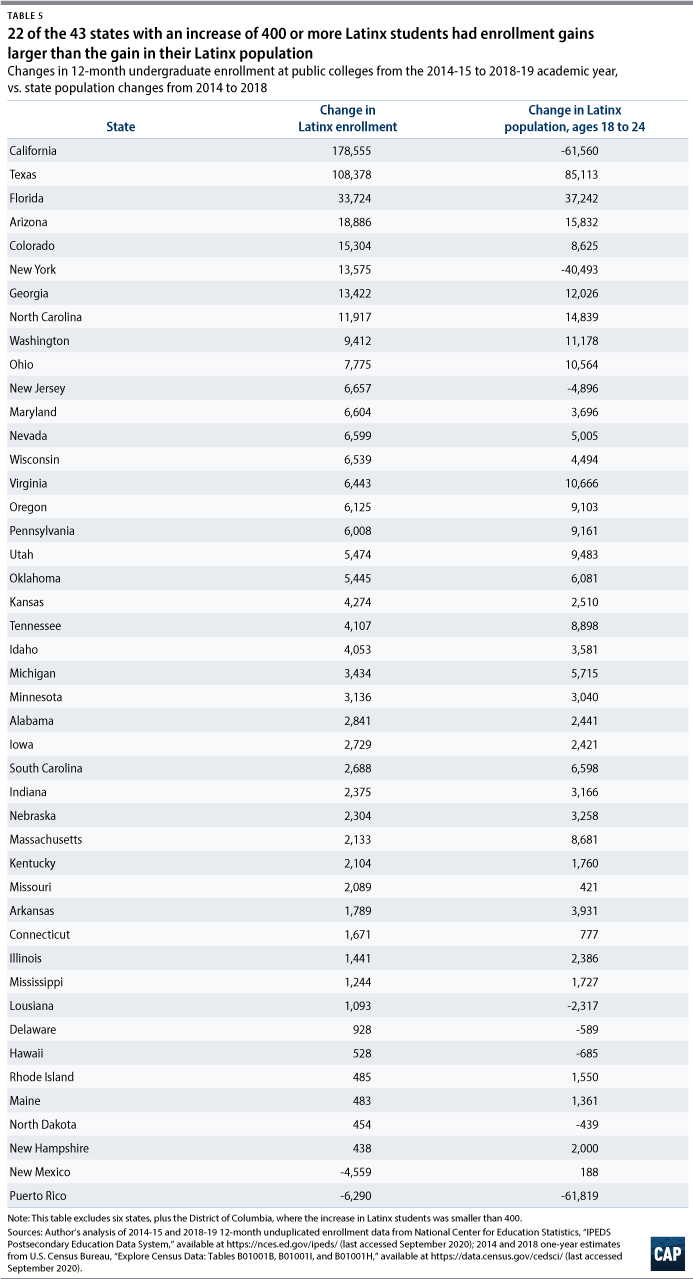
Of the 43 states that added 400 or more Latinx students to their college enrollment over this period, 22 saw gains that were greater than overall population changes. The most striking of these examples is California, which added more than 178,500 Latinx undergraduates to its public colleges while seeing the number of these individuals in the overall 18- to 24-year-old population decline by more than 61,500. The result was similar in New York, which saw an increase of 13,575 Latinx students in its undergraduate public colleges despite a loss of about 40,000 Latinx individuals in the overall prime college-aged population.
Similar to the story with Black student enrollment trends, this analysis cannot prove that these results are far different from what demographic changes would produce, since not every Latinx student who enrolled was between the ages of 18 and 24. This could mean that in some of these cases, enrollment growth is more in line with what would be expected from a broader measure of the population.
It is also critical to remember that gains in enrollment are not guaranteed to result in increases in the number of graduates or the percentage of students who make it through to completion. Colleges accepting the additional students must take steps to make sure that these students are served well and that barriers are reduced so that more make it through to completion.
White students
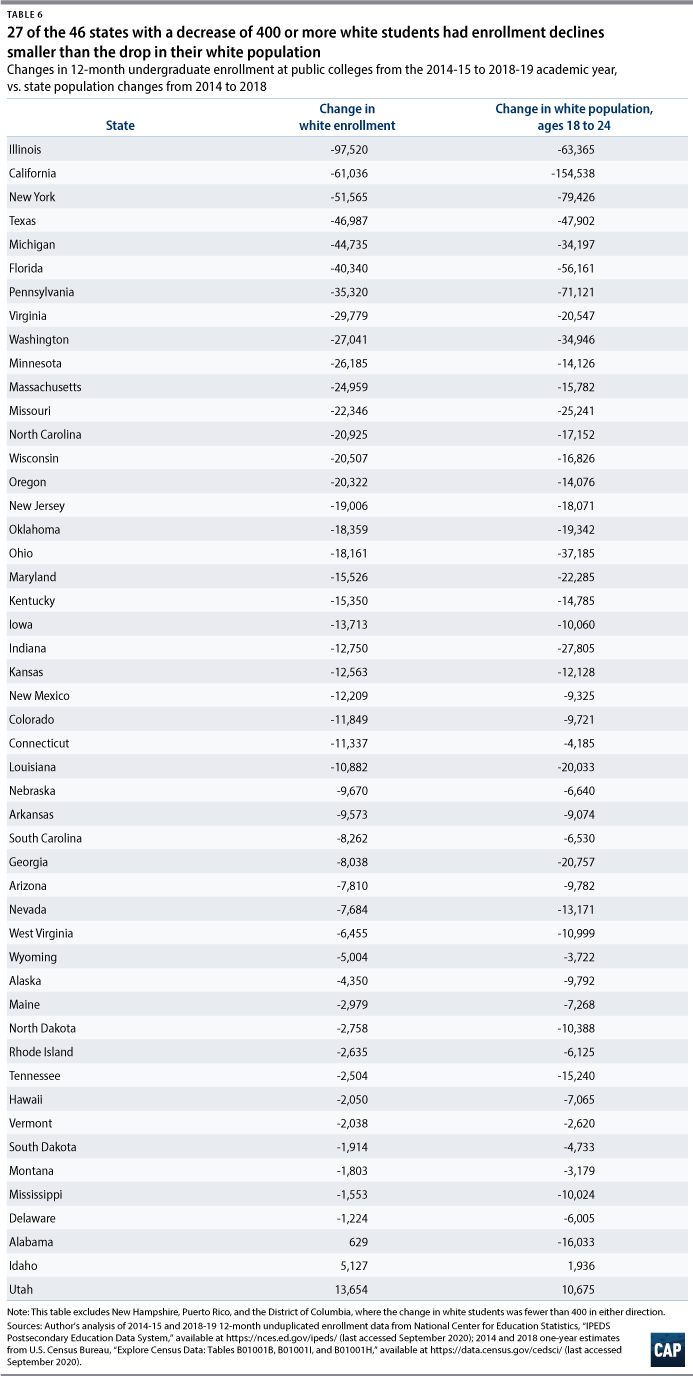
Forty-eight states plus the District of Columbia reported a decline in their white undergraduate enrollment. Illinois saw massive drops, losing more than 97,500 white students—a fall of 23 percent. That is tens of thousands more students than the declines in much bigger states such as California and Texas. On the other end, Utah and Idaho were the only states to record a noticeable increase in their white undergraduate population, adding more than 13,600 and 5,100 students, respectively. The net effect of these trends is that from 2015 to 2019, the share of public undergraduate students who were white declined in 44 states as well as the District of Columbia. (see Table 6)
Two-year colleges generally saw greater declines in white student enrollment than did four-year institutions. For example, Illinois lost 70,000 more white students at its two-year public colleges than at its four-year institutions—83,600 versus 13,900. The same was true in California, which saw a decline of about 40,000 more white students in the two-year colleges; Florida, which saw a difference of 30,000 students; Michigan and North Carolina, which both saw differences of 18,000 students; and others.15
Only two states showed significant increases in their white populations at four-year colleges: Arizona and Utah, which both added more than 15,000 students. The growth in Arizona appears to be almost entirely due to Arizona State University’s online arm, while Utah’s was driven by Weber State University and Utah Valley University. At the two-year level, Indiana and Idaho experienced the largest growth of white students, at 10,000 and 5,200, respectively.
Alabama and Mississippi also stand out for distressing reasons. White student enrollment at both of these states’ public four-year colleges increased, while Black student enrollment at these institutions declined. For example, Alabama added 2,500 more white students to its public four-year colleges, even as Black enrollment fell by 1,500. Mississippi, meanwhile, added 1,800 white students while losing 2,300 Black students. Both of these states had declines in their white and Black populations during this time.
Demographics
Of the 46 states that saw a decline of 400 or more white students, 19 saw a bigger drop in enrollment than the overall population change of white 18- to 24-year-olds. This includes Illinois, which saw a decrease of 97,500 students versus a population drop of 63,350, as well as Michigan and Virginia, which each lost about 10,000 more students than the population change.
Many other large states’ declines in white enrollment fell below population changes. For example, California saw a decline of 61,000 white students, but this was much smaller than the overall decline of 154,000 white 18 -to 24-year-olds. Similarly, New York and Pennsylvania saw enrollment declines that were respectively 27,000 and 35,000 people fewer than overall white population declines.
As with Black students, the comparison between enrollment declines and demographic changes in such a narrow age range may fail to identify all the states where enrollment declines were disproportionate. The said, as detailed in the Methodology, a wider age range resulted in only a handful more states appearing as if they had disproportionate results—a smaller effect than what occurred for Black students.
The white student results merit a more in-depth investigation than the IPEDS data can provide. Given the large declines, it is worth exploring whether there are trends at play, such as greater declines among students from rural areas, low-income students, students who are the first in their family to go to college, or other factors. That would help to identify if there are crises within this population that must be addressed.