Recently released U.S. Department of Education data have revealed new insights into the college outcomes of low-income students. The new data offer some positive news—but they also present warning signs about just how poorly some sectors of higher education are serving students who receive the Pell Grant, the main federal grant offered to low-income students. On the good-news front, the data show that some nontraditional Pell recipients—particularly part-time transfer students—complete college at higher rates than their nontraditional peers who do not receive the grant. However, the data also reveal the cavernous gap that exists between the bachelor’s degree attainment rates of Pell and non-Pell students—more than 10 percentage points at public colleges and nearly 15 percentage points at private colleges.
Since its inception in 1972, the Pell Grant Program has been the largest federal program that gives low-income families a grant for college costs. In the 2017-18 school year, the grant helped more than 7 million students from low-income families access college, and most recipients have family incomes of less than $40,000 per year.1 The total grant amount varies yearly and is dependent on factors such as expected family income, the institution’s cost of attendance, enrollment status, and whether a student attends for the full academic year or less.2 Research has shown the Pell Grant to be successful at providing many low-income students with access to college.3 However, because of data limitations, prior research on Pell students has looked exclusively at first-time, full-time students—totaling 46 percent of all Pell students—a group that faces lower attainment rates than their non-Pell peers. Surprisingly, when part-time and transfer students are included in the data, the overall completion rate for Pell Grant recipients is a fraction of a percentage point higher than for non-Pell recipients. Although these results offer a glimpse into the positive effects of grant aid,4 it is clear that there is still work to be done.
A note on the data
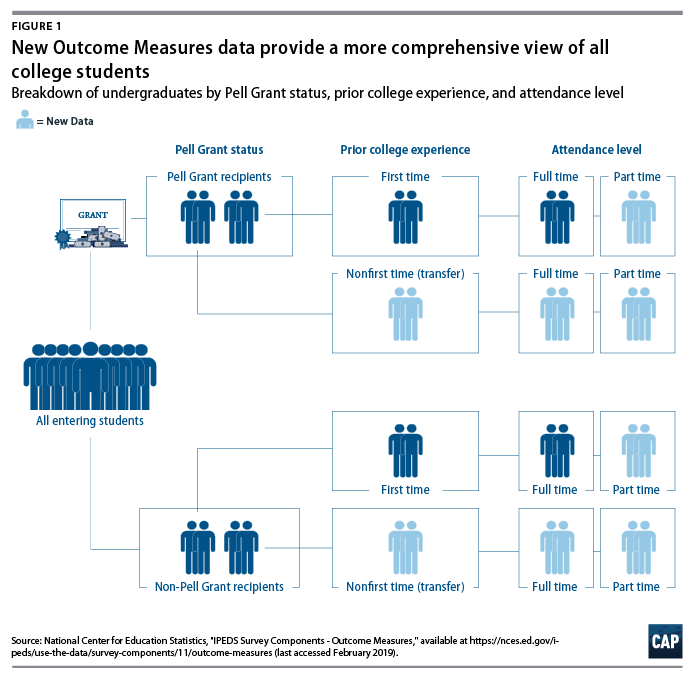
The new federal data, referred to as Outcome Measures (OM), provide better and more thorough insight into completion rates for college students.5 Data on graduation rates only included first-time, full-time students, while these new data include students who attend college part time, re-enroll in school after taking a break, or transfer to another college. The OM also provide additional information on the number of students in each institution type, along with the number of students earning a credential—a certificate, an associate degree, or a bachelor’s degree—within four, six, or eight years of beginning at an institution.
All public, private, and for-profit colleges report the outcomes of students who entered in fall 2009. Each student is categorized in three ways based on their status when they first enrolled in an institution: as a full- or part-time student; as a Pell recipient or a non-Pell recipient; and as a first-time-in-college student or a nonfirst-time or transfer student. These new data provide a more complete overview of a group of students that depends on federal aid to access higher education.
Not all Pell students are falling behind
The Pell Grant alone is not enough to close existing completion gaps between wealthy and low-income students, especially among students who enter college for the first time and attend full time. Despite this reality, the new data offer some positive insight. While the completion rates are very low overall, there is only a slight completion gap—37.7 percent of Pell recipients earn credentials within eight years of enrolling, compared with 37.1 percent of non-Pell recipients. (see Table 1) Collegiate leadership and the federal government therefore need to do much more to help both Pell and non-Pell students reach the finish line.
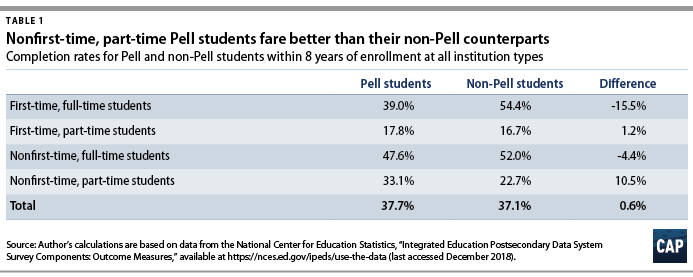
These data provide a clearer picture for different groups of Pell students. Part-time Pell students do slightly better than their full-time peers, and nonfirst-time, part-time Pell students’ credential completion rate is 10 percentage points higher than that of their non-Pell peers. This number is significant and may be explained by these students gaining insight and clarity from their first try at college, such as what study habits work for them, what field of study to focus on, and how to balance school and life expectations.
The Pell Grant could be one factor that explains why nonfirst-time, part-time Pell students have higher rates of earning a credential than their non-Pell counterparts. Research shows that a large portion of part-time students are also working while attending school, often to balance financial priorities such as paying rent, purchasing food, and supporting a family.6 Although these students are receiving a partial Pell Grant due to their more limited enrollment, those funds could help part-time students cover these necessities and allow them to focus more on school. And though part-time students’ completion rates are lower than those of full-time students overall,7 an increase in the funds awarded through the Pell Grant could help address lower part-time completion rates while simultaneously closing the completion gap for full-time Pell students.
Completion and credential-attainment gaps are the largest at public and private four-year institutions
These new data confirm that the Pell completion gap for first-time, full-time students at public and private four-year institutions is significant and in line with other research.8 Part of this gap could stem from the challenges that low-income students face when attending college. According to Andrew Moe, associate dean of admissions and director of access at Swarthmore College, low-income students can often experience feelings of self-doubt and lack a sense of belonging.9 Furthermore, Vincent Tinto, a scholar on college experiences of low-income students, notes that low-income students can struggle with academics when enrolled in school due to a combination of a lack of preparedness and high-school quality.10
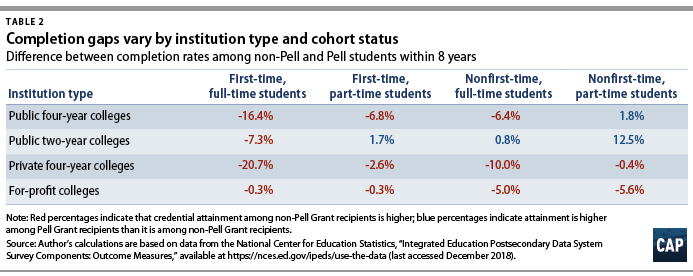
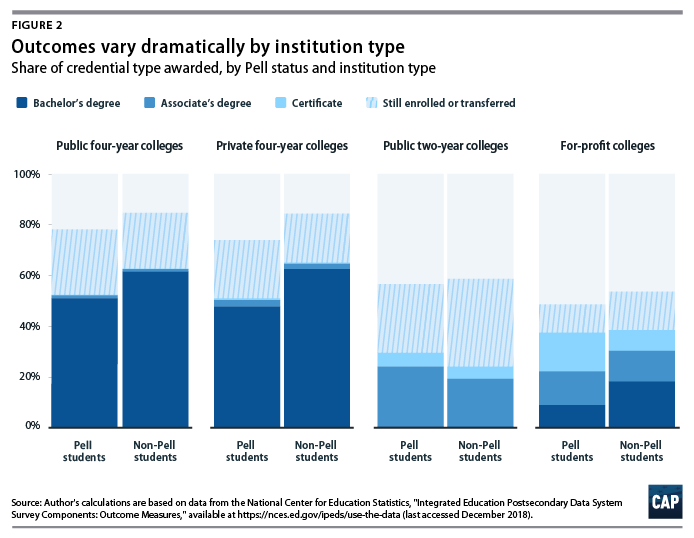
In addition to the significant completion gaps for first-time, full-time Pell students at public and private four-year colleges (see Table 2), these institutions also have large inequities in bachelor’s degree attainment for Pell and non-Pell students. (see Figure 2)
A potential explanation for such a dramatic completion gap in the private four-year sector is the overenrollment of Pell students at schools with large completion disparities. For example, Liberty University, a private university in Lynchburg, Virginia, has the highest number of Pell students among private four-year colleges, with 7,454 Pell students, but it also has a large Pell completion gap: a 13 percentage point difference between Pell and non-Pell students.11 If schools are enrolling large numbers of Pell students, they also need to offer the institutional resources to support these students. Liberty University does offer some need-based scholarships for low-income students, but institutions also need to invest in specific programming for their low-income students.
In some cases, however, underenrollment of Pell students could contribute to the Pell gap. For example, Tulane University, a private four-year college, and the University of Alabama, Tuscaloosa, a public four-year college, have some of the largest student bodies for their respective sectors, but Pell students only make up a small portion of them—17.6 percent and 22.3 percent, respectively.12 For comparison, the median share of Pell students at both private four-year and public four-year U.S. institutions is 32.4 percent.13 Both schools also have significant Pell attainment gaps—19.5 percent and 15.4 percent, respectively.14 These schools are high-quality research institutions that had endowments within the top 150 of all U.S. and Canadian colleges in 2017.15 This means that they can afford to both academically and financially support their Pell students. These data, however, suggest that the schools have not been investing enough resources for this population to thrive.
It is possible to address the Pell completion gap, and institutions of all sizes and sectors have found success in doing so. For example, the University of South Florida, Tampa (USF), where Pell students comprise 44.6 percent of the student body, has successfully closed the Pell completion gap while maintaining an above-average graduation rate of 73.3 percent for all students.16 Part of USF’s success in graduating Pell students can be attributed to leadership buy-in and subsequent institutional investment in its students, such as increased need-based financial aid packages and a freshman summer bridge program for low-income and first-generation students.17
Pell students fare the worst at for-profit colleges
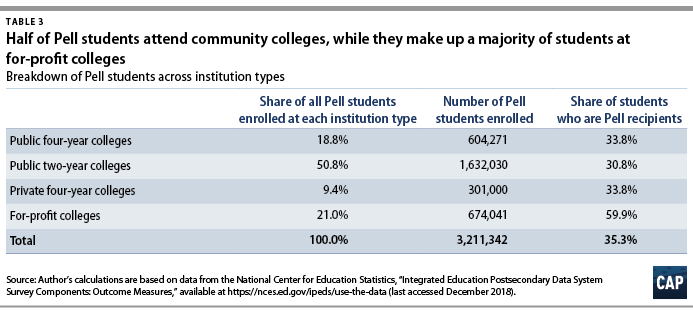
While a majority of Pell students enroll at public two-year institutions or community colleges, Pell students make up the largest percentage—nearly 60 percent—of the student population at for-profit colleges. (see Table 3) This could be explained by for-profit colleges’ recruiting practices, such as systemically targeting low-income students due to their eligibility for federal financial aid.18 Additionally, low-income students could be drawn to for-profit institutions due to the ease of applying and the low barriers to entry through open admission policies.19
Unlike in any other sector, Pell students at for-profit colleges are more likely to earn certificates than any other degree. (see Figure 2) While certificate earners can learn practical skills in their field, they do not earn as much as those with an associate or a bachelor’s degree upon entering the workforce.20 Furthermore, students at for-profit institutions default on their student loans at twice the rate of community college students, the next highest sector for student default rates.21 If low-income students are seeking degrees with a lower economic return at schools with high default rates, then they are at risk for ending up worse off when they leave college than when they entered it.
Although community colleges have some of the lowest completion rates of all the sectors, their “still enrolled or transferred” rates are the highest. As transferring a large share of their students to a four-year institution is the mission of community colleges, transfer data provided in the Outcome Measures provide important insight into the outcomes of all community college students. Unfortunately, the OM do not indicate where a transfer student went or whether they graduated—only that they enrolled at a different school.
More can be done to help Pell students succeed
The data show that the Pell Grant program is providing students with critical financial aid to complete college. But a significant completion gap still exists for first-time, full-time students, and overall college completion rates are low. Due to the rising costs of college, the purchasing power of the Pell Grant has diminished dramatically since the 1970s.22 The federal government needs to address these inequities and ease low-income students’ financial burdens, including by taking the following steps: 1) Tie the Pell Grant to inflation to ensure it increases appropriately;23 2) Devote more funding to help cover the rising cost of college; and 3) Introduce a one-time Free Application for Federal Student Aid (FAFSA) to guarantee Pell access while a student is enrolled.24 Policymakers could take an even bigger step, ensuring that college is completely free—including living expenses—for low-income students, as is proposed in the Center for American Progress’ “Beyond Tuition” report.25
Given the different challenges that low-income students face, it is important for institutions and policymakers to invest in programs that provide academic and career advising, mentoring, and financial support. One example is the City University of New York’s Accelerated Study in Associate Programs, which have nearly doubled the three-year associate degree completion rate for low-income student participants from 26.8 percent to 52.4 percent, according to a study of the program from 2009 to 2012.26 Schools can also examine how to better serve low-income students by undertaking an equity audit—a top-to-bottom review of a school’s policies to address completion gaps between student characteristics such as race and socio-economic status.27
A college degree is one of the few paths available for low-income students to achieve economic mobility. Leaders in government and higher education need to reinvest in the future of Pell Grant recipients, or they risk subjecting many of these students to lives of financial instability.
Victoria Yuen is a policy analyst for Postsecondary Education at the Center for American Progress.