Over the past several years, the Department of Education has released a significant amount of data on repayment rates through the College Scorecard. While these data provide an important window into school-level results, they have not provided the information needed to answer an even more basic question: What were the paths that led students away from repayment?
Data released last fall by the National Center for Education Statistics (NCES)—the Education Department’s statistical arm—has provided the best window into the question of nonrepayment to date, highlighting the importance of better understanding this issue. The data revealed the 2015 student loan repayment status of students who entered college in the 2003-04 academic year. The result is a 12-year picture of repayment, default, and other loan outcomes.
Table 1 uses these federal data to provide a breakdown of the students who owed more than they originally borrowed 12 years after entering college, across a range of outcomes.
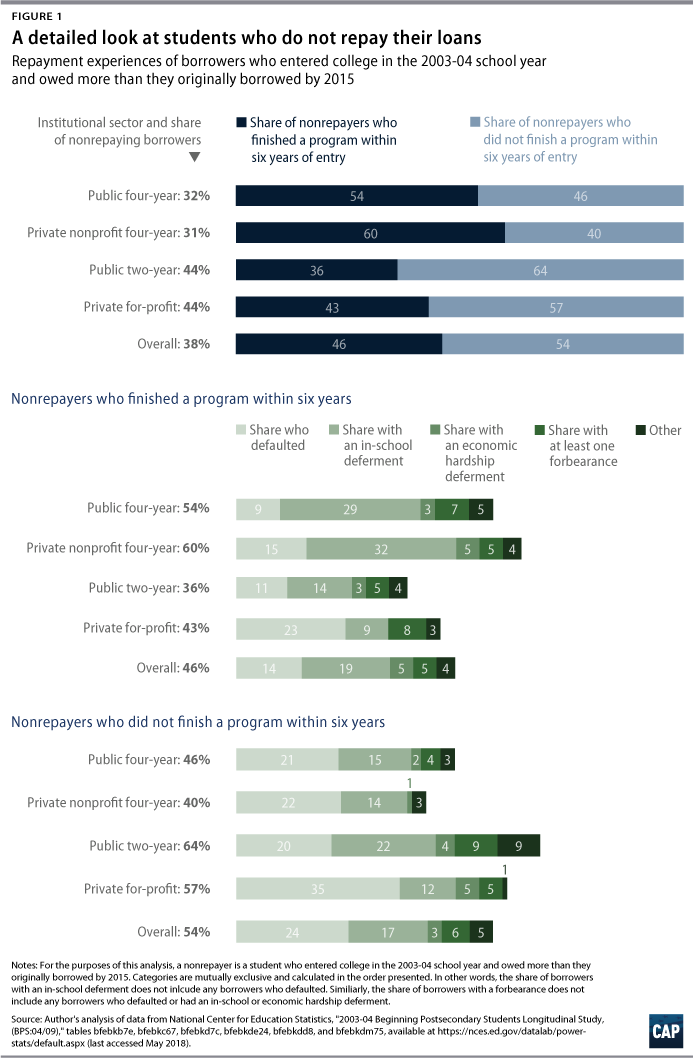
This table offers policymakers three important insights. First, about half of nonrepayers did not complete a program within six years of entering college—about the same split observed among borrowers who defaulted.12 Second, defaulters comprise about one-third of nonrepayers in every sector except for-profit colleges, where they are just under 60 percent. This means that the nonrepayment problem is much broader than the default one.
Third, the table shows that a significant share of nonrepayers went back to school at some point. At four-year public and private nonprofit institutions, students with an in-school deferment comprise nearly half of nonrepayers, including a majority of students who graduated and ended up owing more than they originally borrowed. This suggests that repayment rates that do not take into account whether students go back to school could end up judging large numbers of students as repayment failures for seeking additional schooling. The current College Scorecard, for example, does not count students in a repayment cohort if they have a military or an in-school deferment at the time the rate gets measured. Yet, these borrowers are included if they are back in repayment at the time the rates are calculated.13
What data currently exist on student loan repayment rates?
There are four main sources of existing Department of Education data on student loan repayment rates: the College Scorecard; surveys from the National Center for Education Statistics; the Federal Student Aid Data Center; and the gainful employment regulation.
College Scorecard
This federal dataset includes information on student loan repayment rates at the institutional level. It tracks the percentage of borrowers who have not defaulted and have paid down at least $1 of their original balance. The scorecard includes data on students who entered repayment in the 2006 federal FY; students who entered in FY 2013; and students who entered repayment in some years in between. It reports data one, three, five, and seven years after borrowers entered entering repayment. It excludes borrowers who have a military or an in-school deferment only if they were in that status at the time of measurement.14 Repayment rates can be broken down by several borrower characteristics, including by whether or not students graduated, students’ gender, whether students are first generation students, and students’ family income. However, these disaggregations are often unavailable at smaller institutions due to privacy suppression rules.
National Center for Education Statistics surveys
The statistical arm of the Department of Education operates two sample surveys that provide additional data on student loan repayment. One is the Beginning Postsecondary Students Longitudinal Study (BPS): It looks at what happens to a cohort of students who entered college in the same year. Typically, the survey tracks results for only six years, but NCES released an update in fall 2017 that paired loan data from students who entered in the 2003-04 academic year with those students’ loan results in 2015. This provided a look at how borrowers did on loan repayment within 12 years of entering college. These data can answer the questions of whether borrowers defaulted and how much they owed in 2015 compared with what they originally borrowed. Data can be further broken down by race, gender, completion status, starting family income, and many other characteristics. Because the BPS is a national survey, data are not available at the state or institutional level.
Similarly, NCES publishes the Baccalaureate and Beyond Longitudinal Study—the most recent of which tracks students who earned a bachelor’s degree in 2007-08 for four years through 2012.15 This survey also includes data on the repayment status of loans.
Federal Student Aid Data Center
This is a website administered by the office of Federal Student Aid. It includes information on the overall student loan portfolio, such as data on the nationwide number of borrowers and the number of loans at different levels of delinquency. It does not include any data that captures the share of balances repaid.16
Gainful employment
The Department of Education created this regulation to hold career training programs accountable for producing graduates who received federal aid and have excessive debt compared with their incomes. The Education Department included a repayment rate in the version of the rule published in 2011 and considered including a repayment rate in the version of the rule finalized in 2014. The 2011 rule calculated the original principal balance of loans that borrowers held for which they had reduced their principal by at least $1 from what they originally borrowed. In other words, if a student had $10,000 in debt and repaid at least $1, then that full $10,000 went in the repayment rate numerator. These repayment rates are available for all certificate programs at public, private nonprofit, and private for-profit colleges, but only for degree programs at private for-profit colleges. Data are not broken down by any additional categories.
Combined, these different data sources represent far more information on student loan repayment than was available a few years ago. But almost all of them only report the number of borrowers in different repayment statuses at a set point in time. What’s missing is data on the paths borrowers took to get to those places. These gaps matter because borrowers can take multiple routes to nonrepayment—not all of which are necessarily concerning from a policy standpoint. As the next sections show, understanding the nuances in borrower outcomes as well as how they get there is crucial for constructing a repayment rate that appropriately captures worrisome results.
Every borrower counted in the cohort default rate has one thing in common—they did not make scheduled payments on a federal student loan for at least 360 days. That makes it easy to construct a measure of student loan default. The same cannot be said for indicators of student loan repayment. There are multiple ways to define repayment success and a variety of paths students can take to achieve those outcomes. That means policymakers need to be careful in how they design a repayment measure, ensuring they only hold institutions accountable for worrisome outcomes.
1. What is successful repayment, and how should it be calculated?
To date, there are two main proposals for how to define successful repayment. The most recent proposal comes from legislation introduced in the U.S. House of Representatives to reauthorize the Higher Education Act. It proposes that successful repayment means a borrower did not default; is not in certain deferment statuses; and is not more than 90 days delinquent at the end of the third FY in repayment.25 Borrowers who have an in-school deferment or a military service deferment at the time of measurement count as repayment successes.
Although called a repayment rate, this measure is more a reflection of an active repayment status or excused absence. It does not tell much about a borrower’s long-term repayment trajectory.
The most commonly used definition of repayment rates takes a different approach. This definition appears on the College Scorecard. It defines success as a borrower who has not defaulted and has repaid at least $1 of their original principal balance after three years in repayment. This measure deems a borrower a success if they owe anything less than what they borrowed.
The challenge with this approach is a $1 reduction in principal after three or more years in repayment is not evidence that the borrower is on a path toward paying off a loan in any reasonable amount of time. For example, borrowers who owe $10,000 with a 5 percent interest rate when they enter repayment should have retired just over one-quarter of what they owed after three years in repayment on the standard 10-year plan. Even if they are paying off the loan over 25 years, they should have reduced their principal by almost 10 percent.26
Unfortunately, current data do not indicate how many borrowers paid down far more than $1 paydown test rather than only just met it. If it turns out that most borrowers who pass the repayment test paid down much more than $1, then the measure still may be capturing the right individuals as successes, even if its definition is not ideal.
Policymaker recommendation: Strive for a more ambitious bar for what it means to achieve repayment success. The bar should define success as meaning that borrowers have not defaulted and owe no more than what one would expect to still be outstanding on their loan if they were to pay down the debt over a 25-year period. What this measure tests for is whether it looks like borrowers are going to pay off their loans within the longest timeframe afforded prior to loan forgiveness. The goal is to ensure that the federal government does not issue too many loans headed toward eventual forgiveness.
Calculating repayment rates
The next issue is whether to calculate repayment rates based upon the percentage of students repaying or the value of the loans that are on track for repayment. Both have benefits and drawbacks. Unfortunately, without better public data available, it is difficult to know which approach is superior.
A student-based calculation treats all borrowers equally. This formula defines a threshold for the percentage of students who attended an institution or program who must have demonstrated successful repayment within the desired number of years after entering repayment. Most proposals have said that programs or institutions must have at least 45 percent of their borrowers repaying.27
The main argument for a student-based approach is that it ensures that if an institution produces a high number of poor results for lower-debt borrowers, the problem does not get masked by successful students who may owe more. Within a given program or institution, students who graduated tend to have higher debt levels than those who dropped out. But dropouts are also more likely than graduates to struggle with their loans. A student-based measure ensures a school will remain concerned about dropouts because they can hurt its overall rate.
A dollar-based approach, by contrast, allows a sufficient number of successes to cancel out failures. There are two ways to use a dollar-based approach: 1) weighting students by the size of their loan balance or 2) pooling all loans together. The weighted student approach calculates the result for each student but expresses the result in terms of their loan balance. Imagine, for example, that a school had two borrowers who entered repayment—one who owed $10,000 and another who owed $30,000. The borrower who owes $30,000 repays while the borrower who owes $10,000 does not. In a dollar-weighted formula the repayment rate is thus 75 percent—$30,000 divided by $40,000—because three-quarters of the loan dollars are held by students who are repaying. This is how the 2011 version of the gainful employment rule calculated repayment.28
Using a dollar-based approach is less desirable than a student-based approach. Focusing on dollars instead of students downplays the plight of dropouts and overweighs the outcomes for graduates, as they typically have larger loan balances. It would also be harder for students to understand when evaluating an institution’s track record.
A pooled approach is the better option for judging repayment based on dollars. This calculation treats all the loans issued to a given institution or program as if they were one big loan. Then, it tests how much of the total amount has been repaid. In other words, if the total original principal balance of all loans at a school is $100,000, the school would have to show that the cumulative remaining balance after several years meets the bar for successful repayment.
The advantage of a pooled approach is that policymakers only have to define what the bar for successful repayment should be instead of also determining what percentage of students must successfully repay. In other words, once they have defined what is acceptable evidence of repayment, policymakers do not have to decide whether it is acceptable for 35 percent, 45 percent, or some other share of students to default. Instead, a pooled approach assesses whether the cumulative amount of outstanding loans at an institution are at or below a target for reduction. This approach also gives schools credit for students who pay down a large portion of their debt because they can counterbalance other balances that may have grown. That said, a pooled repayment is more useful for policymakers concerned with the question of whether a school’s borrowers are likely to create a cost for taxpayers by having loans go unpaid and may be less useful as a measure for consumers.
Policymaker recommendation: Obtain data and modeling from the U.S. Department of Education to understand the effects of different repayment calculations. This should include asking if—or how—results vary by income. Ideally, it should also include disaggregate results by race, though that breakdown may not be available using current student information collected.
Measurement time frame
In general, most proposals for repayment rates suggest something similar to the three-year window used for student loan default rates. The reason for this length appears to be because it reflects current law. That said, any measurement window needs to balance looking far enough out so that results seem stable but not so far out that it may not be fair to attribute the results to the institution. In other words, looking at results after just one year may be too soon, but judging a school based upon its 15-year repayment rate may capture results beyond the length of time that is reasonable for holding a school fully responsible for them.
In that light, a three- or five-year repayment window seems to do the best job balancing immediate and long-term results. Beyond that, policymakers should model the extent to which results change between those two points in time to see if the shorter window is sufficiently stable. This will obviously depend on the specific way repayment rates are calculated, but a review of College Scorecard data for multiple cohorts over time suggests that the rates change enough between three and five years that it is worth considering the best measurement length.29
Policymaker recommendation: Model repayment rates yearly from three to five years into repayment in order to identify the most stable point to measure results for accountability purposes. Separately, consider publishing even longer-term rates—such as 10-year figures—for transparency’s sake and to provide consumers information.
Setting a repayment benchmark
After defining acceptable repayment, policymakers need to determine the threshold for what share of a school’s borrowers or dollars must meet that standard to avoid sanctions. Unfortunately, there is no widely accepted benchmark. Earlier iterations of the gainful employment regulation suggested that programs should face sanctions if 35 percent or fewer of their borrowers repaid. A judge, however, ruled that the Department of Education did not properly justify that threshold. 30 A House bill to reauthorize the Higher Education Act suggested a threshold of 45 percent on a measure with a different definition.31
Policymaker recommendation: Obtain better data from the Education Department to model the percentage of institutions that pass or fail different repayment rate benchmarks. This should be supplemented by student-level analysis of how nonpaying borrowers experience repayment. For instance, this analysis should look at whether borrowers missing the repayment test are simply not making large enough payments; are using deferments or forbearances; or are not making any payments at all.
2. How should repayment rates address subsequent enrollment at another institution?
Any discussion of repayment rates needs to consider how to treat students’ subsequent enrollment at other institutions. This is especially an issue for students who go to graduate school, but it also matters for students who transfer among undergraduate institutions.
Students who acquire debt from multiple institutions complicate the repayment rate in two main ways: 1) growth of loan balance due to in-school deferment and 2) behavioral changes due to higher debt levels.
When students enroll at another institution of higher education, they get an in-school deferment. Under this deferment, some loan types will continue to accumulate interest, which is then added to students’ principal balance the next time they enter repayment. This matters because a student who enters repayment but then transfers or goes to graduate school could appear to fail a repayment test solely because they are not paying accumulating interest while enrolled at another institution. If a repayment measure does not account for interest accumulation during this subsequent enrollment, the original school’s results will seem unfairly negative for reasons outside its control.
Furthermore, long-term repayment data from the Department of Education suggest that in-school deferments may be contributing to students owing more than they originally borrowed. Of students who started school in the 2003-04 academic year; borrowed; and, in 2015, owed more than they originally borrowed, 36 percent had used at least one in-school deferment.32
The second issue with debt from multiple colleges is that a higher total loan balance can change repayment behavior. Imagine that a student starts at a community college and borrows $5,000. Then, they go to a public four-year school and borrow another $20,000. That additional debt burden may make them more likely to use income-driven repayment (IDR) because they get a larger payment reduction. This could possibly result in them not paying enough to retire the original debt at a speedy pace. Alternatively, they may not be able to handle their total balance, forcing them into a deferment or forbearance. Similarly, if a borrower cannot afford the full payment on their loan balance, then partial payments may not reduce the lower debt from the first school as much as they otherwise would. The result of this change is that a student who may well have repaid successfully on their community college debt could now come up short, lowering that school’s results for reasons outside its control.
The College Scorecard currently handles the issue of debt from multiple colleges that has been consolidated by proportionally assigning outstanding balances based upon what a borrower originally owed. For example, a borrower has $10,000 from Institution A and $15,000 from Institution B, making their total balance $25,000 if consolidated. When measured for repayment, they have made enough payments so that their total balance owed is now $24,000. The Department of Education would then assume that Institution A has a loan balance of $9,600—40 percent of the remaining total and the same share of the student’s total debt originally borrowed at Institution A—and Institution B has $14,400 left.33 This approach has the benefit of ensuring that payments on a consolidation loan get fairly shared between schools. However, it does not account for the fact that the borrower may have to reconsider how they pay the $10,000 owed to Institution A in light of the additional debt from Institution B.
Policymaker recommendation: For the subsequent enrollment issue, hold institutions accountable for the balance owed upon entering repayment after the in-school deferment. In other words, if a student borrows $10,000, enters repayment, then goes back to school where the balance grows to $12,000, the latter amount should be the starting point for measuring whether a borrower has reduced their original balance. This approach ensures that the first school will not be held accountable for in-school interest accumulation due to attendance at another institution.
Looking at a loan balance once a student leaves a second school also has implications for the cohort in which a student should be placed. Students should only be measured for repayment purposes until they have been in repayment and not in a deferment or forbearance status for an amount of time equal to the measurement window. In other words, if schools are held accountable for a three-year repayment rate, borrowers should only be included once it has been three years since their last in-school deferment and subsequent grace period. This means that a student who is in repayment for two years and then goes to graduate school gets placed into a later cohort that starts after they re-enter repayment. The College Scorecard excludes these students entirely if they are in one of these deferments at the point of measurement; if they are not, the scorecard leaves them in the same cohort. While the approach suggested above may seem more complicated to administer, the change is necessary to ensure that borrowers are judged on a better measure of their balance upon entering default, then tracked for long enough to be assessed fairly on whether they can repay.
Concerns about how greater debt balances affect repayment are best addressed by assuming all payments get applied to debt from each school. An example highlights how this would work. Assume a borrower has $20,000 in student loans with $5,000 coming from one school and $15,000 coming from another. Their monthly payment is $200, with $50 going to the $5,000 debt and the rest going to the other loan balance. The repayment rate calculation should act as if the entire $200 payment went to both sets of loans. While this does result in double counting payments, it also ensures that neither school is harmed by the presence of debt from another institution.
3. How should repayment rates address income-driven repayment?
The IDR plans present complexities for repayment rates. These plans are a crucial safety net for borrowers that must be preserved. They help borrowers avoid default on debts they could not otherwise afford and give them an eventual path out from under their loans. An IDR plan, however, is not a get out of jail free card for institutions. A school where large numbers of students avail themselves of IDR plans may be providing an education too expensive compared with its economic return.
Using IDR can alter a borrower’s perceived repayment success in a few ways. First, by offering borrowers payments below what they would make on the standard 10-year plan, it is possible that a borrower may make all their required payments but still see their balance grow, either because interest is accumulating or because their principal balance is getting retired more slowly. Yet it is important to understand that just going on IDR does not guarantee that borrowers will fail to cover their interest payments. For example, a borrower in a one-person household who owes $10,000 must earn about $32,500 to make payments on IDR akin to what they would on the 10-year standard plan. But if they make more than about $23,500, then they will still cover some of their accumulating interest.34
The timing lag of IDR payment calculations further complicates this issue. In most cases, a borrower’s payment for IDR purposes is based upon their income from the calendar year for which they most recently filed taxes. In other words, a borrower applying for IDR in the first quarter of 2018 might well be using 2016 income. This matters because students who go onto IDR right away will likely have their payments based off of the lower income they had in their last year of school rather than their current earnings. This results in lower payments for their first year in IDR, which can affect overall interest accumulation.
It would be easy to label a borrower making IDR payments that do not keep up with interest as a failure under a repayment rate test. But this brings up the second challenging effect of IDR: These plans make repayment progress nonlinear. Borrowers on IDR plans could still be on track to repay within a 20-year timeframe by paying down a much greater share of their loan balance within the final few years of repayment than they would on a standard plan. Consider, for example, a borrower who owes $6,000 with a 5 percent interest rate and starts making $16,000 in annual income on the Revised Pay as You Earn plan. In their first few years of repayment they will not keep up with interest growth. If their income grows at a steady rate of 5 percent, they will start paying down principal in the sixth year of repayment and pay off their loan entirely before receiving forgiveness.35 Current data, however, do not indicate how many IDR participants are likely to fall into this category.
Unfortunately, there is no ideal solution to the treatment of IDR plans in a repayment rate. Treating all borrowers in IDR as a success creates an incentive for institutions to push struggling borrowers to sign up for these plans. While that would be a good outcome for borrowers, it would also provide a way for institutions that charge too much or produce insufficient return to avoid accountability under the repayment rate measure. On the other hand, treating all borrowers who make insufficient payments on IDR as a failure has its own shortcomings. Some unknown share of these borrowers may actually be on an income trajectory that eventually results in paying off their debts before receiving forgiveness. Labeling them a failure has the potential to be unfair to institutions.
Even an in-between solution has challenges. For example, the first gainful employment rule included a provision that allowed programs to count up to 3 percent of total loan balances using IDR as a success. This acknowledges that some usage of IDR is acceptable, but excessive usage is not. However, it also establishes a cliff effect, in which an institution close to the tolerance has an incentive to counsel struggling borrowers away from IDR. It is also unclear how this approach would be applied for borrowers who are on IDR but making repayment progress.
A recent paper from Johnathan Conzelmann, T. Austin Lacy, and Nichole D. Smith from RTI International provides a potential alternative solution for addressing the IDR challenge.36 They suggest measuring the percentage of borrowers who are on time on their payments—regardless of what payment plan they are using. Because success on this measure does not depend on reduction in principal balance, it treats a borrower making payments below the rate of interest accumulation on IDR the same as one reducing their balance on a standard 10-year plan. One potential trade-off to this approach is that it would not hold institutions accountable if too many of their borrowers are poised to receive loan forgiveness due to not making enough money to pay down their debt.
Policymaker recommendation: Request more data from the Department of Education about the usage of IDR and how it might affect repayment rates. This includes data on the percent of borrowers—and their loan dollars—using IDR by school or program; what percent of these individuals would fail or pass various repayment rate tests; and how these results vary based upon the measurement timeframe used. The Department of Education should also model the proposed on-time payment suggestion from RTI to see how it compares to other attempts to account for IDR usage. It is also worth considering whether issues related to large numbers of students getting loan forgiveness through IDR should be tracked through a separate measure rather than being addressed through a repayment rate formula.
4. Should repayment rates be assessed at the program or the institutional level?
Evidence increasingly shows that on indicators such as earnings, the variation in results across programs within a given institution may be as great as or greater than the differences observed across colleges.37 This suggests that a program-level approach to accountability may be a more fruitful approach than looking only at an institution overall. It has the benefit of providing additional flexibility—an institution may very well have both exceptional and abysmal programs—and a program-level approach has the potential to hold the latter accountable while leaving the former untouched.
Policymakers must grapple with two challenges if they want to consider program-level repayment rates: How to handle noncompletion and whether there is always a meaningful distinction between programs. In addition, policymakers must recognize that there may be a trade-off between program-level accountability and tracking results for key racial or ethnic subgroups, as the number of borrowers may not be large enough. In other words, it may not be feasible to consider the repayment results of Latinx borrowers within a given program, forcing policymakers to choose between program or subgroup accountability.38
Noncompletion
It is easy to know if a student dropped out from an institution. However, what program they dropped out of may not be as clear. At more traditional institutions that predominantly award bachelor’s or associate degrees, a student may not declare a major or program until after their first or second year. So, a student who drops out before that point may not actually be traceable to a given program. Policymakers would thus have to create some rules for where to assign these students, which could have significant implications for whether a program passes or fails.
The challenge of dropouts who are not tied to programs appears to be particularly acute at community colleges. Approximately one-quarter of community college students who owed more than they originally borrowed within 12 years of entering school never declared a major or were not in a degree program.39 This is a smaller issue at private for-profit colleges, but their students still represent 10 percent of nonrepayers. How those students get distributed across programs could lead to distortions in a college’s repayment rate.
Simply forcing institutions to assign all students to a program may not be a workable solution. Consider a student who indicates they wish to pursue a specific program, then takes four courses their first term, one in the program and three in other areas; drops out; and does not repay. Is it fair to attribute the failure to the first program when it could in theory be applied to any of the other three?
While it is well established that outcomes vary among graduates of different programs, it is not clear if that is also the case for dropouts. Table 2 shows the percentage of student borrowers who started at a public college and owed more than they originally borrowed within 12 years of entering college. It separates the data based upon whether students earned a credential within six years of entry.
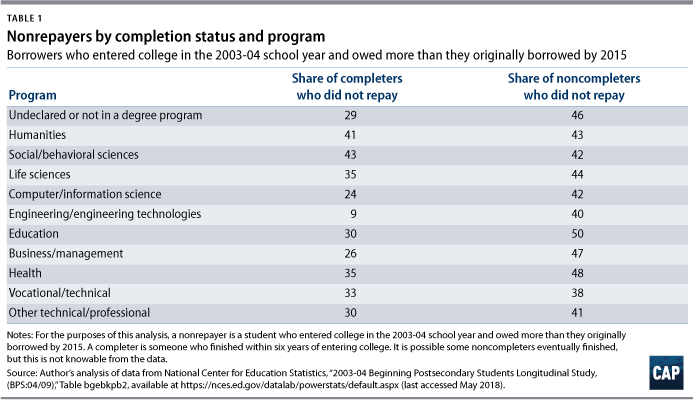 This table shows substantial variation among program types. For instance, just 9 percent of borrowers who finished an engineering program owed more than they originally took out compared with 41 percent of those in the humanities. But, it also shows that the results among students who did not complete are much more similar. For instance, 40 percent of engineering dropouts who borrowed failed to repay versus 43 percent of those in the humanities. This suggests that the meaningful differences by program may only manifest when looking at graduates—not dropouts.
There is no clean fix for this issue. One approach could be to treat institutions that require program declaration upon entry differently from those that do not. In other words, a vocational or graduate institution that has little overlap across programs would use a program-level approach, while other schools would be judged institutionally. This adds complexity and could create confusion about who is judged in what manner.
Alternatively, policymakers could decide to run repayment tests on graduates at the program level and judge institutions overall on repayment outcomes for noncompleters. In general, program-level accountability is better suited to looking at graduates because they are a more clearly defined group. It is also more reasonable to expect that the outcomes for students who finished different types of programs might vary more than the results for dropouts. If policymakers take this approach, they would need to set a higher repayment bar since graduates are more likely to succeed in general. But this reality creates challenging accountability questions. How should policymakers interpret an institution where its dropouts, overall, fare poorly but its graduates do well? That would lead into questions of not just repayment success but also acceptable completion rates.
Policymaker recommendation: Request greater data from the Department of Education to allow for an understanding of how repayment outcomes vary by completers versus noncompleters and whether the department can track noncompletion by program.
Program distinction
The point of program-level accountability is that there is evidence that student outcomes can differ as much across programs at a given institution as they may between schools. This makes sense when considering that two programs may be preparing students for very different fields and career options. For instance, the opportunities available to someone getting an associate degree in nursing are different from those available to someone pursuing a certificate in culinary arts. Thus, program-level accountability ensures that educational options with very good returns are not unfairly lumped together with those that may be less successful. This approach makes a great deal of sense for career-focused programs that are training students to do very specific, disparate jobs with different salary prospects.
It is less clear whether a program-level approach is as useful for undergraduate liberal arts degrees. For instance, a student receiving an English degree is generally considering the same range of occupational options as someone who majors in history or philosophy. Tracking all these results by program may not be particularly useful. It could also make it harder to assess outcomes because some programs have a small number of students.
Policymaker recommendation: Consider whether it is feasible to assess results by undergraduate college instead of program, particularly at liberal arts institutions. This avoids making distinctions between history and English, for example, but would still allow for the separation of liberal arts majors and engineering majors. Looking at results by undergraduate college could also ensure that cohorts are large enough to look at key equity groups by race and ethnicity, gender, and income. Additional data from the Department of Education would assist in judging the feasibility of this approach as well as the anticipated effects. This approach should also consider whether graduate-level programs need any sort of aggregation for sample size reasons. Even though master’s programs in the humanities may each have their own admissions policies, for example, it may be worth combining their data if the number of students in one cohort is too small. By contrast, professional programs such as law, medicine, and business should be measured separately because they are likely to be bigger and they prepare students for fundamentally different career prospects.
5. What should the consequences be if schools miss the repayment rate benchmark?
The consequences attached to failing a repayment test matter too. Loss of federal aid eligibility must be one of the options on the table, but it cannot be the only one. Schools are so dependent on federal aid that taking it away would likely lead to a school closing, making financial aid termination a nuclear option that is very tough to use. Putting all accountability emphasis on the loss of aid thus creates a dynamic in which policymakers may be reluctant to use the one tool at their disposal.
But the current cohort default rate has insufficiently meaningful intermediate sanctions. For instance, institutions with default rates above 5 percent cannot disburse loans in a single installment for students studying abroad. In addition, institutions with default rates above 15 percent cannot disburse loans in a single installment for any students and have to wait before making initial loan payments for incoming first-year students.40 After that, the only sanction a school faces before potential loss of eligibility is the need to create a default management plan the first time their rate goes over 30 percent.41 As a result, there are no intermediate sanctions that encourage schools to get better before they trip the threshold that puts their aid at risk. There are also no intermediate sanctions to protect students from schools with worrisome default results.
Policymaker recommendation: Consider the roles of incentives beyond aid loss in shaping an accountability system. This will mean considering whether there are performance levels that might only require warnings. Other results may indicate the need for obtaining greater financial protection from institutions, such as a letter of credit or risk sharing.
These incentives and measures cannot operate in a vacuum. Policymakers should consider performance on multiple measures. For instance, poor performance on several measures might be just as worrying as abysmal results on a single indicator.42 In other words, institutions that have well below average results on loan repayment, college completion, and default may be just as concerning as schools with the worst repayment rate but average completion rates. Similarly, policymakers should establish a system of monetary bonuses that reward institutions that demonstrate the ability to succeed with traditionally underserved populations.
6. Should there be a distinction between default and nonrepayment?
One potential benefit of repayment rates is that they can capture a wider range of student loan struggles than a default rate does. But that does not mean the additional student loan failures captured by a repayment rate are as bad as a default. After all, defaulting on a student loan can lead to ruined credit and wage garnishment as well as seizure of tax refunds and Social Security checks.43 It also makes students ineligible to receive additional financial aid—a potential barrier for a student who did not finish college to re-enroll. Borrowers who do not repay but also do not default face none of these consequences.
Thus, focusing on repayment has some risk that the worse consequences of default for borrowers will be masked. This could occur in a few ways. One is that an institution with a high default rate could appear to have the same repayment rate as an institution where few students default but many do not repay. Institutions judged only on a repayment rate could also have incentive to simply focus on helping borrowers who are close to repaying, while other borrowers languish in default.
Data limitations make it difficult to understand the trade-off of looking at repayment only versus repayment and default. The Department of Education does not currently break down repayment rates to indicate how many borrowers who do not repay do so because of defaulting versus some other reason. If the department were to indicate this split, it would assist in understanding the extent to which default problems might get masked in a repayment rate.
Policymaker recommendation: The Department of Education should publish a breakdown of nonrepayers that clarifies how many borrowers do not repay due to default versus other reasons. Policymakers, meanwhile, should consider preserving a student loan default rate and then calculating a repayment rate for nondefaulters as well as the combined result of both indicators. This approach has the benefit of keeping a focus on default while still holding institutions accountable if borrowers do not repay their loans. Similarly, looking at the combined result ensures that a school that does poorly on both but not enough to trip consequences on either alone could still get caught.
These six questions are not intended to suggest that a repayment rate is infeasible or a bad idea to pursue. Using such a measure to expand the discussion of what it means to succeed with a student loan is a valuable contribution to making the federal financial aid programs work well for students. As these questions show, however, it is imperative that policymakers take a more considered approach to why they want to use a repayment rate measure; what problems they want to capture with it; and what incentives they want it to set.