Every year, 1 million student borrowers default on nearly $20 billion in federal loans.1 New data present the best picture ever accessible of who these borrowers are, the path they took into default, and whether or not they were able to return their accounts to good standing.2
The data show that the average defaulter looks very different from stereotypical portrait of a college student as someone who comes straight to college out of high school and lives in a dormitory on campus while pursuing a bachelor’s degree. Defaulters are more likely to be older, be Pell Grant recipients, and come from underrepresented backgrounds than those who never default. The median defaulter takes out slightly over $9,600—just more than one-half of what the median nondefaulter borrows.3 Three out of every 10 defaulters are African American and nearly one-half of all defaulters never finish college.
By and large, defaulters do not follow a straight line from entering repayment to defaulting at the earliest possible moment, after 270 days of delinquency. Instead, data show that defaulters take advantage of opportunities to pause payments without going delinquent. The median borrower took 2.75 years to default after entering repayment.4
Sadly, once borrowers defaulted, many had trouble getting out. Forty-five percent of defaulters have not found a solution to return their most recent default back to good standing. Of the 55 percent of defaulters who resolved their most recently defaulted loans, almost one-half did so by paying off the debt—a solution that could require them to pay large amounts in collection costs. These figures also do not reflect the fact that each year nearly 100,000 borrowers default on their loans for a second time.5
Unacceptable default rates have equity and accountability implications as well. Repayment solutions fail the nearly one-half of African American borrowers who default on their loans.6 Although the federal government measures and enforces sanctions on colleges with high default rates, the accountability measure fails to track almost one-half of all defaults, which explains why only 10 institutions are at risk of losing access to federal aid this year.7
Federal policy cannot allow this default situation to persist. To be fair, it is possible that future numbers could look better as more borrowers take advantage of income-driven repayment (IDR) plans. These plans tie monthly payments to a set share of a borrower’s income, which in turn makes loan payments more affordable. However, there is minimal public information available on the characteristics of borrowers using these options. The effect of reforming repayment on the path out of default is also unclear. The U.S. Department of Education should conduct more analyses to assess how well these income-based payment plans address the national default problem and to determine if there are certain types of borrowers who need repayment assistance beyond these plans.
Furthermore, the conversation around student loan defaults must include the role that institutions play. Federal repayment options can only be effective if students leave school having acquired insufficient skills and knowledge or if they drop out after a short time. Changes to federal accountability systems—such as the creation of a risk-sharing system that requires institutions to cover a portion of costs when student loans go bad—may provide new incentives needed to encourage institutions to better focus on preventing the educational conditions that later lead to default.8
Background on student loan default
A federal student loan enters default when a borrower fails to make a payment on it for 270 consecutive days.9 When this happens, the borrower’s loan is transferred from the student loan servicer—a private contractor responsible for collecting payments on behalf of the federal government—to the Debt Management Collections System.10 Borrowers then have 60 days to come to a repayment arrangement with the Education Department. If no agreement is reached, the loan is transferred to a student loan debt collector.
Borrowers can face several consequences for entering default. First, defaults are recorded on borrowers’ credit reports, lowering their credit scores and potentially making it harder for them to obtain future loans, apartments, or even jobs.11 Second, defaulters can have their wages garnished or tax refunds seized, and older defaulters may lose a portion of their Social Security payments.12 Default also prevents borrowers from receiving any additional federal student aid until their loans return to good standing, making it more challenging for dropouts to return to school. Lastly, defaulters are legally required to pay for the costs of debt collection—which can be as high as 25 percent of their defaulted loan balance—to get rid of their debt.
The federal government offers borrowers two options to return a defaulted loan to good standing without having to pay off the balance. Borrowers may rehabilitate their loans—a process in which they make nine consecutive on-time payments of an agreed-upon amount. After that, the loan returns to good standing and the history of default is removed from their credit report. The record of delinquency, however, remains.13 Loans may only be rehabilitated once. Alternatively, defaulters can consolidate their loans to leave default. To do so, they must either make three on-time payments or agree to a payment plan in which their monthly bill is tied to their income.14 Consolidated loans can return to good standing, but borrowers’ credit report history does not get erased. Borrowers can consolidate a single loan one time, unless subsequent consolidations involve at least one loan that was not already consolidated out of default.
Current data on student loan defaulters is insufficient
Today, approximately 8 million Americans are in default on more than $178 billion in student loans.15 These borrowers can have their wages garnished, tax returns taken, and even lose parts of their Social Security benefits.16 Until recently, the department had not released sufficient data on who defaults on federal loans. The Education Department only produces one institution-level report on defaults—a measure of how many borrowers defaulted within three years of entering repayment.17 Those data lack basic information about the amount of debt held by defaulters.18 To the department’s credit, it has released significantly more data on loan outcomes by school through the College Scorecard, though none of these figures include specific information on default.19 All other data on default are reported for the entire portfolio or as sector-level budget projections.
In early October 2017, the Education Department’s statistical arm released data on repayment outcomes within 12 years of entering higher education for students who started in the 2003-04 academic year.20 By combining student surveys and administrative data from transcripts, financial aid databases, and other sources, these data allow for the most robust analysis of loan default to date. They make possible three types of analyses: demographic breakdowns of defaulters; longitudinal tracking of how long it took borrowers to default; and what happened after defaulting.
The nation’s current system of higher education puts the most vulnerable students at the greatest risk of default.
These recently released data, as well as other, more comprehensive data on default and loan repayment, can assist policy efforts to lower persistently high default rates. For instance, IDR plans—which take the sting out of monthly payments by tying what a student pays to their income—have been hailed as the answer to student loan default. The Government Accountability Office found that not only are borrowers on IDR plans less likely to default than their peers on other repayment plans, but also that students who are most at risk of default often do not take advantage of the IDR option.21 Furthermore, only minimal data exist on the number and characteristics of defaulted borrowers who tried to use one of these repayment options. Similarly, no available data allow policymakers to evaluate the effectiveness of economic hardship deferment or voluntary forbearance—two options that allow borrowers to temporarily stop payments—or to determine if these options help individuals get back on track or are simply waypoints to default.22
While it may not be possible to eliminate every last default, seeing so many students fail to repay despite the array of repayment options and benefits suggests that policymakers could do a better job investigating what successfully keeps students in good standing on their loans. Understanding the problem is the first step.
Defaulters represent a large portion of today’s college students
Student loan defaulters largely resemble the students who occupy campuses today. Students who entered college in the 2003-04 school year, took out a federal loan, and defaulted at some point are older, lower-income, and more likely to be financially independent than both borrowers overall and those who did not default. Defaulters are also more likely to be students of color.
Table 1 presents more detailed information on the characteristics of defaulters. The right-most column shows the percentage-point difference between the share of defaulters in a demographic category versus the overall set of loan borrowers. For instance, it shows that while 19 percent of all students who took out a federal loan started at a private for-profit college, 38 percent of all defaulters began at that same type of institution—a difference of 18 percentage points.

The figures in Table 1 show the extent to which the nation’s current system of higher education puts the most vulnerable students at the greatest risk of default. For instance, nearly 90 percent of defaulters also received a Pell Grant at one point; 70 percent came from families where neither parent earned a college degree; 40 percent came from the bottom quarter of the income distribution; and 30 percent were African American.23 These groups are overrepresented among defaulters by double-digit margins. By contrast, white students make up 60 percent of federal loan borrowers, but just 44 percent of defaulters.24 Similarly, while more than one-third of borrowers received a bachelor’s degree, only 10 percent of defaulters earned this credential.25
Defaulters borrowed less than nondefaulters
Typical media narratives portray borrowers with large debts as those most likely to struggle.26 While these individuals may have trouble affording their payments, they are not at as great a risk of default as those with smaller loan balances.
Table 2 shows the median debt load for students who defaulted on their loans broken down by attainment status, the first type of institution attended, and race. In almost every case, the median loan defaulter owed thousands of dollars less than their peers who did not default. For instance, the median defaulter owed $9,625—$8,500 less than the median loan balance for a nondefaulter.
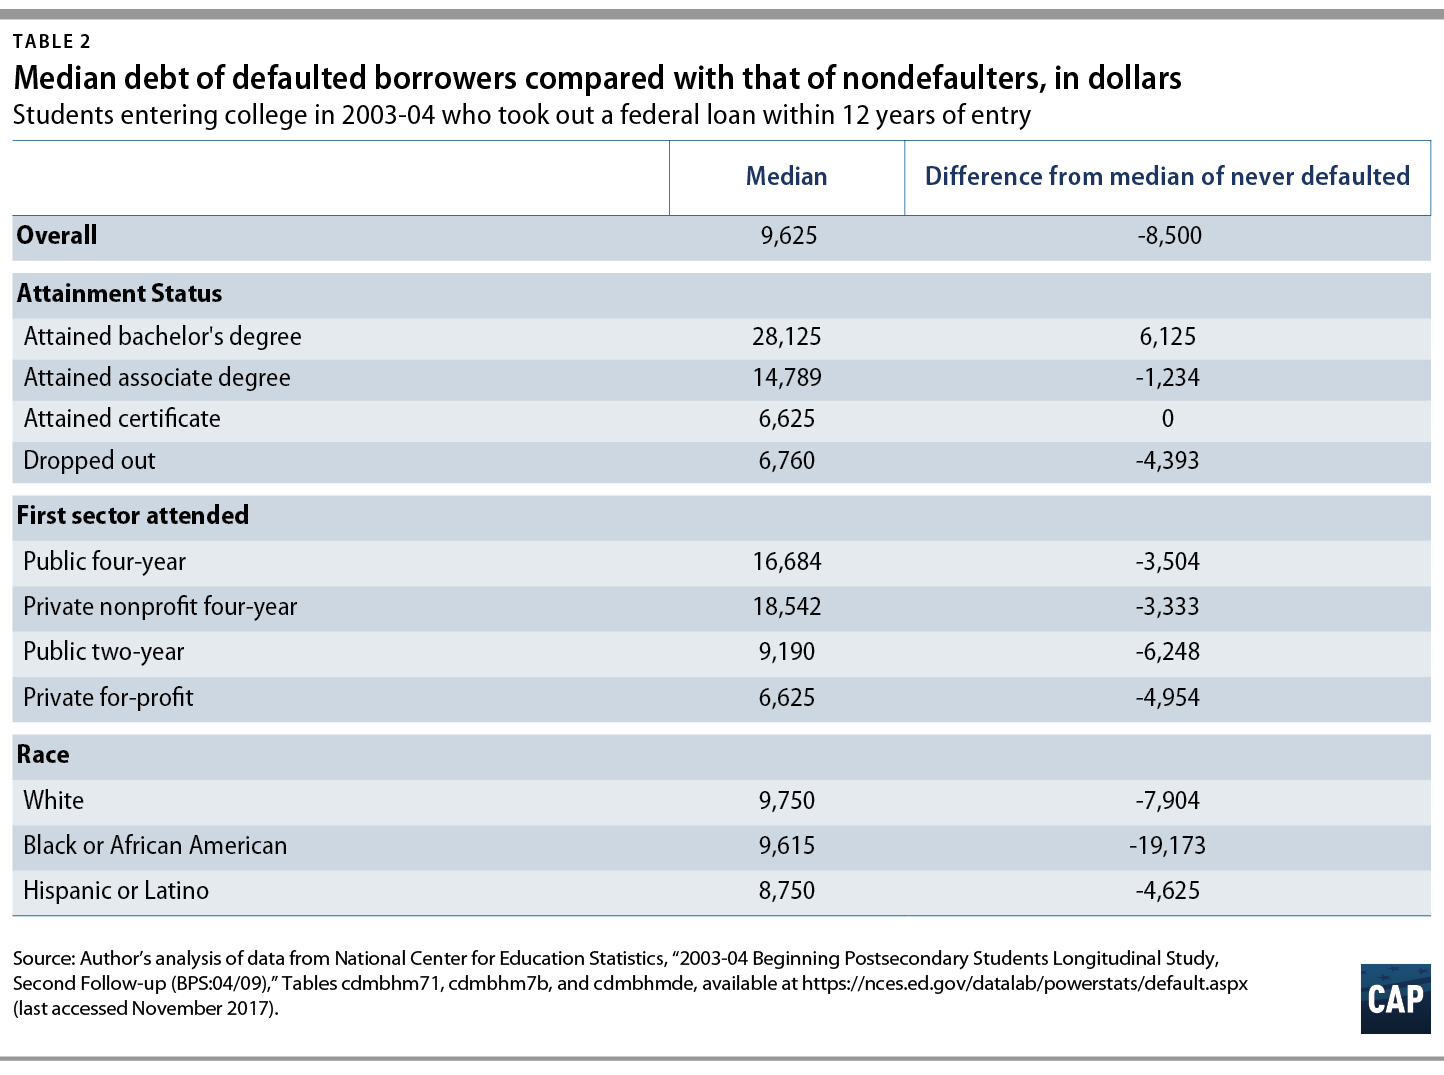
Interestingly, individuals who attained bachelor’s degrees were the only group where the median defaulter owed more than the median nondefaulter. The median defaulter who completed a bachelor’s degree owed $6,125 more than the median nondefaulter.
Defaulters are not immediate dropouts
Driven by research from the Association of Community College Trustees (ACCT) and the Obama administration’s Council of Economic Advisers, conventional wisdom in higher education policy now recognizes that dropouts are at greater risk of default than college graduates; new data confirm that finding.27 Of students who entered higher education in the 2003-04 academic year and borrowed federal loans, 49 percent of those who defaulted dropped out of college, while just 10 percent finished a bachelor’s degree. Only 5 percent of defaulters borrowed for graduate education.28
New data also shed light on how far borrowers made it into their programs. Table 3 shows the median number of postsecondary credits earned by students who defaulted across a variety of characteristics. Surprisingly, the median dropout earned 24 credits, the equivalent of two semesters at what is considered a full-time load. This is notably higher than previous default analyses. A 2015 ACCT study, for example, found that nearly 60 percent of defaulters from Iowa community colleges accumulated less than 15 credit hours.29
There may be a technical reason for this discrepancy. Methodology documentation produced by the National Center for Education Statistics (NCES) notes that 8.5 percent of the student sample did not include transcript data.30 If many of these students borrowed and dropped out without accumulating any credits, then the median figure for credits earned would decrease.
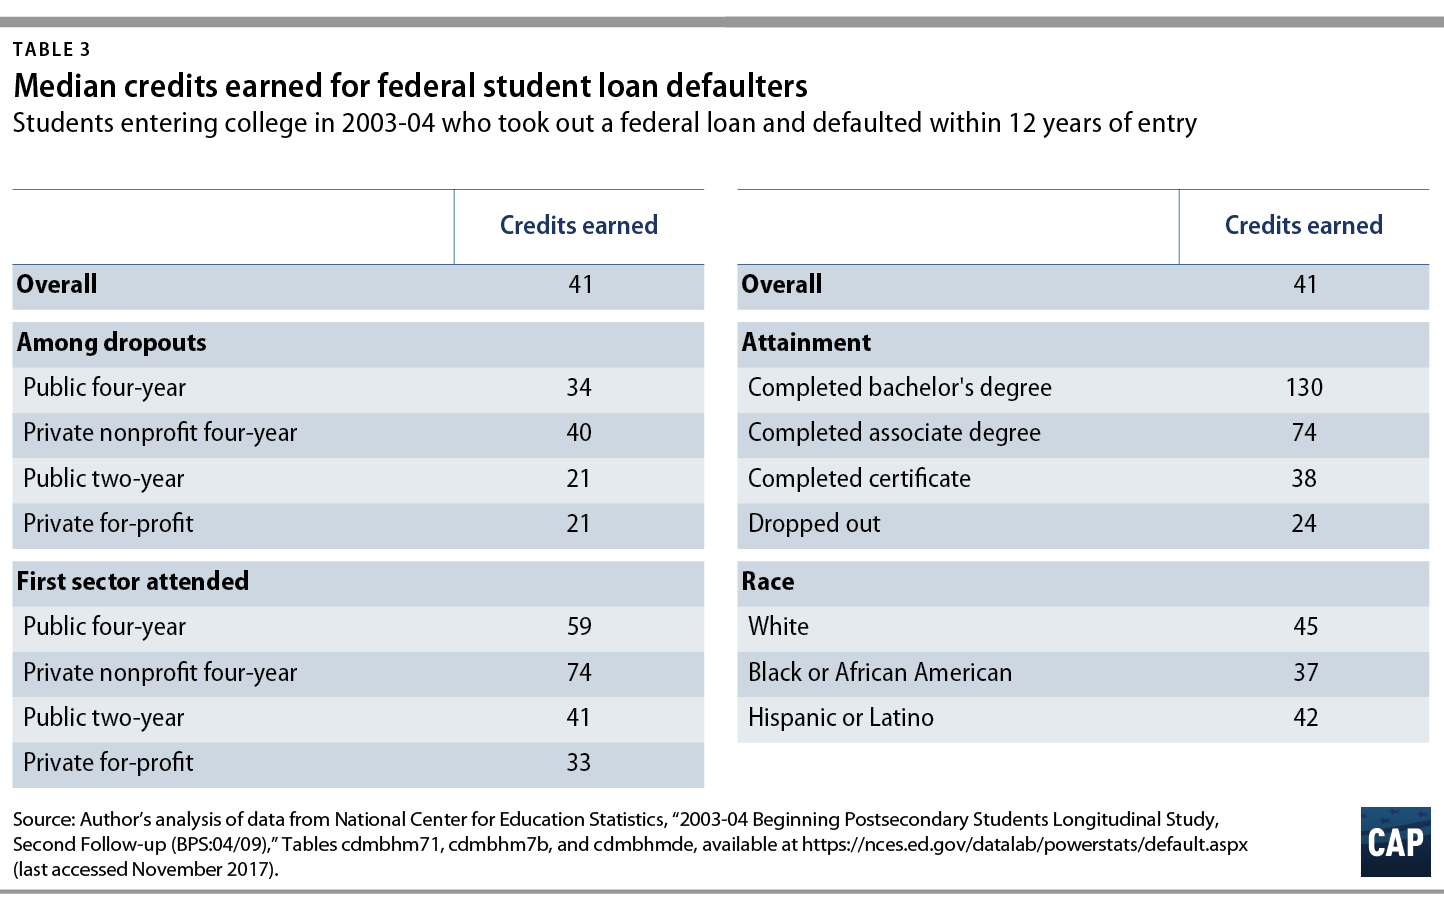
Table 4 presents data on how defaulters performed in their courses as measured by GPA on a four-point scale. Overall, defaulters tended to have lower GPAs than nondefaulters. For instance, the median dropout who defaulted had a 2.0 GPA. The median defaulters who also finished a credential had grades in the C+ or B- range, which is high enough to be considered good academic standing.
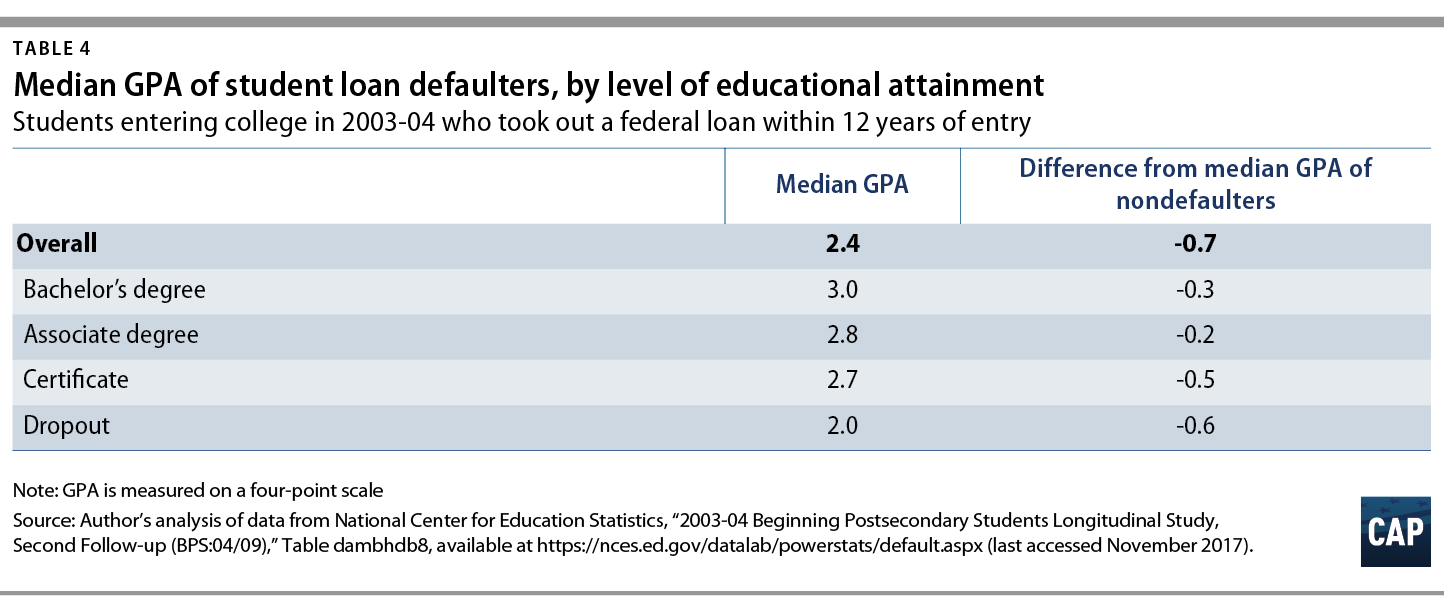
These tables show that while defaulters may not be top students, they are often capable of doing college-level work. Institutions and policymakers should reexamine the factors that cause students to drop out and determine whether the reason why a student dropped out affects their odds of defaulting. For instance, policymakers should assess how default rates compare across borrowers who drop out due to poor academic standing, versus those who drop out due to an unexpected economic shock such as a broken car or loss of child care.
Borrowers take years to default
Even after a borrower leaves school, it typically takes some time for them to default. In fact, the median defaulter took two years and nine months to default after entering repayment—significantly longer than the nine months it takes to default without a payment.31
Table 5 shows the breakdown in the number of years between when borrowers entered repayment and when they defaulted. Fifty-three percent of borrowers who defaulted did so within three years of entering repayment. Approximately one-quarter defaulted between three and five years, while another one-quarter defaulted after five years or more.

These findings have implications for accountability measures tied to student loan default rates. When these defaulters entered higher education, colleges were judged by the share of their borrowers who defaulted within two years of entering repayment.32 According to the data in Table 5, that approach failed to account for nearly two-thirds of all students who eventually defaulted. In 2008, Congress extended the default rate window to three years, though even that only captures slightly more than one-half of all defaults.33
Unfortunately, the new NCES data are not detailed enough to indicate whether defaulters made payments before defaulting. It does indicate, however, that the median defaulter used two forbearances, which could mean that they went up to two years with no payments.34
The NCES data also provide no information on the payment plans borrowers used. Since 2007, policymakers have tried to reduce defaults by creating additional plans that tie borrowers’ payments to their incomes.35 While most of these plans were likely created after many dropouts entered repayment, it would be helpful to know if and how students’ usage of different repayment plans changed over time. To enable analysis of payment plans, the NCES should include this information in future iterations of the survey.36
Only slightly more than one-half of defaulters fix their debt
The Education Department offers several options to return a defaulted loan to good standing. Borrowers can rehabilitate their loan once, meaning they can make nine agreed-upon payments over 10 months. Alternatively, they can consolidate defaulted debts into a new loan. Defaulters could also have the debt discharged for reasons such as a permanent and total disability and, in very rare cases, through bankruptcy. And, of course, if they have the means, they could pay the debt off. The goal of these options is to ensure that default is not a lifelong sentence to financial ruin.
Many defaulters fail to make use of these options to return their loans to good standing. As shown in Table 6, only 55 percent of defaulters took steps to resolve their most recent default. Of those who did resolve their most recent default, nearly one-half paid off the debt in full. This is a potentially expensive option, given that borrowers may have to pay as much as an additional 25 percent of their loan balance in collection costs.37 Meanwhile, about one-third of individuals who resolved their most recent default did so through rehabilitation, while 15 percent used consolidation. Unfortunately, it is difficult to use the data to determine whether any of the students who fixed their loans once later defaulted a second time.
Comparing loan balances owed with the means through which borrowers resolved defaulted debts partially explains the large share of borrowers paying off their loans. Borrowers who paid off defaulted loans owed under $5,000, which is less than one-half of what borrowers who rehabilitated owed and about one-third of what those who consolidated or did not resolve their default owed. Unfortunately, the data do not show whether these debts were paid off through voluntary or involuntary means. For example, borrowers could have paid off their debt by having the federal government seize enough of their tax refunds or garnish their wages over time. Borrowers could also have made payments that immediately retired the debt. Knowing more about the different ways in which loans are paid off would have policy implications and affect whether the tools currently used to collect on defaulted student loans are judged as the right ones.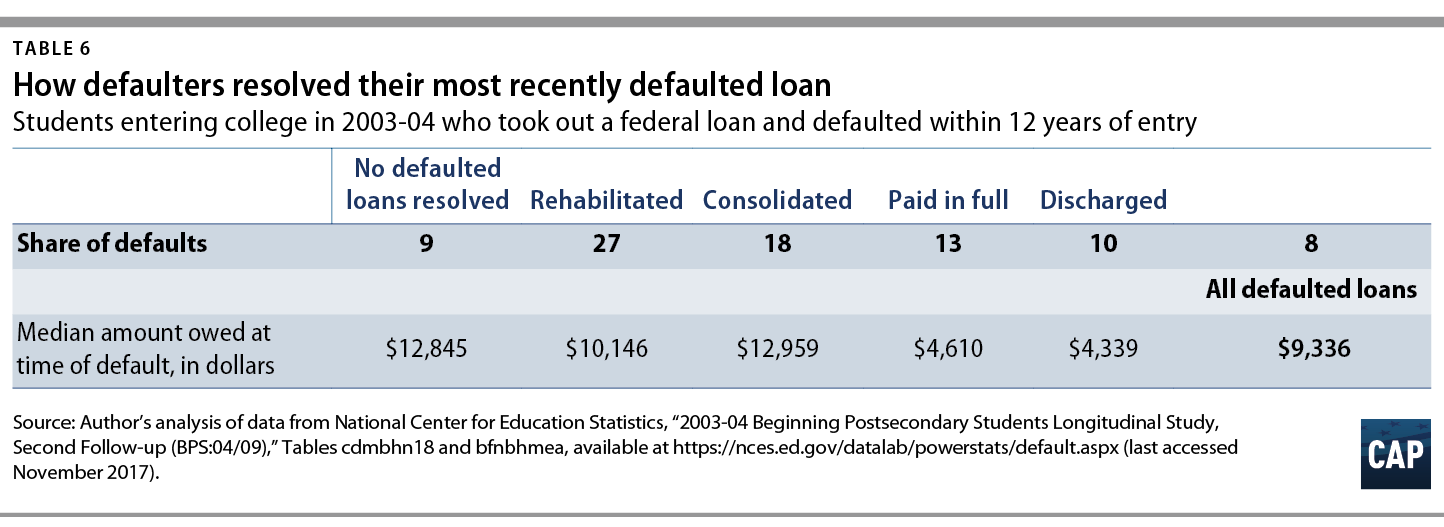
Policymakers must reconsider the path before and after default
These findings show that the federal government must study the path students take into and out of default more thoroughly and comprehensively. For instance, the long lag between entering repayment and default suggests that, in some cases, deferment or forbearances may not help with long-term payment success but rather delay bad outcomes. If that is the case, policymakers must consider other interventions for delinquent and at-risk borrowers.
Similarly, policymakers must take a closer look at the effectiveness of options to get students out of default. This should start with understanding how defaulters pay off their loans. For instance, are they doing so due to the seizure of a tax refund? Are they burning through an emergency savings cushion, putting themselves at greater risk should other financial challenges arise? This has implications for considering whether a bigger push for getting students back on a regular, affordable payment schedule may be better for them. Finally, policymakers should also look at how successful rehabilitation is at preventing redefault, compared with consolidation.
Policymakers should also consider how the options to get out of default are presented to borrowers. Are student loan collection agencies effective at guiding borrowers to their best path out of default? Do the incentives for collection agencies best align with borrower success, or would those functions be better handled by loan servicers?
Conclusion
Understanding who defaults and why matters not just because of the severe consequences borrowers face when they end up in this situation, but for equity reasons as well. As the Center for American Progress found in mid-October, one-half of black or African American borrowers from the 2003-04 entering cohort defaulted on a federal loan within 12 years of starting college. Among dropouts, the rate of defaults is even higher.38
The pain that radiates out from defaults in local communities could discourage future students from ever attending college. Young people who watch parents or peers losing much-needed tax refunds from student debt or hearing that college was not for them may become skeptical of the benefits of pursing postsecondary education.
The Education Department alone cannot fix the default crisis. The quality of education offered by schools; the share of students that finish credentials; and the amount of debt they take on are also important. But that does not absolve the federal government from ensuring that federal aid programs, especially options for defaulted borrowers, serve in the interest of helping students find success in repayment.
Ben Miller is the senior director for Postsecondary Education at the Center for American Progress.