Thousands of borrowers from the long-defunct Corinthian Colleges and ITT Technical Institute have been waiting years for the Trump administration to inform them how much of their loans will be forgiven in the wake of rampant fraud committed by those two chains. Last week, U.S. Secretary of Education Betsy DeVos unveiled her answer: Borrowers will receive relief based on a deeply flawed formula that uses unrepresentative data to employ the wrong statistical tool in an incorrect manner. The formula makes it mathematically impossible for borrowers from one-third of programs to have any shot at full forgiveness, and more than 80 percent of programs will be denied three-quarter forgiveness if their graduates earn more than the minimum wage.
This formula is a misapplication of math that will be used to deny thousands of dollars in help to borrowers. It is yet another attempt by DeVos to undermine prior work by the Obama administration aimed at providing relief for borrowers.
Here are a few of the many ways that the Education Department’s new formula gets it wrong.
1. The new formula rests on unrepresentative data
The basic premise of DeVos’ formula is that relief for ripped-off students should be based on how the earnings of graduates from the program they attended compare with those of graduates from similar programs at other colleges. For example, if a borrower sought a certificate in accounting, the department would look at the earnings of all other certificates in accounting programs. The closer a program’s earnings are to those of all comparison programs, the less relief would be granted to individuals in that program.
It’s questionable whether judging relief solely by comparing earnings is a good idea to begin with. It has the potential to neglect factors such as students working before and during enrollment. But even if the agency wanted to make such a comparison, the data used are a particularly poor fit for the calculations. For one, they only look at the earnings of graduates—a particularly bad methodological choice given that dropout rates at Corinthian Colleges and ITT Tech exceeded 50 percent for certain types of credentials. This means that the new formula could make decisions about relief for noncompleters without any consideration of their circumstances.
Students who graduated and are seeking relief may not be included in the data either. Much of the information used by the Education Department for its initial determinations is based on earnings data from 2014. Yet most of Corinthian Colleges shut down in 2015, and ITT Tech closed in 2016; some fraud findings date all the way back to 2010.
Deciding relief for individual borrowers based on group results is a hypocritical stance for an administration that has refused to use any group process for judging whether a college acted improperly in the first place. Finally, group medians can mask wide ranges of earnings, hurting borrowers who aren’t close to that value.
2. The new formula deploys the wrong statistical test
After selecting unrepresentative data to draw comparisons, the Education Department then deploys a statistical test that is not appropriate for judging differences between two sets of program medians. This test merely looks at programs’ earnings in terms of how many standard deviations they fall below the median earnings of similar programs. Borrowers from programs that fall two or more standard deviations below the comparison median get full relief; borrowers from programs that are more than 1.33 standard deviations below get 75 percent relief; and those from programs that are 0.67 standard deviations below get 25 percent relief. All borrowers from Corinthian programs get at least 10 percent relief, even if those programs are above the median comparison figure. Meanwhile, borrowers from ITT Tech programs that are above the comparison median get nothing.
This math comes from a common concept in statistics when data follow a “normal distribution,” which looks like a bell curve. For such data, one would take the mean and subtract two standard deviations in order to represent the programs in the lowest 2.5 percent of all those with earnings. Yet the Education Department is doing its math using medians instead of means, which might cut off relief at lower levels of earnings since median earnings are likely lower than the mean.
The Education Department has justified the two-standard deviation threshold by saying that “it is at this point where differences between data points is considered to be statistically significant.” This is wrong. This standard deviation approach is not a test of statistical significance; it simply notes if a program’s earnings appear to be much lower than others. Attempting to judge if there was a statistically significant difference between the typical earnings of a program and a comparison group would require using a separate statistical concept such as a t-test, which requires other data points—for example, the number of borrowers for the program and the comparison groups, as well as the variance of both. Even then, the Education Department is overstating the value of statistical significance, since it can only determine whether the difference between the two medians is not random. The gaps could still be small or large.
3. The test is applied incorrectly
The Education Department not only uses the wrong statistical test but also applies it incorrectly. Standard deviation math only captures the bottom 2.5 percent of a distribution if the data in question follow that normal distribution. However, earnings do not, as they cannot go below zero, they have no upper limit, and the presence of the minimum wage effectively cuts off the lower bound of the distribution. This means that earnings look more like a ski slope with a long tail to the right—something that is going to produce a large enough standard deviation that if one were to subtract it from the mean they would get results that are impossible to fulfill.
That’s exactly what happens with the Education Department’s partial relief formula. In many cases, two standard deviations represents a larger number than the comparison median. Subtracting the standard deviations from that figure thus produces thresholds for full relief that require programs to have negative earnings—an outcome that is impossible to fulfill. For example, the department’s test finds that a diploma from Corinthian Colleges in business administration and management yields median comparison earnings of $18,104, while two standard deviations comes out to $20,654. This means that the threshold for full relief is minus $2,550. A misled borrower would only be eligible for full relief if a group of graduates met the impossible bar of earning negative incomes.
Sadly, the negative earnings bar at this program is not an outlier. One-third of programs have a negative earnings threshold for full forgiveness, including nearly 40 percent of Corinthian programs. (see Table 1)
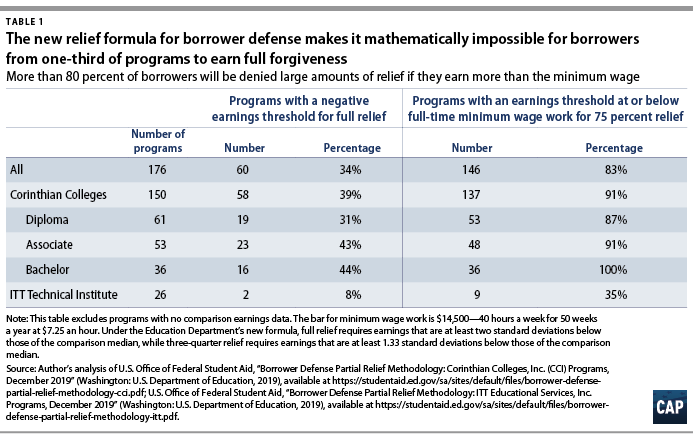
Making matters worse, the formula fails to consider the fact that the median comparison earnings for many programs are close to the minimum wage. As a result, the vast majority of borrowers from these programs lose large chunks of potential relief just for having incomes above the lowest allowable level in this country. That business diploma from Corinthian Colleges, for example, has median earnings of $11,669—about 30 hours a week at the minimum wage. Yet due to the low comparison earnings, claimants from this program would only get 25 percent of their loans forgiven. Under the department’s logic, these borrowers are too successful even though they appear to be earning the least amount possible for full-time work.
Many borrowers will lose out on relief due to this lack of consideration for the minimum wage. More than 80 percent of the programs have a threshold for three-quarter forgiveness at or below the annual earnings of someone working full time at the minimum wage for 50 weeks—which results in a yearly income of just $14,500. This includes more than 90 percent of Corinthian programs and every bachelor’s degree for that chain.
Conclusion
The combination of unrepresentative data, flawed concepts, and an incorrect methodology creates a formula that caps relief at 50 percent for the vast majority of programs—even if borrowers from those programs earn subsistence wages. This formula is not “scientifically robust,” as DeVos claimed last week before the House Committee on Education and Labor; it’s shamefully innumerate and an embarrassing product for any agency, especially one that is supposed to fund teaching and learning.
Even the most basic level of due diligence would have caught these flaws, but the agency still refuses to fix them. When asked by Rep. Lori Trahan (D-MA), DeVos denied that she’s requiring borrowers from programs to earn negative incomes for full relief; however, the Department of Education later tweaked its spreadsheets to make the math not as obviously produce the negative results—which, in turn, introduced a more basic subtraction error that also had to be fixed.
Enough is enough. Betsy DeVos’ previous attempt to write a partial relief formula got thrown out in court for violating the Privacy Act. This one couldn’t pass high school statistics. It is time to stop the games and give defrauded borrowers the relief they deserve.
Ben Miller is the vice president for Postsecondary Education at the Center for American Progress.