Racial diversity benefits every workforce,17 and teaching is no exception. Teachers of color tend to provide more culturally relevant teaching and better understand the situations that students of color may face. These factors help develop trusting teacher-student relationships.18 Minority teachers can also serve as cultural ambassadors who help students feel more welcome at school or as role models for the potential of students of color.19 These children now make up more than half of the U.S. student population in public elementary and secondary schools.20
Teachers of color tend to have more positive perceptions of students of color—both academically and behaviorally—than other teachers do. A recent study found that African American teachers are less likely than white teachers to perceive African American students’ behavior as disruptive.21 Likewise, when a black student has both a nonblack teacher and a black teacher, the black teacher tends to have a much higher estimation of the student’s academic abilities than the nonblack teacher.22 In both of these studies, the reverse did not hold true: Perceptions of white students’ behavior and academic ability were similar regardless of their teacher’s race.
The lack of diversity in the teaching profession, combined with these differing interpretations of student ability and behavior, may partially explain why students of color are suspended or expelled from all levels of school at disproportionate rates.23 Such harsh discipline practices place them at higher risk of subsequent academic disengagement and increase the probability that they will later drop out.24 While these mindsets may be unintentional, their prevalence greatly affects students’ performance and behavior. Known in education research literature as the “Pygmalion effect,” a teacher’s higher or lower expectations of a student are significantly predictive of the student’s future academic outcomes.25
These findings may partially explain why there is a significant positive effect on the standardized test scores of students of color when they are taught by teachers of color. When Florida researchers analyzed a massive data set of about 3 million students and 92,000 teachers over seven years, they found a positive effect in both reading and math scores when black students were taught by black teachers. For students who performed at the lowest levels, the effect of having a teacher of the same race was even larger.26
North Carolina researchers analyzing another large data set found similar results in 2007.27 More recently, in a study published by the Institute of Labor Economics, researchers and university economists found that low-income black male students in North Carolina who have just one black teacher in third, fourth, or fifth grade are less likely to drop out of high school and more likely to consider attending college. In fact, the study estimates that instruction from one black teacher in elementary school cuts high school dropout rates by 39 percent among black boys from low-income backgrounds. These same students were 29 percent more likely to express a desire to pursue a four-year college degree than their peers who had never been taught by a black teacher.28
Increasing the percentage of teachers of color in the workforce is not just important and beneficial for students of color. Students of all racial backgrounds can benefit from a diverse teacher workforce that represents the nation’s overall demographics. Because the vast majority of American social networks are made up exclusively—or nearly exclusively—of people of the same race or ethnic background,29 many children and adults miss out on the opportunity to interact with people of other races. This segregation exists in the teaching profession as well: In 40 percent of U.S. schools, there are no teachers of color on staff.30 As a result, white students—and teachers—in these schools may miss opportunities to question assumptions about race, class, and privilege that they might encounter in their communities and to break down stereotypes about people of color.31 Certainly, it is not the responsibility of teachers of color to facilitate conversations about race and disprove assumptions, but greater diversity within the teaching profession supports the overall effort.32
A major 2009 meta-analysis exploring the efficacy of interventions designed to reduce racial bias found the greatest support for interventions that involve significant “cross-race contact and cooperation.”33 Other studies suggest that building a relationship with someone of a different race who counterbalances prevailing stereotypes is particularly effective in neutralizing unconscious bias; these studies also suggest that such positive effects occur most powerfully in young people.34
For all the reasons outlined above, increasing teacher diversity is an important aspect of improving educational equity for all students—especially for students of color. Another important aspect of a quality education is ensuring that teachers have the knowledge and skills to provide excellent instruction, which can be accomplished in part by more carefully selecting who becomes a teacher and how that person achieves that role.
A high bar for entry is a crucial component of a modernized teaching profession
Nations with high-performing education systems carefully choose who is allowed to become a teacher. In Singapore, for example, 100 percent of new teachers are selected from the top academic third of their class.35 Finland uses a multiround selection process that includes both academic- and competency-based components and admits only the top 10 percent of applicants.36 After a concerted effort to increase the selectivity of its teaching profession, Canada now consistently recruits a majority of its prospective teachers from the top 30 percent of their college classes.37
These countries have responded to a growing body of evidence demonstrating the importance of great teaching for students, particularly those from disadvantaged backgrounds. While high-performing teachers in the United States—the top 25 percent currently in classrooms—help students achieve an average of 1.5 years’ of academic growth, students with less-skilled teachers achieve only a half year’s worth of academic progress on average. Put simply, this means that the best teachers close achievement gaps, while the worst teachers widen them.38 And these results are not just a matter of which teachers receive the less challenging teaching assignments: A major, multiyear study from the Bill & Melinda Gates Foundation showed that high-performing teachers remained so across schools, regardless of whether those schools were high- or low-poverty.39
In the United States, students who are fortunate enough to have a great teacher for even one year are more likely to matriculate to college, attend more prestigious colleges, and earn more later in life.40 Unfortunately, though they stand to benefit most from great teaching,41 disadvantaged students are more likely to be taught by inexperienced or ineffective teachers than nondisadvantaged students.42 As a result, they far too often miss out on these benefits.
Raising the bar for entry into the teaching profession is one potential way to ensure that more teachers are able to accelerate students’ learning. While there is not a clear causal effect between a teacher’s own academic record and his or her ability to achieve the kinds of learning gains that help students excel, most studies do find a correlation between higher GPA and teacher effectiveness.43 Taken in aggregate with other factors, such as experience and rank of undergraduate school, some studies have found larger positive impacts, especially for math achievement.44 For this reason, a high GPA should not be the only factor that determines entry into the profession. As later sections of this report discuss, a number of other measures that could better predict future teaching ability are currently in development.
The high bar for entry into teaching in high-performing countries coupled with highly professional treatment of in-service teachers—such as quality training, professional development, leadership and advancement opportunities, and adequate pay—sends a signal to prospective teachers and to parents, students, and society at large that teachers are smart, deserve respect, and should be granted the same trust and autonomy as those in other professions that attract high-achieving individuals. Unfortunately, the United States has a leaky pipeline for high-achieving students. Students at top-tier colleges are less likely than their peers at other colleges to go into education; high-achieving college graduates are less likely to go into teaching; and those who do become teachers are less likely to stay in the profession long term.45 In recent polling, high-achieving Millennials revealed much of the thinking that goes into this drop-off: They reported that they do not believe teaching is a good career option for high-achieving students, and they feel that the status of the teaching profession is in decline.46
These trends have led researchers,47 journalists,48 multinational consulting companies,49 and teachers unions50 alike to call for changes to raise the bar for entry into the teaching profession.
Recent attempts to raise standards for entry into the teaching profession
- American Federation of Teachers (AFT): The AFT released a report in 2012 titled “Raising the Bar: Aligning and Elevating Teacher Preparation and the Teaching Profession,” in which they called for a bar exam-like test for licensure. Specifically, the report calls for a universal process for entry into the profession that includes an assessment of subject and pedagogical knowledge as well as a performance component. 51
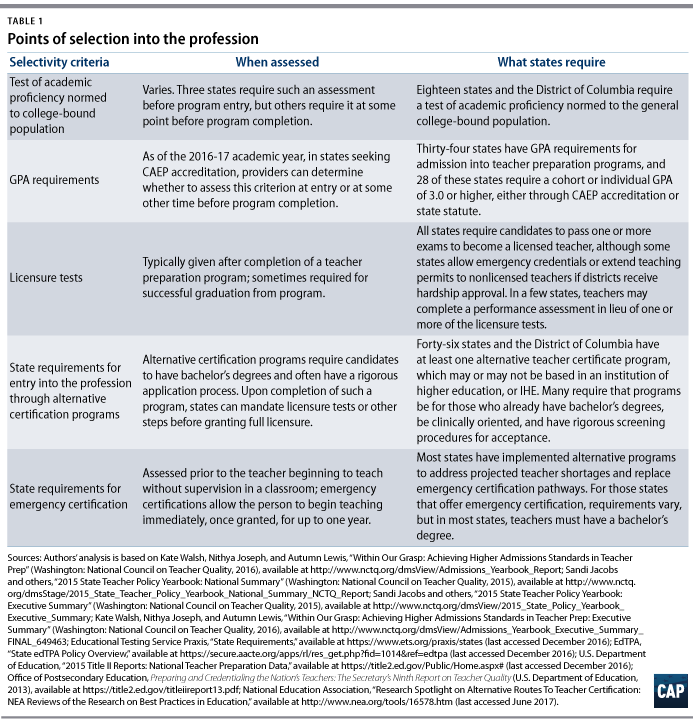
- Council for the Accreditation of Educator Preparation (CAEP): For programs to meet CAEP accreditation requirements, the teacher preparation candidate cohort must meet or exceed a minimum 3.0 GPA. The cohort must also demonstrate an average group performance in the top 50 percent of ACT, SAT, or GRE scores. As of the 2016-17 academic year, the teacher preparation program determines whether these criteria are measured at admission or at some other time before program completion.52
- Council of Chief State School Officers (CCSSO): The CCSSO’s Network for Transforming Educator Preparation calls for states to reach a consensus on greater selectivity standards for licensure, including performance assessments that include multiple measures of educators’ ability to perform.53
- S. Department of Education: Under proposed regulations issued by the Education Department during the Obama administration, compliance with a set of outcomes-based requirements aligned to CAEP accreditation standards would have been part of the eligibility conditions for preparation programs that wish to provide students with federal Teacher Education Assistance for College and Higher Education (TEACH) grants. These grants provide up to $4,000 per year to students in low-income schools who are preparing to enter the teaching workforce.54 In March 2017, President Donald Trump signed a bill overturning these regulations through the Congressional Review Act.55
- National Council on Teacher Quality (NCTQ):* Since 2009, NCTQ has provided an analysis of each state’s teacher preparation and licensing policies and assigned a corresponding grade to each state based on that analysis. To receive a passing grade in its rankings of teacher preparation programs, programs must require teacher candidates to demonstrate that they are in the top 50 percent of their college-bound class—in the top 50 percent of SAT or ACT scores or with at least a 3.0 GPA—for entry.56
As a result of these calls for improvement, many states and preparation programs have begun to make significant changes. In 2011, only two states had set a high academic bar—either through GPA requirements or through an assessment—for admission into teacher preparation programs. By 2015, however, 25 states had done so.57 These changes came in many forms, as there are many measures of selectivity in the teaching profession. Table 1 captures selectivity requirements for admission into teacher preparation programs and entry into the profession.
As states begin to make changes to various entry points into the teaching profession, some experts in the education policy community worry that these changes may have the unintended consequence of reducing the profession’s diversity. The academic foundation that prepares future teachers is cumulative. Unfortunately, this means that racial disparities in academic opportunities in elementary and secondary schools, high school graduation rates, and scores on entrance exams for postsecondary programs affect not only diversity in postsecondary programs but also diversity in the teaching pipeline.58
The Center for American Progress (CAP) has previously called for more selectivity in the teaching profession and increased diversity of the teacher workforce.59 Therefore, when some in the education policy community raised these concerns, CAP decided to take a look at the data. But first, this report acknowledges and responds to some of the challenges that exist when working toward these equally important goals.
As mentioned previously, some states have made significant efforts in recent years to increase the selectivity of the teaching profession by raising the bar for entry. Although there has been some recent backsliding, between 2011 and 2015, 25 states raised the bar for selectivity through entrance examinations, GPA requirements, or both.85 This section looks at the states that implemented increased selectivity requirements before 2012; at how nearly all states have made some recent strides to increase the selectivity of their teacher preparation programs; and at two states that have successfully set a high bar for selectivity while maintaining or increasing diversity.
Changes to entrance exams for teacher preparation programs did not affect the diversity of education majors
Nine states—Alabama, Georgia, Hawaii, Indiana, Iowa, Kentucky, Oregon, Rhode Island, and Texas—have increased the selectivity of their examinations for entry into teacher preparation programs between 2006 and 2014. In order to analyze the impact of changes to selectivity requirements, states must have made changes to entrance examinations before 2012 for these data to be available. In these states, we analyzed whether the percentage of students of color pursuing a degree in education declined after the state increased selectivity.
Busting the myth that diversity and selectivity in the teaching profession are at odds, these data show that in most states, the diversity of undergraduate education majors actually grew following the increases in selectivity. (see Table 4) These changes tracked closely with the increasing diversity of these states’ overall undergraduate student bodies; in some cases, the growth in diversity among education majors exceeded the rate of growth in the student body overall.
Alabama was the only state in this analysis that saw a decrease in the percentage of students of color among education majors. However, the decrease was very small—1 percent—and the growth in students of color in the overall student body was only 2 percent. In all other states that increased the selectivity of entry into teacher preparation programs, the percentage of students of color increased among education majors as well as among the entire student body in the years examined. In Kentucky, for example, the percentage of students of color among education majors and the overall student body both increased by 6 percent. Hawaii, Indiana, and Texas also saw increases in diversity among education majors and the overall student body.
Most notably, in Georgia, Iowa, Oregon, and Rhode Island, the increases in the percentage of students of color among education majors exceeded the increases in students of color in the overall student body. In Georgia, the percentage of students of color among education majors grew 14 percent between 2006 and 2014, while the increase in students of color in the overall student body amounted to 10 percent. Similarly, in Oregon, the percentage of students of color among education majors grew 8 percent, while the change in students of color in the overall student body increased by 5 percent. Rhode Island also followed this trend, with an increase in education majors of 5 percent among students of color and an overall increase of 4 percent. In Iowa, while the diversity of the overall student body decreased by 2 percent, the percentage of students of color majoring in education increased by 15 percent.
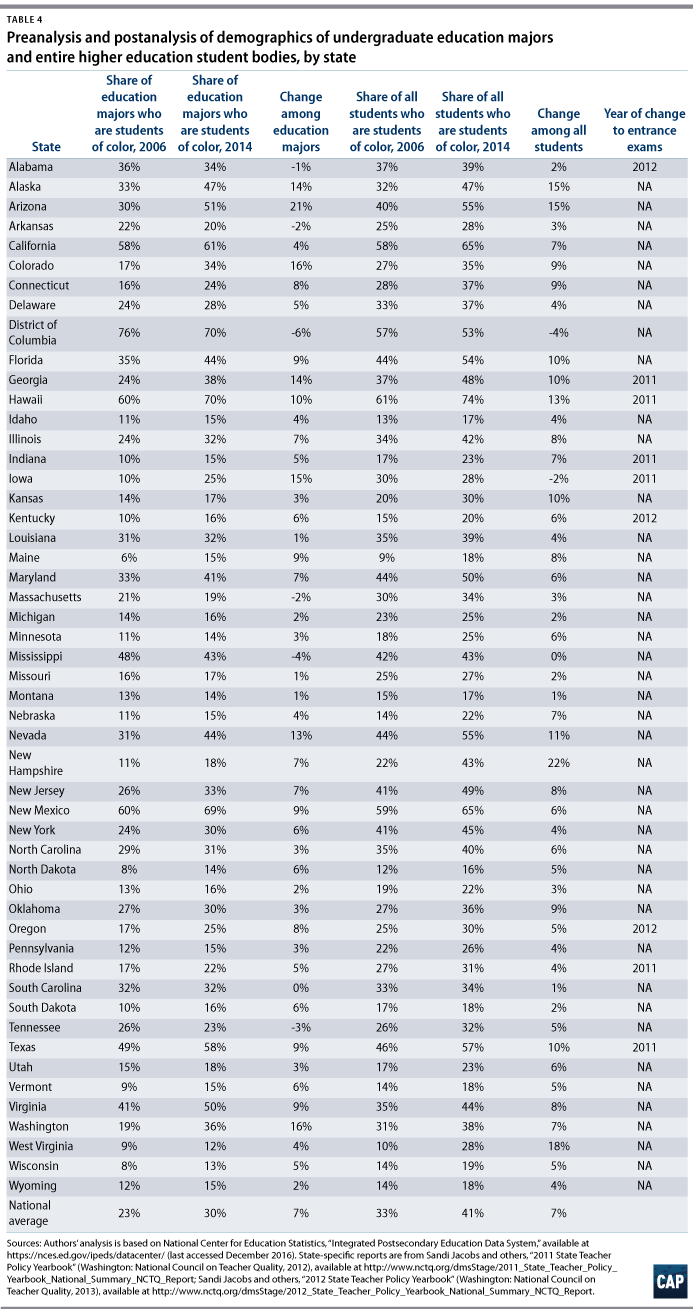
What’s more, in the remaining 41 states and Washington, D.C.—which did not increase their selectivity standards during the time period analyzed—five states—Arkansas, Washington, D.C., Massachusetts, Mississippi, and Tennessee—saw an overall decrease in the percentage of students of color among education majors, and 24 states saw less of an increase in the percentage of students of color among education majors than in their student bodies overall. In sum, these data belie the notion that increasing selectivity has a negative impact on diversity, instead suggesting that increasing selectivity may even encourage students of color to enter the field of education.
Selective GPA requirements are new, thus the effect on diversity remains to be determined
In addition to changes in entrance examinations for teacher preparation programs, many states have opted to implement a high school GPA requirement for students entering teacher preparation programs. While states such as Louisiana were making such changes as early as 1999,86 changes are ongoing. Higher GPA requirements took effect this past year in New Jersey,87 and such changes will take effect in Alabama in fall 2017.88 For this reason, it is not yet known how or whether these changes will affect the diversity of students enrolling in and graduating from teacher preparation programs. Nevertheless, it is illuminating to understand just how much the selectivity landscape has changed in recent years. Table 5 illustrates these changes.
CAEP and GPA requirements
Some states that have adopted a 3.0 cohort GPA standard have done so by requiring teacher preparation programs to be accredited by the Council for the Accreditation of Educator Preparation (CAEP).89 CAEP accreditation requires a teacher preparation program to ensure that:
- The average GPA of its accepted cohort of candidates meets or exceeds the CAEP minimum of 3.0.
- The group average performance on nationally normed ability achievement assessments—such as ACT, SAT, or GRE—is in the top 50 percent.90
Currently, 22 states require their public colleges and university educator preparation programs to have CAEP accreditation.91 An additional eight states have a 3.0 GPA requirement—either cohort or individual—even though they do not require all teacher preparation programs in their state to be CAEP-certified.
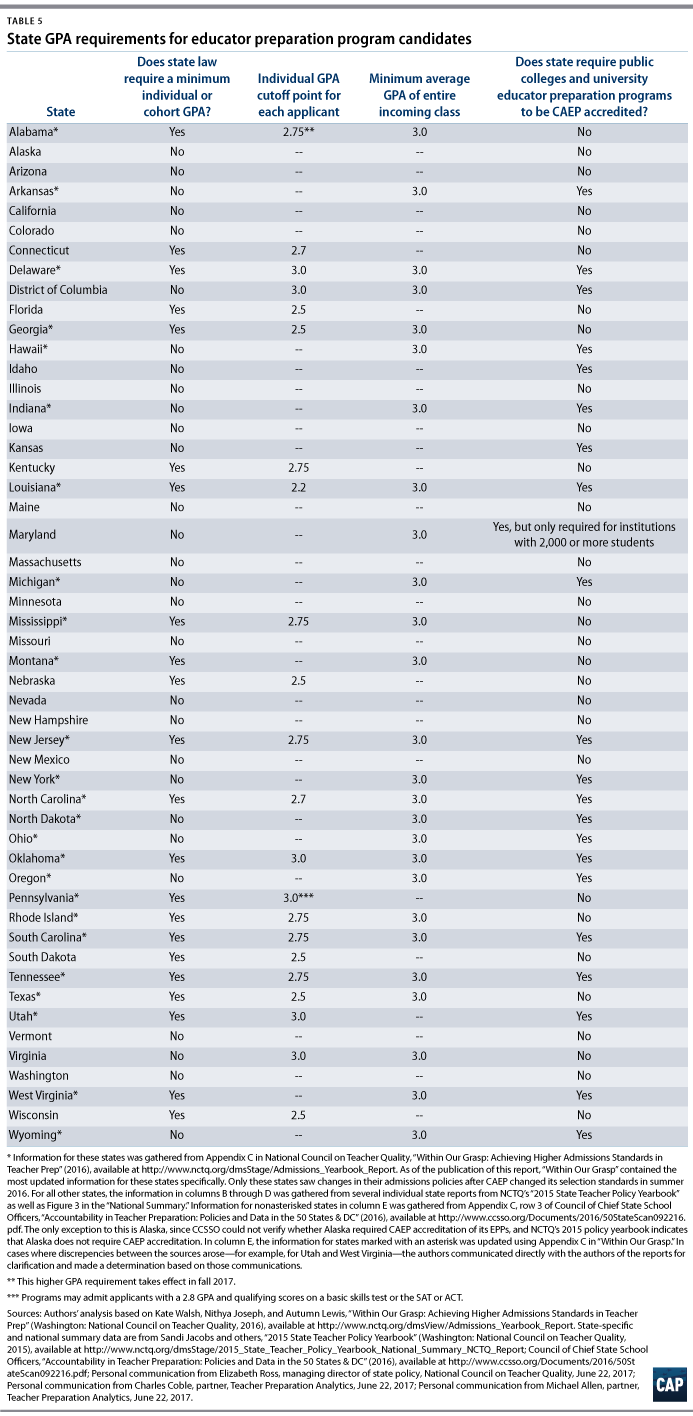
Changes to GPA requirements have been ongoing for a number of years, but increasing the standard enough to ensure a more meaningful bar for entry is a relatively new phenomenon. In 2013, Delaware was the first state in the nation to institute a 3.0 GPA requirement,92 although many states have since followed suit. CAEP has only existed as an organization since 2013, and it wasn’t until 2016 that its accreditation standards were fully implemented, so many of these states are just now phasing in their new GPA requirements.93 What’s more, in summer 2016, CAEP agreed to allow programs to determine for themselves when to verify their students’ academic abilities—either at entry or at some other point before program completion.94 With this change, the number of states requiring a 3.0 GPA at entry into teacher preparation programs declined from 25 states to the 11 states that have written their entry requirements into law.95
Despite these recent changes in CAEP’s accreditation standards, however, many programs have maintained their rigorous entry requirements. In a recent study of 221 undergraduate elementary programs, for example, NCTQ found that the majority of programs exceeded their states’ GPA and testing requirements under CAEP’s former standards. Even in those states that require CAEP accreditation but no longer require students to demonstrate their academic ability at entry, more than half the programs maintained the original CAEP requirements.96
Because of the recent nature of these changes, more years of data are needed to do the type of analysis the authors completed for changes in entrance exam requirements, even for states that enacted these changes first. Although much of this work is still in its earliest phases, a few states have done an exemplary job of thinking through interactions between selectivity and diversity and making a concerted effort to ensure that they are achieving both. The efforts in Rhode Island and New York are profiled below, showing that it is possible to create effective policies with an eye toward these dual goals.
Rhode Island
Prior to 2013, most Rhode Island teacher preparation programs required a minimum 2.5 GPA for admission, which did not even denote an academic rank within the top 50 percent of the incoming college-bound class. 97 And while diversity was encouraged, the percentage of diverse teaching candidates lagged far behind the percentage of diverse students in Rhode Island classrooms, just as in most other states.98 With support from the governor and the state’s board of education, the Rhode Island Department of Education (RIDE) began an extensive information-gathering process in 2011 that culminated in new standards for educator preparation. These standards were groundbreaking in their regard for both greater academic selectivity and increased teacher diversity.99
The standards, which are closely aligned with the state’s K-12 education and equity strategic plans, identify five components of educator preparation programs required for continued state approval. The standard 3, “Candidate Quality, Recruitment, and Assessment,” is described as follows:
Approved programs demonstrate responsibility for the quality of candidates by ensuring that development of candidate quality is the goal of educator preparation in all phases of the program—from recruitment, at admission, through the progression of courses and clinical experiences—and in decisions that program completers are prepared to be effective educators and are recommended for certification.
Three of the six subcomponents of standard 3 as listed by RIDE relate to recruitment and admission:
- 3.1 Diversity of Candidates: Approved programs recruit, admit, and support high-quality candidates who reflect the diversity of Rhode Island’s PK-12 students.
- 3.3 Admission Standards for Academic Achievement and Ability: Approved programs set admissions requirements that meet or exceed RIDE expectations as set forth in documented guidance and gather data to monitor applicants and admitted candidates.
- 3.6 Additional Selectivity Criteria: Approved programs define, monitor, and assess, at entry and throughout the program, evidence of candidates’ professional dispositions, and other research-based traits, such as leadership abilities, resilience, and perseverance, that are critical to educator effectiveness.100
RIDE is the first state education agency to endorse a plan to hold teacher prep programs accountable for candidate diversity rates. According to Cameron Berube, a former RIDE education quality and certification specialist, “The value of teacher diversity has been stated time and again by our state leadership, in our statewide strategic plan documents, and by our teachers, parents, and students, so writing it into our standards was the logical next step.”101 In recognition that the state is blazing a new trail, however, RIDE has built in an extended data collection period to precede specification of targets. It will collect and publish diversity rates for each program and use the information to support conversations among teacher preparation program leaders, RIDE, and the public to formally hold programs accountable.102
Other new requirements for teacher preparation admissions standards, however, have already gone into effect. Rhode Island has joined several other states in requiring preparation programs to raise GPA and standardized test score requirements to align with CAEP’s recommendations. The admitted candidate cohort mean GPA must now meet or exceed 3.0, and the mean score of admissions assessments—ACT, SAT, or GRE—must meet an annual benchmark of the top 50 percent of the national distribution in the 2016-17 school year. The benchmark score will gradually increase, moving to the top 40 percent in 2018-19 and the top 33 percent by 2020.103
As for individual admissions into teacher preparation programs, each candidate must have a minimum 2.75 GPA as an undergraduate and a 3.0 for graduate degrees, with some flexibility for admitting candidates who do not meet all of the entrance requirements. Conditional acceptance policies and programs, however, must include supports for remediation and receive approval from RIDE.104 Rhode Island takes these requirements further than most states, joining only Delaware in articulating clear state policy that requires higher GPA and standardized test scores outright.105
RIDE has left programs more discretion to identify and adopt the additional selectivity criteria that indicate other “research-based traits … that are critical to educator effectiveness.”106 Each school will select, implement, and justify its own additional measures. RIDE notes that it will continue to use quarterly meetings with program deans and directors to unpack and understand the new expectations and to identify next steps.
Berube credits consistent and transparent communications; ample opportunities for community input; and a spirit of collaboration and partnership among RIDE, local education agencies, and teacher preparation programs with bringing this package of new higher standards from design to reality. In conversations with major stakeholders around contentious topics, state leaders demonstrated a willingness to recalibrate based on stakeholder critiques. In its decision to raise the statewide GPA threshold, for example, RIDE was aware of the research showing that the relationship between GPA and teacher effectiveness is small. Therefore, it responded by building limited flexibility into the system by requiring the 3.0 GPA requirement at the cohort, rather than the individual, level.107
Future challenges include ensuring that the state maintains the necessary capacity for the regular feedback and support that education quality and feedback specialists provide preparation program leaders with, especially as additional programs enter the state. The aspiration to do so reflects RIDE’s strong conviction that meaningful accountability and support for preparation partners is the most effective means of meeting pre-K through 12th grade schools’ teacher pipeline demands.108
New York
As concerns grew in the 1980s and 1990s in New York state that the average academic ability of teachers was in decline—a nationwide phenomenon that policy experts attributed in part to expanding career opportunities for women, who make up the vast majority of the teaching profession—the state set about finding ways to reverse this trend.109
Beginning in 1998, the state made a series of changes to its regulation of teacher preparation programs, emergency certificates, and alternative certification. A timeline summarizing the state’s policy changes is below:
- 1998: Coursework requirements and accreditation for teacher preparation programs changed. The New York State Education Department Board of Regents enacted new requirements for teachers to take a broad core of courses across the liberal arts and sciences, in addition to having a pedagogical core, a major or equivalent in the certification subject area, and 100 hours of clinical experiences.110
- 2000: Regents approved the first alternative teacher certification program. The state began to allow alternative preparation programs for individuals who already possessed a bachelor’s degree with at least 30 credits in the subject in which they sought certification. The first such program was approved in July 2000; as of 2010, there were 24 alternative certification programs in the state, with the majority of them primarily operating in the New York City region.111
- 2001: All teacher education programs were reviewed and reregistered. This review was conducted in 110 institutions and 3,493 programs across the state. After the review, about one-third of the programs were required to make additional changes in order to continue operating. After being given the chance to improve, 3 percent of programs were denied reregistration.112
- 2003: Temporary teaching licenses were mostly eliminated. The regents’ goal was to ensure that by 2009, all beginning teachers in the state would have completed a state-approved teacher preparation program or a comparable program in another state. To reach this goal, the state eliminated something called individual evaluation—a certification pathway essentially in the form of a transcript review that was commonly taken by teachers in hard-to-staff subjects who would not have otherwise met the certification criteria—as well as other emergency certification pathways and temporary licenses.113
- 2004: First- and second-stage licenses were given new requirements. To earn the first-stage initial certificate, applicants had to pass three certification exams, including one in their content area. To continue teaching and to earn a second-stage license, teachers had to be mentored by an experienced teacher in their first year and earn a master’s degree within five years. In addition, the second-stage license was changed from a lifetime license to one that teachers had to renew every five years by completing 175 professional development hours.114
- 2006: All preparation programs were required to be accredited. To continue to be granted state approval, programs were required to demonstrate that at least 80 percent of their graduates passed at least one of the state’s certification exams. Further, programs had to receive accreditation by CAEP or the regents no later than the end of 2006.115
These policy changes resulted in remarkable changes to the selectivity of the teaching profession in New York. After more than a decade of decline, the academic ability of teachers in the state increased progressively beginning in 1999, with more teachers being drawn from the top third of the SAT distribution. These improvements held true across subjects, grade levels, and regions. The improvements in the qualifications and academic ability of teachers were most evident in high-poverty schools, which previously had a disproportionate share of teachers with emergency certificates or temporary licenses. These teachers typically had lower SAT scores and undergraduate college selectivity than certified teachers. As a result of these improvements, the difference in teachers’ prior academic performance in high- and low-poverty schools in the state narrowed. After the state made these changes, low-income students were more likely to be taught by teachers whose academic abilities matched those of teachers in more affluent schools.116
During the time period examined—1999–2005—the selectivity of the colleges that future teachers attended also increased. In fact, the academic ability of all entering teachers increased considerably across the board. For example, the percentage of entering teachers from the top third of the SAT distribution increased by 5.7 percentage points at the most competitive institutions—from 65.1 to 70.8. It also increased by 8.1 percentage points at the least competitive institutions—from 11.7 to 19.8. The end result of these changes was a 13 percent increase in the share of students from the top third of the SAT distribution; by 2010, this meant that 40 percent of teachers in New York state came from the top third of their class based on SAT scores, compared with less than 30 percent in 1999. These improvements in teachers’ academic ability were even greater in hard-to staff subjects and in New York City, which relied most heavily on emergency certificates prior to these policy changes.117
As New York state increased selectivity requirements, it also increased the diversity of its teacher workforce. From 1999 to 2010, the percentage of teachers in the state who were not white or Asian grew by 50 percent, increasing from 16 percent to 24 percent.118 In addition, the average SAT score of nonwhite, non-Asian teachers in the state increased significantly more than the SAT scores of white and Asian teachers.119
Although New York state did not specifically set out to increase the diversity of its teacher workforce when making these changes, it was able to accomplish this goal while significantly increasing the selectivity of the profession.
Yet it is important to include a closing word of caution about New York. The basic skills tests required for entry into teacher preparation in the state—only a small part of the selectivity measures described above—have recently come under fire for being biased against African American and Latino test takers, as their passage rates are significantly lower than those of white test takers. This is also the case with other tests given for entry into teacher preparation programs. See Table 2 for similar data related to the Praxis I.
There have now been a few successful lawsuits brought to challenge various versions of these tests, with rulings centering on tenuous connections between the skills being tested and those necessary to do the job.120 To address some of these underlying concerns, the TeachNY Advisory Council, supported by a grant from the New York State Department of Education, drafted policy recommendations in May 2016 around teacher preparation recruitment, selection, and cultural competence in the hopes of finding ways to improve teacher quality and diversity.121
Programs that have done an exemplary job of significantly increasing diversity while maintaining a high bar for selectivity
While several states have been successful at increasing the selectivity of their teacher preparation programs through statewide policies, these programs also have considerable leeway to make their own entrance requirements more selective. States have the ability to increase selectivity while maintaining or modestly increasing diversity, but programs have the ability to use recruitment to both increase the pool of qualified candidates and take a more individualized and personalized approach. Together, these tools can have a dramatic effect. This is important because marginal increases in teachers of color will not be enough to ensure that the teacher workforce more closely reflects the diversity of the nation’s students.
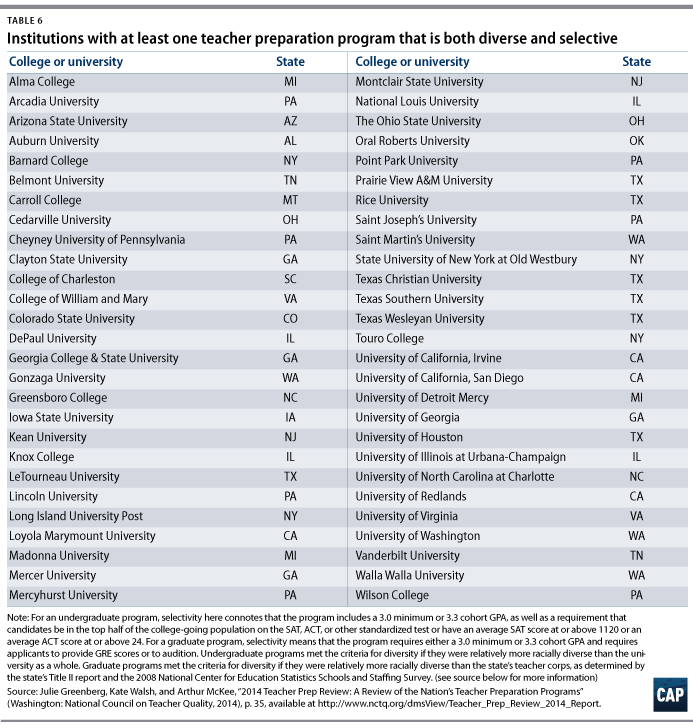
The table below shows 54 teacher preparation institutions from states across the country that house programs in which the student body is diverse and selected for their high GPAs or for being at the top of the class for college-bound high school students. While these institutions may not be highly selective overall, the teacher preparation programs housed within them have taken it upon themselves to maintain a high bar for program entry.
The next subsections talk in-depth about three programs that have increased diversity while also increasing the rigor of their selection processes: Loyola Marymount University’s (LMU) School of Education, Teach For America (TFA), and the Boston Teacher Residency (BTR). The first program highlighted is taken directly from Table 6 and has received accolades from a number of organizations for its selectivity and commitment to diversity, not just in its student body but also in the coursework it provides to prospective teachers and in its community partnerships.
Loyola Marymount University’s School of Education
LMU has been recognized by the American Association of Colleges of Teacher Education (AACTE) and NCTQ for designing programs that are both selective and diverse. Located in Los Angeles, LMU offers credential, certificate, master’s, and doctoral programs to aspiring teachers.122 According to NCTQ’s report, LMU “[d]raws in candidates who are not only capable but will also add to the diversity of the schools where they will teach.”123
LMU ensures that its students meet rigorous selection requirements. In 2013, the average minimum GPA entrance requirement nationwide for a bachelor’s degree in education was 2.6.124 The average GPA of students admitted to LMU in 2015 was 3.3, higher than the 3.24 average GPA of students admitted to undergraduate teacher preparation programs across the country.125 In the master’s degree program, the admission rate was 32 percent;126 by contrast, two-thirds of all teacher preparation programs nationwide—both undergraduate and graduate—accept more than half of their applicants.127
LMU selects teacher candidates through a holistic set of criteria, including GPA, disposition for the classroom, commitment to serving diverse communities, and a rigorous subject matter exam—the California Subject Examinations for Teachers.128 Once admitted, LMU uses curricula and assessments designed to prepare teachers for diverse student populations of their own. Of the 25 total proficiencies or competencies that the LMU School of Education uses to assess all candidates, 40 percent are diversity-specific, including some that focus on English language and special needs learners.129 LMU believes that this focus on diversity in its coursework helps the university attract more diverse teacher candidates. According to LMU’s School of Education and Graduate Studies Dean Shane P. Martin, “It’s about relationship building, engagement, fit—when students see themselves in the curricula and the relationships they have with their professors, they want to be there.”130
In 2016, LMU’s School of Education received AACTE’s Best Practice Award in Support of Multicultural Education and Diversity.131 According to AACTE, all of the teacher preparation programs at LMU are “grounded in principles such as the promotion of social justice, cultural responsiveness, inclusion, value and respect for all individuals, and leadership that is moral, intellectual, responsible, and caring.”132 AACTE recognized LMU for prioritizing diversity in its curriculum, as well as admitting culturally and linguistically diverse teacher candidates.133
The school employs sociocultural and constructivist theories to train its teacher candidates to recognize and capitalize on the diverse communities in which teacher candidates live and teach. “The pathway of instruction might look a little different in one community than another,” Martin said. “You look at all of the things children bring to school, from their traditions, home communities, and look at them as assets—and good teachers learn how to build on that.”134
In addition to placing issues of diversity front and center in the school’s curriculum, LMU also recruits diverse, high-achieving applicants by prioritizing relationships with promising candidates. In fall 2014, 66 percent of the 1,412 candidates enrolled in LMU’s programs were students of color.135 Another of LMU’s strategies for increasing diversity is to provide substantial financial aid to its students. In 2015, LMU gave financial support to 81 percent of its student population.136 “We are always looking for high-quality applicants from historically underrepresented groups,” Martin said. “When we identify those students, we try to engage them in a relationship to ensure that whatever it will take to recruit them, we are able to do.”137
LMU’s commitment to diversity extends beyond its student population. In fall 2014, 46 percent of LMU’s School of Education full-time faculty members and 40 percent of part-time faculty members were people of color.138 Additionally, students at LMU benefit from a variety of community partnerships between LMU and diverse local organizations and schools. LMU’s teacher preparation programs serve approximately 250 schools across 20 school districts.139 In the fall 2015 term, LMU placed 330 students in clinical residencies in the Los Angeles Unified School District alone,140 one of the most diverse school districts in the country.141 LMU also serves as an exclusive partner with TFA in Los Angeles and San Francisco. Through this partnership, LMU provides graduate training, coaching, and support to a diverse cohort of Teach For America corps members in California.142
Teach For America
TFA is a nonprofit organization that recruits, selects, trains, and supports high-achieving individuals—about two-thirds of whom are recent college graduates—to teach for at least two years in low-income schools nationwide.143 Founder Wendy Kopp made diversity an explicit goal, saying “My own belief and conviction is that we were not going to be successful if we weren’t diverse. … My conviction in this grew over time as I saw firsthand the added value that people who shared the background of their students could bring—in the classroom, in grounding our staff discussions, in inspiring the confidence and trust in our communities.”144 TFA believes that, in order to address the complex challenges faced by the communities where corps members teach, their teachers must represent “a range of perspectives and experiences.”145
TFA considers it an essential part of its mission to recruit both high-quality and diverse teachers, employing innovative techniques and investing considerable time and effort toward these ends. In the 2015-16 school year, 50 percent of its corps members were people of color—versus 18 percent across all teacher preparation programs. This makes TFA one of the most diverse teacher preparation programs in the country.146
TFA’s success in recruiting a diverse corps is based on a strategy of hands-on recruitment that actively works to reach students of color where they are. The entire recruitment team is responsible for meeting the organization’s diversity goals, and they receive specialized training to help them connect with potential applicants from many backgrounds. The organization makes a point of meeting with candidates individually or in small groups to begin building relationships, rather than waiting for potential candidates to come to them.
With the help of a data dashboard, recruiters set goals around the number of face-to-face contacts they will make with students of color and track indicators of progress toward those goals. They research which campuses have the highest percentage of students of color and speak to classes and student organizations about the benefits of TFA; they have visited more than 25 historically black colleges and universities (HBCUs) and multiple colleges with large Latino student populations. They also frequently seek input from current corps members of color to ensure that TFA is a place where people of color feel comfortable and welcome, since word of mouth from current and former members is one of TFA’s most important recruitment tools. The effort to ensure that TFA is a welcoming environment includes developing cultural competence in its staff members, and over the past few years, TFA has launched an organizationwide, multisession diversity series focused on how the organization is working to live up to its core values in regards to diversity.147
TFA’s selection process is known for its intensity and the fact that only 14 percent to 16 percent of applicants are admitted. Applicants advance through progressively difficult rounds of screening, including an application review, a phone interview, an online activity, and a full-day final round that consists of a live interview, sample lesson, and group problem-solving activity. This selectivity fuels a virtuous cycle: Since only the most qualified candidates make the cut, the program’s cachet has skyrocketed. This keeps the number of applicants in the pool high, which in turn allows TFA to remain selective. In the past few years, however, mirroring a nationwide trend of declining teacher preparation program enrollment, applications have gone down significantly.148
The organization takes a holistic approach to selection, rather than “using a blunt instrument like cut scores on Praxis or content exams, which can dramatically impact diversity in a negative way,” says Anne Mahle, who currently serves as senior vice president for public partnerships but led recruitment for many years.149 Although the average GPA of corps members is 3.42, TFA maintains a relatively low cutoff requirement of 2.5 and instead places greater emphasis on candidate evaluations designed to measure characteristics that TFA’s research has shown its most effective teachers share. These include:
- A deep belief in the potential of all kids and a commitment to do whatever it takes to expand the opportunities for students, often with a perspective informed by experience in low-income communities and an understanding of the systemic challenges of poverty and racism
- Demonstrated leadership ability in a variety of settings
- Strong achievement in academic, professional, extracurricular, and/or volunteer settings
- Perseverance in the face of challenges, ability to adapt to challenging environments, and a strong desire to do whatever it takes to improve and develop
- Long-term commitment to reaching goals and a strong desire to improve and develop, both personally and professionally
- Excellent organizational ability, including planning well and managing responsibilities effectively
- Excellent interpersonal skills and a proven ability to motivate others
- Respect for individuals’ diverse experiences and the ability to work effectively with people from a variety of backgrounds150
Applicants are assessed on each of the above characteristics throughout the screening process.
TFA’s strategy has also paid off in terms of teachers’ performance once in the classroom. North Carolina, Louisiana, and Tennessee all independently concluded that TFA corps members were the most effective out of recent graduates from other teacher preparation programs with which they had worked.151 A controlled study conducted by Mathematica found that students taught by TFA teachers earned higher math scores than students taught by non-TFA teachers with similar years of experience; the TFA-taught students learned approximately 2.6 months of additional material in math during the school year.152 Similarly, another study found that TFA first to third grade teachers’ students grew 1.3 additional months in reading compared with their peers who had non-TFA teachers.153
With the recovering economy and more career choices available for college graduates, recruitment has become more challenging, but TFA is committed to maintaining its diverse and talented workforce.154 Mahle explained, “The opportunity to give back to their communities in a meaningful way and to have an impact in their work has been a very strong draw for all Millennials, including teachers of color, and I’m sure it will continue to be.”155
Boston Teacher Residency
The BTR program began as a partnership between the Boston Public Schools (BPS) and the Boston Plan for Excellence (BPE), an education nonprofit formed in 1984.156 The BTR was created in 2002 to address Boston’s most pressing teacher pipeline challenges:
- A shortage of teachers in high-needs areas, such as math, science, special education, and teachers of English language learners
- A shortage of people of color entering the teacher workforce
- High teacher turnover of new teachers in BPS157
The BTR is designed to be accessible to community members of all ages, including career-changers who bring valuable skills from other sectors. Residents’ initial training year combines graduate-level coursework and classroom co-teaching experience with a mentor teacher, who is the teacher-of-record. Under the tutelage of their mentors, residents take on increasing responsibility over the course of the preparation year. Residents receive a living stipend, tuition remittance, and ongoing professional development, and they commit to teach in BPS for at least three years after their preparation year.158
Across BPS, just one-third of teachers are black and Latino, and yet more than two-thirds of the student population are black and Latino.159 The BTR was founded with the commitment that half its participants would be teachers of color, and BTR graduates are more racially and ethnically diverse than other new teachers in BPS.160 As Kimberley Ednie, BPE’s former director of talent, stated:
Given the incredible diversity of the student population in Boston, diversity in the teacher workforce is critical to help students to see themselves as scholars and future leaders. Students in Boston need more access to high-quality, ambitious teachers of color who are culturally responsive, who believe in and are committed to students’ long-term success, and who can help students to see and capitalize on their strengths.161
Admission to the BTR is highly competitive, and the cohort of 600 that have graduated since 2004 have shown promising results. BTR graduates tend to teach in BPS for longer periods of time, and they teach in high-need areas such as math, science, special education, and tend to be teachers of English language learners. Additionally, almost half of BTR graduates are teachers of color. Of the BTR graduates who have been placed in BPS teaching jobs, 71 percent remain teaching in BPS after their sixth year, compared with 51 percent of their peers. Fifty-five percent of secondary graduates teach math or science, and 37 percent of graduates teach students who are English language learners or who have special learning needs. Forty-nine percent of BTR graduates are teachers of color, with 35 percent identifying as African American or Latino.162 What’s more, graduates with four or five years of experience have been found to outperform other veteran BPS teachers, and 97 percent of principals would recommend hiring a BTR graduate to a colleague.163
Like TFA, the BTR reviews candidates’ applications comprehensively rather than using one or a few measures as a primary factor. While prior evidence of strong academic performance is essential, evaluators also consider a candidate’s course of study, content assessment results, commitment to Boston’s children, and work experiences. An applicant’s essays, recommendation letters, interview answers, minilesson, and group problem-solving activities are also given significant weight and are closely examined for evidence of traits such as commitment to diversity and community, professionalism, grit, and a willingness to learn and grow.164
The BTR is also committed to meeting candidates where they are, financially and otherwise. By partnering with AmeriCorps, run by the Corporation for National and Community Service, the BTR is able to offer a living stipend, health insurance, and program cost assistance during students’ training year. This financial assistance helps ease the burden for qualified applicants who could not otherwise afford to participate. Its recruitment efforts focus primarily on HBCUs; other campuses attended by high percentages of students of color; diverse community, faith-based, and professional groups; and local nonprofit programs that contribute to a more diverse teacher pipeline, such as Breakthrough Collaborative, City Year, the Posse Foundation, and the Woodrow Wilson-Rockefeller Brothers Fund Fellowship for Aspiring Teachers of Color.165
Just as TFA’s leaders observed, the BTR’s leaders noted that a one-on-one approach to recruitment is significantly more effective than efforts made through producing a flyer or brochure. After making an initial in-person contact at a career fair, community meeting, or school event, BTR recruiters and alumni stay in close communication with potential candidates so that candidates begin to feel a connection with the BTR family. BTR staff also survey participants regularly to ensure that they feel supported and well-prepared, hoping that satisfied alumni, collaborating teachers, and school principals will continue to refer new candidates with frequency and enthusiasm.166
As of 2015, the BTR started shifting into research and development mode to pilot a more financially sustainable training model: a neighborhood-based, Pre-K through 12th grade pathway of schools called Teaching Academies, designed to both serve as exceptional schools for students and families and to develop highly effective teachers.167 For the time being, this has necessitated a smaller teacher resident cohort. Leaders anticipate ramping up efforts again in the near future to ensure a steady stream of diverse teachers into BPS for years to come.
The analyses and examples included in this report give reason to believe that increasing selectivity into the teaching profession can be done without adversely affecting diversity. But given the disparities that exist—particularly in potential teachers’ performance on standardized tests—it is still important to be cautious about increasing cut scores for various entry points into the profession.
Some of the programs that have done an exemplary job of supporting both teacher selectivity and diversity followed paths that can provide lessons for others to emulate. First, these programs have established a selective but reasonably flexible bar for academic standards supplemented by factors such as behavioral competencies that are thought to predict success in the classroom. Second, they have greatly expanded their candidate pools via high-touch recruitment efforts that seek out and support people of color. Based on these two principles and other lessons from the authors’ analyses, this section outlines recommendations for state leaders and policymakers and for traditional and alternative teacher preparation programs.
State leaders and policymakers
Increase the potential pipeline of teachers of color by increasing the college readiness and high school graduation rates of students of color. Efforts to increase the number of students of color who attend and graduate from college may be a powerful lever for increasing the diversity of the teaching profession. State policies to raise standards so that they are aligned to college and career readiness, to increase high school graduation rates, and to provide supports for first-generation college students can all indirectly contribute to increasing the diversity of the teaching profession.
Institute a process of regular review and recertification, similar to New York’s, that requires programs to meet a high bar in order to attain recertification. This process should:
- Require that all programs in the state, at a minimum, attain CAEP accreditation or meet similar requirements. While some states may want to set up state-specific systems, all states should have a set of high standards for educator preparation. These standards should include a high but flexible bar for entry—CAEP’s is a 3.0 cohort GPA, recommended below for all teacher preparation programs—and meaningful coursework and clinical preparation requirements that are aligned with research and linked with higher performance once in the classroom.
- Include public reporting on the diversity of students and faculty. With an eye toward a statewide goal of increasing the diversity of both students and faculty at preparation programs, schools of education and alternative certification programs should report on the results of their work to attract and recruit diverse teacher candidates and faculty members. Increasing every school of education’s diversity should also be considered in the recertification process.
- Prevent new programs from opening unless there is a demonstrated need. For institutions of higher education and alternative certification providers seeking to create new teacher education programs, the approval process should include a requirement that they provide data justifying the need for additional programs in their state or region.
Allow a phase-in period for the above changes. States should expect teacher preparation programs to improve but provide time and support for the transition. States should follow Rhode Island’s lead in allowing for a pilot period to set up program providers for future success under the new guidelines. During the pilot period, states should meet individually with representatives from each preparation program to discuss data on accepted applicants, broken out by academic and demographic indicators. Or they should follow the example of New York, which rolled out its reforms gradually over several years, giving preparation programs a chance to adjust one step at a time.
Provide grant funding for innovative and/or evidence-based recruitment plans and implementation. This funding should be combined with technical assistance such as sharing tools, training materials, and best practices for one-on-one, high-touch recruitment that expands the candidate pool. These tools and resources could help programs set, meet, and record goals around face-to-face contact and follow-up.
Close emergency certification routes and fill vacancies with high-quality alternative certification candidates whenever possible. This policy change was a key part of New York’s success, and too many states are responding to current teacher shortages by allowing for more emergency licenses rather than closing this loophole into the profession.
Increase teacher pay and reduce the cost of education for prospective teachers. Higher pay can attract potential teachers of all backgrounds and ethnicities to the profession. All teachers deserve to earn salaries that are at least commensurate with the salaries of other similarly educated and experienced professionals. Given other industries’ interest in diversifying their workforces, potential teachers of color are often heavily recruited for other professions, exacerbating the impact of teacher compensation in attracting teachers of color.
Teacher compensation should be high enough to attract and retain students from all backgrounds. It should also be sustainable so that teacher candidates and teachers know they can count on their current salary for the long term. Just as increasing teacher pay will increase the diversity of the teaching profession, altering other elements of teacher working conditions will also help boost diversity. Improved pay will be most effective as a recruitment lever for high-achieving, diverse candidates if it is coupled with the kinds of working conditions that such candidates can expect in other professional fields, such as high-quality onboarding or induction, relevant professional learning opportunities, opportunities to collaborate with colleagues, and opportunities to advance within the profession.
The cost of college and the burden of student loans can be problematic for many low-income and first-generation students. State-funded loan forgiveness or scholarships for high-achieving individuals to go into teaching would also reduce some of the financial concerns associated with a career in teaching.
Although this report deals primarily with selectivity as it relates to entry into teacher preparation and alternative certification, states can also increase the selectivity of the teaching profession through their licensure systems. Raising cut scores, switching to high-quality and predictive performance-based assessments, and implementing tiered licensure systems in which there are high standards and expectations for professional accomplishment—beyond readiness to teach—are all levers available to states seeking to increase selectivity. As with selectivity in preparation, it is important to be cautious of how these levers may affect the diversity of the profession if implemented arbitrarily or without thoughtful planning.
Traditional and alternative teacher preparation programs
Maintain flexibility at the individual level when increasing academic standards and/or use multiple measures or multiple measurement options. Teacher education programs should follow CAEP’s recommendation for a 3.0 GPA for a program’s entire entering cohort so that some individuals who have promise based on other measures but don’t quite meet the GPA cutoff are still eligible.168 This ensures that a promising candidate is not categorically denied entry but also keeps the general standard quite high. Even though the target GPAs for Rhode Island, LMU, TFA, and the BTR are different, each organization has adopted similarly flexible guidelines. For states that prefer to use an entrance exam, giving applicants the opportunity to use one of several options or to couple their results on said exam with other relevant application materials can have a similar effect.
Measure competencies associated with highly effective teachers and invest in research that will improve how predictive those measures are for teacher effectiveness. Instead of relying solely on blunt academic cut-points, teacher education programs should follow the lead of programs such as the BTR and TFA, where academic proficiency requirements are high but competencies are equally important. Philanthropic or government funders could assist in this process by funding rigorous study of the relationship between teacher competencies and student outcomes to determine which measures and what levels of performance best predict how much students will learn. They can then disseminate their findings widely within the education field.
Invest in a strategic recruitment campaign with targets and goals to expand the selection pool. As TFA and the BTR have done so effectively, teacher education programs should talk with potential candidates of color face-to-face about the benefits and value of teaching, as well as the opportunity to give back to the community. Good places to start include HBCUs and Hispanic-serving institutions; high schools and colleges with high percentages of high-achieving students of color; and community or faith-based groups. Teacher education programs should send student ambassadors to such groups and organizations and ask alumni of color to reach out to their networks. Rather than chance, they should also rely on data tracking by tracking first contact and follow-ups and hold recruiting staff accountable for meeting with a target number of students of color.
Build word-of-mouth recruitment by making campuses welcoming places for students of color. Leaders from both TFA and the BTR stressed the importance of making a preparation program one that current participants of color want to tell their friends about. Teacher education programs should make their campus climates more welcoming for students of color by:
- Ensuring that all students have meaningful field work and effective teacher mentors
- Offering financial and other forms of support to student organizations and school-sponsored support groups for first-generation teacher preparation candidates
- Offering highly competitive scholarships, including living expenses, to an elite cohort of students of color
- Administering surveys, organizing roundtables, or collecting data in other ways to gather feedback on student satisfaction, and then taking steps and publicizing changes made based on feedback
- Developing effective cultural and racial sensitivity training programs for teachers and faculty
Taken together, these recommendations—which have been successfully employed by some teacher preparation programs—provide several options for other such programs to more intentionally recruit diverse, high-achieving students into the teaching profession and provide them with support.