A table in this brief contains a correction.
For years, federally driven school classification systems focused almost entirely on test scores. This was done by design to emphasize critical reading and math skills and to make systems simple, transparent, and objective. With time, however, it became clear that this framework was too rigid. Parents and stakeholders viewed school quality through a wider lens, and state systems overlooked important elements such as school culture and climate.
The bipartisan Every Student Succeeds Act of 2015 (ESSA) ushered in a new way to improve K-12 schools.1 ESSA promised states the opportunity to create more holistic school classification systems using new measures of school quality or student success—without losing sight of academic achievement.
Some states had already started down this path, broadening the measures they used to assess school quality in response to federal education policy changes made in 2011 through the Obama administration’s No Child Left Behind waivers.2 Building on this progress, ESSA requires all states to rethink their school classification systems in consultation with community members.
By the start of the 2017-18 school year, states must complete their plans to meet ESSA’s requirements. So far, 16 states and Washington, D.C., have submitted their plans to the U.S. Department of Education, which must review and approve them before they are put into action. The remaining 34 states—plus Puerto Rico and the Bureau of Indian Education—must submit their plans by September 2017 to undergo this same process.3
As plans roll in, policymakers, advocates, and other stakeholders have their eye on certain policies, including how states expand their classification indicators to include measures other than test scores and graduation rates. This issue brief explores which new indicators of school quality or student success states use and how they include them in their school classification systems. States are also considering including them in their accountability systems outside of school classifications—for example, by publicly reporting and/or using data to inform the development of intervention and support plans. The brief concludes with recommendations for states as they finalize their plans.
Indicator overview
ESSA requires states to use at least five indicators to classify schools:
- Academic achievement in reading and math
- Another academic indicator, such as student growth in reading and math
- Four-year high school graduation rates, with the option to include extended-year rates
- Progress toward English language proficiency (ELP)
- At least one measure of school quality or student success
The law gives states a handful of suggestions for the fifth indicator, including student or educator engagement; student access to and completion of advanced coursework; student postsecondary readiness; school climate and safety; or any other measure that meets the law’s technical requirements. States also have the flexibility to use multiple indicators or to use multiple measures within each indicator of school quality or student success. Throughout this brief, the terms “measures” and “indicators” are used interchangeably, unless referring to multiple measures—or components—of one indicator.
This brief considers any indicator to be an indicator of school quality or student success if it does not measure: academic achievement or student-level growth on state assessments in all academic subjects—see the “Indicator analysis” section for more; four-, five-, six-, or seven-year graduation rates; or ELP. It organizes school quality or student success indicators into the four categories below and analyzes how much each category contributes to school ratings, on average, in statewide school classification systems.4
- Early warning indicators
- Persistence indicators
- College- and career-readiness indicators
- Enrichment and environment indicators
Every state includes at least one indicator from the four categories, and a handful of plans—Washington, D.C.’s, Louisiana’s, Massachusetts’s, New Mexico’s, and North Dakota’s—will use at least one indicator from each category.5 Overall, the 17 submitted ESSA plans include nearly 40 indicators—measured in a variety of ways—across all four categories of indicators.6 On average, these measures contribute to around 20 percent of school ratings.7 For state-specific information, see CAP’s “School Accountability in First-Round ESSA State Plans.”


Early warning indicators
Sixteen states use an early warning indicator, which helps educators identify at-risk students. Thirteen states use a measure of chronic absenteeism; four states measure attendance; and seven states include an “on track to graduate” measure. Of these states, early warning indicators are an average of 10 percent of school ratings.8

For example, Connecticut’s “on track to graduate” indicator measures the percentage of ninth-graders earning at least five full-year credits.9 Massachusetts, on the other hand, measures the percentage of students who fail a ninth-grade course.10 Illinois uses a hybrid approach, counting students as on track if they earn at least five full-year course credits in ninth grade and no more than one semester F in a core course their first year of high school.11

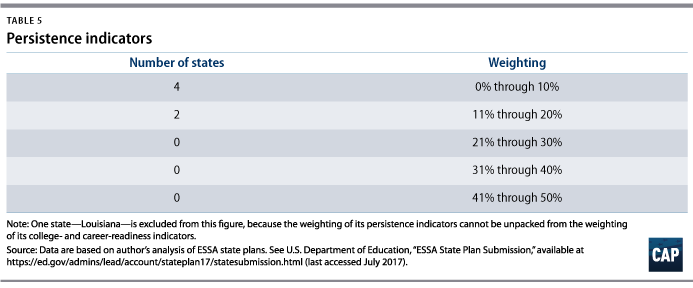
Persistence indicators
ESSA requires states to use at least the four-year adjusted cohort graduation rate for high school ratings, and 13 states include an optional extended cohort graduation rate, such as five-, six-, or seven-year rates. In addition, seven states include persistence indicators beyond what the law requires, which this analysis considers to be measures of school quality or student success. For example, three states use a dropout measure, and six states include alternate or modified graduation indictors such as GED diploma attainment. Of these seven states, additional persistence indicators are an average of 8 percent of high school ratings.12
Oregon, for example, uses a five-year high school completion rate, which is the percentage of students earning a diploma, an extended diploma, a GED diploma, or an adult high school diploma. This indicator will also help the state designate alternative and youth correction schools—where students often need more time to complete a degree—for comprehensive or targeted support and improvement.13

College- and career-readiness indicators
Thirteen states will include a measure of college and career readiness in their school classification systems.14 Broadly, these indicators include participation in or performance on advanced coursework or postsecondary entry exams; career preparedness measures; postsecondary outcomes; and other measures of postsecondary readiness, such as GPA or high school diploma pathways. Of states that include these measures, college- and career-readiness indicators are, on average, 20 percent of high school ratings.15

Many states use a college- and career-readiness index or rubric. Arizona schools, for example, can earn up to two points per graduating senior based on a variety of indicators, including meeting SAT or ACT cut scores and benchmarks for ACT WorkKeys assessments, which measure workplace skills.16 Louisiana schools earn index points based on the strength of the diploma that students receive, from a high school equivalency credential to a high school diploma plus an associate degree.17 North Dakota’s choice-ready framework, on the other hand, measures the percentage of students who are on track to graduate through three pathways—college ready, career ready, and military ready—each with unique requirements.18

Enrichment and environment indicators
Thirteen states will include measures of academic enrichment or school environment in their school ratings, ranging from measures of a well-rounded education to school climate.19 For example, four states include a measure of physical fitness and three states include access to or participation in arts or music. Four states will use a student engagement or climate survey, which consider a range of school environment conditions such as teacher support and school safety. One state—Arizona—considers whether students with disabilities are included in general classrooms. Three states—in addition to the law’s assessment requirements—use another cut of test score data such as improvement among subgroups of students, including those from low-income families, students from major racial and ethnic groups, students with disabilities, and English language learners. These indicators, on average, are 11 percent of school ratings.20

Additionally, ESSA requires states to annually test 95 percent of students in reading and math, to use the participation rate to calculate the achievement indicator, and to factor assessment participation into the statewide accountability system another way.21 For example, four states—Connecticut, Massachusetts, New Mexico, and Vermont—plan to lower a school’s classification for not meeting this requirement.22 In three states—Illinois, Nevada, and Tennessee—schools that do not have a 95 percent participation rate cannot score at the highest level of proficiency; receive zero points for proficiency; or receive an F on the achievement indicator for the given group of students, respectively.23

Indicator analysis
ESSA requires that states give “substantial weight” to achievement, the second academic indicator, graduation rates, and ELP and “much greater weight” to those measures in the aggregate compared with school quality or student success indicators.24 States’ interpretations of this requirement vary and may depend on how they label the indicators in their school classification systems.
For example, some states do not label any school classification indicators in their ESSA plans with the term “school quality or student success.” Some states label some, but not all, of the indicators that qualify as measures of school quality or student success with this term. Other states include measures of school quality or student success within other indicators, such as the achievement indicator. The analysis in this brief considers all measures that qualify as measures of school quality or student success under ESSA—regardless of state plan organization or labeling—as this type of indicator.
For example, in its initial submitted state plan, Washington, D.C., includes performance on the SAT or ACT and participation in and performance on Advanced Placement and International Baccalaureate exams in its achievement indicator. Nevada’s state plan, on the other hand, refers to its measures of college and career readiness and student engagement as “other indicators.” This analysis categorizes both sets of indicators as measures of school quality or student success.25
On the other hand, in order to comply with ESSA, states may use additional academic subjects such as science and social studies as the second academic indicator for elementary and middle schools, or as an indicator of school quality or student success for any schools, according to initial feedback from the Education Department.26 The analysis in this brief excludes these measures when identifying and weighting measures of school quality or student success.
On average, states include school quality or student success indicators as approximately 14 percent of elementary and middle school ratings and 26 percent of high school ratings.27 Prior to ESSA, these types of indicators similarly averaged around 20 percent of school classification systems.28 Notably, two plans—Washington, D.C.’s and North Dakota’s—include measures of school quality or student success as more than 50 percent of high school ratings.29 The bulk of these measures are college- and career-readiness indicators, such as performance on the SAT, ACT, or ACT WorkKeys; participation or performance in advanced coursework; and earning industry-recognized credentials.
Additionally, of the 17 submitted plans in this review, the majority of states are using new or different indicators compared with their systems prior to ESSA’s passage. For example, 11 additional states are using chronic absenteeism and seven more states use measures of college and career readiness. In addition, seven more states are using enrichment or environment indicators, such as measures of a well-rounded education. States have also introduced new indicators, such as re-enrollment, certificates of multiliteracy, participation in summer employment, and completion of the Free Application for Free Student Aid. One plan—Washington, D.C.’s—includes a measure of pre-K classroom quality.30
Considerations
States should keep several considerations in mind as they prepare to submit their plans to the Education Department for review or revise their plans based on initial department feedback. States may refer to the analyses in this brief as points of reference for indicators or weightings, in addition to the recommendations below.
Simple systems
States should create clear and simple classification systems. Parents, teachers, school leaders, and others need to be able to understand why their school receives a certain rating and what it would need to do to improve. Including too many indicators may overcomplicate ratings and dilute the amount of attention that the measures receive. ESSA allows states to use more than one measure of school quality or student success, which may give schools a greater opportunity to demonstrate school performance. But including a dozen indicators or complex indices may make it difficult for schools to know what to focus on, and each individual indicator may lose relevance.
The classification determinations required under the law, however, are only a small part of an effective accountability system.31 Additional indicators can and should be used to drive a system of continuous improvement at the state, district, and school levels. Some states are developing data dashboards with a broad array of data points designed to inform improvement efforts at every level of the system.
Discrete indicators
States should avoid using measures of school quality or student success in other school classification indicators. For example, some state plans include measures of college and career readiness—such as participation in advanced coursework—in the achievement indicator or in the graduation rate indicator. The law requires that these measures be used in a distinct school quality or student success indicator; using these measures in other indicators may make it more difficult for parents to understand which indicators are being used and the respective weight given to them.
Weighting requirements
States should think critically about how to comply with the law’s weighting requirements. The law requires that school classification systems lean heavily toward the academic indicators, compared with the measures of school quality or student success. Having clearly defined indicators will help states comply with this requirement so that nonacademic indicators don’t mask low performance on academic outcome measures. Again, states can use these classification systems to zero in on the areas that need the greatest attention, but they can and should think more expansively about how to use a broad array of measures to support schools’ improvement efforts and provide parents with a fuller picture of school quality.
Disaggregated data
ESSA requires states to be able to disaggregate—or report results by each student group—all measures in their school classification systems, excluding progress toward ELP. Accordingly, states must ensure that they can disaggregate their new measures of school quality or student success to use them for school ratings. Until they can be broken down by student group, these measures will be better suited for public reporting and school improvement.
Supporting all students
States should consider whether their measures of school quality or student success support all students. For example, many states have explored measures of college and career readiness at the high school level, but few have adopted measures of early learning to support younger students toward this goal. States may use different indicators for each grade span, which gives them the opportunity to be inclusive of all grades.
Continuous improvement
States should continue to update and improve on their plans after they submit them to the Education Department. ESSA gives states the flexibility to add new measures to their school classification systems over time. As a result, states should consider including additional indicators of interest once they have collected data for several years and confirmed that new instruments, such as climate surveys, are valid, reliable, and can be disaggregated for all student groups.
Comprehensive data dashboards
States should publicly report performance on additional indicators they use to measure school performance, not just those required for school classification under the law. These classifications are just one small part of effective accountability systems. A broad array of indicators of student and school success—that may not be appropriate to include in the classification system—can and should be used to inform improvement supports. Furthermore, some states are considering keeping the classification determinations focused on schools identified for intervention, rather than using them to rate or grade all schools. Additional data can be catalogued in comprehensive data dashboards for use by parents and district and school personnel for planning school improvement strategies.
Conclusion
States have a world of opportunity as they redesign school classification systems under ESSA. But carefully choosing which new measures of school quality or student success to use is no small task. These measures should align with states’ long-term goals and signal their priorities, which require the time and attention of districts and schools.
The first 17 plans submitted to the Department of Education include a variety of measures, from chronic absenteeism and SAT performance to summer employment. These states can continue to improve their systems as new data become available, and states that have yet to submit their plans to the department can learn from the breadth and depth of new measures included in first-round plans.
Appendix A: Methodology
The author analyzed the ESSA plans that 16 states and Washington, D.C., submitted to the Department of Education, including updated plans, as of August 1, 2017.32 The analysis organizes the new measures of school quality or student success that states use in their school classification systems into four categories: early warning; persistence, other than four-year or extended-year graduation rates; college and career readiness; and enrichment and environment indicators. Some state systems use multiple measures in one indicator, index, or menu of options. This analysis considers each measure in these composite indicators as its own indicator. As a result, the analysis may reflect more indicators than how a state describes its system. This analysis may also categorize measures in ways that are different than state ESSA plan descriptions.
This brief also explores how much measures of school quality or student success contribute to school ratings. Weightings for each category were calculated based on the total points or percentage points a school can earn for each indicator, or the relative weighting of each indicator if a system did not use a performance index. For states that described two phases of indicator weighting, the analysis used the weightings in their second phase.
The ranges and averages for the early warning and enrichment and environment indicator categories include weightings for elementary, middle, and high schools. The ranges and averages for the persistence and college- and career-readiness indicators categories include high schools only. Averages do not include data from states that do not include or weight indicators in a respective category. Additionally, it was not always possible to unpack the weightings of measures that states include in composite indicators.
Samantha Batel is a policy analyst with the K-12 Education team at the Center for American Progress.
*Correction, August 8, 2017: Table 8 has been updated to include the accurate state-defined measures for postsecondary entry exams and career preparedness.