We want to get the best teachers to the students who need them most, but a review of data from the newest teacher evaluation systems show that that is not always what happens. In an analysis of the newest data, we find that in some areas, poor students and students of color are far less likely than others to have expert teachers.
However, this pressing issue of equal access to great teaching is on the radar of policymakers and advocates. It has taken center stage as a key education policy for the coming year. President Barack Obama spotlighted it in his fiscal year 2015 budget request. Federal officials at the U.S. Department of Education are on the verge of issuing a new strategy to require all states to update their plans to ensure that every student has equal access to high-quality teaching. All told, this is a good time to take a look at new educator evaluation data to see if the information generated by this new reform can illuminate this issue. The concern among policymakers and student advocates is that students in disadvantaged schools are less likely to have access to high-quality instruction than students in affluent schools.
Now that some states have evaluations of teacher effectiveness based on new accountability measures, it is possible to glean information about the distribution of teachers across school demographics. We made the following findings:
- The new evaluation data confirms previous findings—in many places, poor children and children of color are less likely to be taught by a highly effective teacher.
- Despite the overall pattern of inequitable distribution, there are some places where excellent teachers are more evenly deployed.
- The places with a more balanced distribution of effective teachers are where we should look to learn about the policies and practices that help give all students access to great teaching.
New definitions of effectiveness in teaching
In the past five years, the definition of teacher effectiveness has undergone a shift from being based on credentials and years of experience to being measured by observations of instruction and student learning. In the No Child Left Behind Act of 2001, or NCLB, the most recent reauthorization of the Elementary and Secondary Education Act, Congress defined a highly qualified teacher as one with a bachelor’s degree who is state certified or licensed and demonstrates content knowledge in the subject area taught. Under that definition, the research is conclusive: Poor children and children of color are less likely to be taught by highly qualified teachers.
Yet in recent years—as the result of research done such as that by the Measures of Effective Teaching project—the definition of effectiveness has changed. Now, an indicator of effective teaching is more likely to be based on measures of student learning, observations of instruction, and other possible data. Although there is some debate over the exact mix of student achievement, observations, and results from other measures that combine to create an evaluative rating for a teacher’s effectiveness, there is consensus among researchers that it should include multiple measures.
Most states have already begun to use new systems to evaluate teachers or will begin to do so in the upcoming school year. The data from these systems, which are ratings of teachers based on multiple measures, can be used to probe whether all students—regardless of background—have access to highly effective teachers.
Using new evaluation systems to observe teacher distribution
We took a close look at Louisiana and Massachusetts, two early adopters of new teacher evaluation systems that have released effectiveness data using new measures. These states released the percentages of teachers in each rating category by state, district, and school. But neither state released the data in a way that individual teachers’ ratings were made public; they instead put out percentages of teachers’ evaluation ratings by school.
We compiled poverty data for each school in the two states based on the percentage of students in each school who were eligible for free or reduced-price lunches, as well as enrollment data based on the percentage of students of color enrolled.
Using these data for each school available on the states’ websites, we were able to estimate the level of poverty and minority enrollment for each school.
The distribution of effective teachers in Louisiana
Our analysis of equitable teacher distribution in Louisiana includes 1,265 schools for which there were reported data on the results of teacher evaluation. The state requires every teacher to be evaluated, with 50 percent of the evaluation rating based on student growth and the rest based on other measures of teacher performance, such as observations of instruction. The state developed and piloted a state evaluation system called Compass that districts can use but that also allows districts to develop and use their own local evaluation systems as long as they comply with state law.
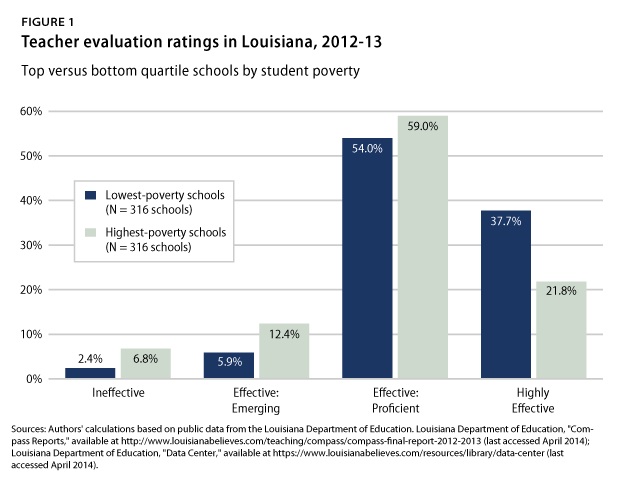
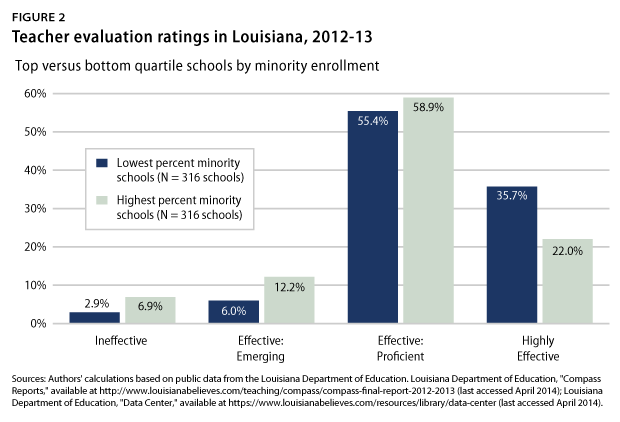
Louisiana has four effectiveness ratings for teachers: “Ineffective,” “Effective-Emerging,” “Effective- Proficient,” and “Highly Effective.”
To determine the level of poverty in schools, we looked at the percentage of students enrolled in a school who were eligible for free or reduced-price lunches. We then looked at the 25 percent of schools with the greatest proportion of students in poverty and compared them to the 25 percent of schools with the smallest proportion of students in poverty. Louisiana has 316 schools with the highest levels of poverty, with 90 percent or more students qualifying for free or reduced-price lunches, and the same number with the lowest levels of poverty, with 57 percent of students or less qualifying for the lunches.
We did the same for minority enrollment, selecting the 25 percent of schools with the greatest concentration of students of color compared to the 25 percent of schools with the lowest percentage of students of color. Schools in the top quartile of minority enrollment had 84 percent students of color or more, and schools in the lowest quartile had 25 percent students of color or less.
The graph below shows the distribution of teachers between the districts with the most affluent and most impoverished students. Based on the new evaluation data, a student in a school in the highest-poverty quartile is almost three times as likely to be taught by a teacher rated ineffective as a student in a school in the lowest-poverty quartile. Looking at the other side of the effectiveness spectrum, the proportion of highly effective teachers in impoverished schools is about 40 percent less than the percentage in low-poverty schools.
Looking at the distribution of teachers by minority enrollment in schools, students in schools with high minority enrollment are more than twice as likely to have an ineffective teacher as students in schools with low minority enrollment. Conversely, a student in a low-minority-enrollment school is 38 percent more likely to have a highly effective teacher than a student in a high-minority-enrollment school, though the concentration of Effective-Proficient teachers is slightly higher in the highest-minority-enrollment schools.
The distribution of effective teachers in Massachusetts
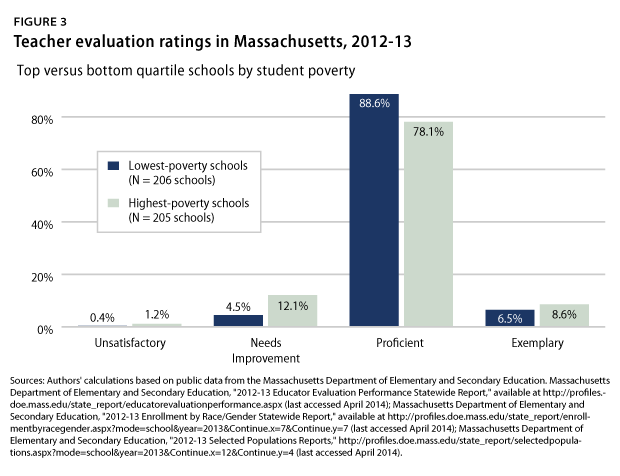
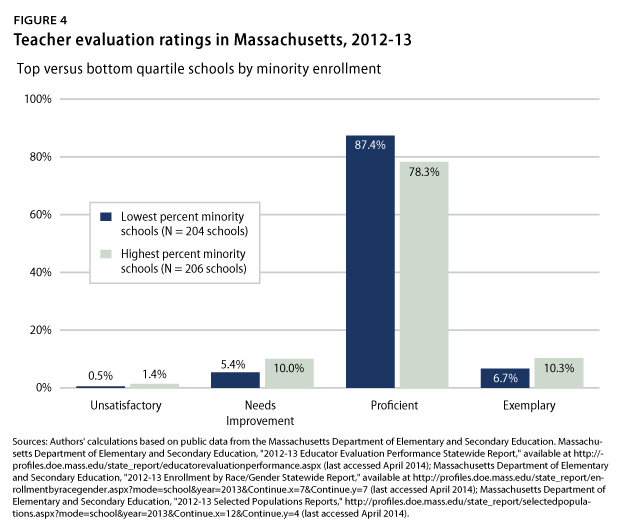
There were 1,849 schools in Massachusetts last year, and this analysis includes data from 823 schools in the state’s Race to the Top districts that implemented new evaluation systems in the 2012-13 school year. The current school year is the first in which the remaining districts will be required to implement evaluation systems. Districts had to either adopt the state’s model evaluation system or develop their own and earn state approval. All Massachusetts districts must have four effectiveness ratings for teachers—“Unsatisfactory,” “Needs Improvement,” “Proficient,” and “Exemplary”—and these ratings must include multiple measures, including student achievement based on the state-mandated standardized test and classroom observations of instruction.
We grouped the schools in Massachusetts as we did for Louisiana, selecting the 25 percent of schools with the highest poverty concentration and the 25 percent of schools with the lowest poverty concentration. That grouping leaves us with 206 schools in the lowest quartile of poverty, with 20 percent or less students qualifying for free and reduced-price lunches and 205 high-poverty schools in which at least 77 percent of students qualify for subsidized lunches.
In Massachusetts, the percentage of teachers rated Unsatisfactory is small overall, but students in high-poverty schools are three times more likely to be taught by one of them. The distribution of Exemplary teachers favors students in high-poverty schools, who are about 30 percent more likely to be taught by an exemplary teacher than are students in low-poverty schools. However, students in high-poverty schools are less likely to be taught by a Proficient teacher and more likely to be taught by a teacher who has received a Needs Improvement rating.
The top quartile of schools in terms of minority enrollment included 206 schools with more than 77 percent students of color, while the lowest quartile included 204 schools with fewer than 14 percent students of color. As in Louisiana, few teachers in these schools were rated Unsatisfactory.
What the data tell us about the equitable distribution of teachers
Clearly, there are some places where poor students and students of color have fairly equitable access to highly effective teachers and some places where they do not. But if we want to make sure that every student has access to excellent teaching, then we need to take steps to ensure that there are high-quality teachers in every school. There are a number of policies that are being enacted to attract excellent candidates into teaching and retain great teachers in the profession.
One district that has tackled this with some success is Ascension Parish Schools in Louisiana. The district of about 21,000 students is diverse, with almost half of students eligible for free or reduced-price lunches and 40 percent students of color. The figure below shows that the distribution of Highly Effective and Ineffective teachers is more evenly spread across schools with different concentrations of poverty.
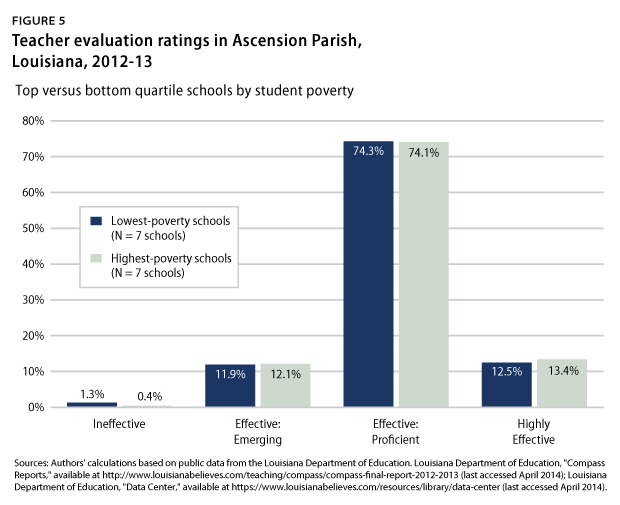
One way the district achieved this was through the institution of systems that led to improvement in teaching quality, with a focus on the district’s most disadvantaged schools, according to Ascension Parish Superintendent Patrice Pujol. Ascension Parish Schools use TAP: The System for Teacher and Student Advancement, which includes as part of its design an emphasis on teacher evaluation, feedback, and collaboration around improvement.
The distribution of effective teachers in Ascension Parish highlights another policy lever—helping teachers in all schools become more effective. This analysis points out how important it is to locate places where there is an equitable distribution of teachers and find out what educators do there to make sure all students have access to great teaching. The new evaluation data, which are already indicating that there is inequitable distribution of excellent teachers, are a reminder that this problem has not been solved by education reforms over the past decade.
The solutions for districts have been discussed and reported on before, but they are worth repeating here:
- Identify high-quality teachers by improving data about teaching effectiveness.
- Use data on the effectiveness of teachers to determine the distribution of these teachers across schools and classrooms.
- Retain effective teachers by reforming career and compensation systems.
- Increase the reach of highly effective teachers by creating roles for master and mentor teachers to support and coach their colleagues.
- Encourage effective teachers to move to disadvantaged schools through incentives such as differentiated compensation.
- Improve the effectiveness of all teachers through proven professional development.
- Improve recruitment of new teachers, with the goal of hiring an effective teacher workforce.
This list may seem daunting, but even working toward one or two of the policies listed above could improve the quality of teaching in schools and greatly increase the chance that disadvantaged students get a level of superb instruction that could change the course of their lives.
Jenny DeMonte is the Associate Director for Education Research at the Center for American Progress. Robert Hanna is a Senior Policy Analyst at the Center.