Nothing about today’s surface transportation system is an accident. It is the result of planners’ intentional choices to advance automobility—choices that elected officials made possible by expending significant political capital to marshal large sums of tax dollars to build roadways and highways.
For more than a century, state departments of transportation, using a combination of state and federal funds and working closely with local leaders, have developed plans based on the idea that people would own and use an automobile for nearly every trip—whether over a few blocks or across the country. University researchers, engineers, and planners developed technical standards around lane width, lines of sight, slopes and drainage, and intersection design, among many other elements intended to increase the speed of vehicles and the carrying capacity of highways as well as to improve the “comfort of driving.”1
The modern highway era began with the passage of the Federal Aid Highway Act of 1956, which provided a big jolt of federal funding for interstate highway construction and established a federal-state partnership to provide annual funding to build and maintain highways that continues to this day.2 The 1956 Act responded to two challenges. First, Americans were rapidly buying automobiles. In 1920, there were 9.2 million registered vehicles in the United States and a total population of more than 106 million people, or roughly 11 residents for every vehicle.3 By 1956, there were more than 65 million vehicles and a population of 151 million people, or roughly 2.3 residents for every vehicle.4
Second, the 1956 Act addressed deficiencies in the national highway network that at the time hampered farm-to-market access, economic production, and national unity.5 When Congress passed the 1956 Act, 35 percent of all rural roads were unpaved.6 Moreover, only 40 percent of the more than 57,000 miles of state highway repair and construction activity carried out that year was completed using cement or high-quality asphalt.7 The remaining mileage was completed using dirt, gravel, or a thin layer of low-quality asphalt.8
Today, with the exception of a handful of major metropolitan areas, driving has achieved near-total dominance. The U.S. surface transportation system has 1.3 million lane miles of interstate highways and arterial roadways and 7.4 million lane miles of collector streets and local roads.9 In 2017, the most recent year for which data are available, the number of registered vehicles climbed to 264 million, or roughly 1.2 residents for every vehicle.10 Americans drive more than 3.2 trillion miles each year,11 and driving alone accounts for 76 percent of all commuting trips.12
Over time, highway construction and automobility have established a powerful political economy, making alternative approaches to mobility and development difficult to implement. This issue brief discusses the harms and costs—including social, environmental, and economic—that are associated with this trend. It then explains how a so-called all-of-the-above strategy exacerbates or fails to mitigate these costs, using an overpass expansion project in Austin, Texas, as a case study to illustrate this approach’s ineffectiveness.
The high cost of driving
Highway expansion and automobility have facilitated decades of economic growth and wealth creation.13 However, these gains have come at an enormous social, economic, and environmental cost. Since 2015, transportation has been the largest source of greenhouse gas emissions in the United States, surpassing electricity production that year for the first time and continuing to grow ever since.14 Light-duty vehicles, including cars, trucks, and sport utility vehicles, produce more than 1.1 billion metric tons of carbon dioxide equivalents annually.15 To put this number in perspective, if the U.S. light-duty vehicle fleet were a country, it would be the sixth-largest emitter on Earth ahead of Germany and behind Japan.16
If the U.S. light-duty vehicle fleet were a country, it would be the sixth-largest emitter on Earth ahead of Germany and behind Japan.
In addition to contributing to global climate change, motor vehicles with internal combustion engines emit toxic chemicals that harm public health. According to the U.S. Global Change Research Program’s Fourth National Climate Assessment, “more than 100 million people in the United States live in communities where air pollution exceeds health-based air quality standards.”17 Emissions from gasoline and diesel engines include carbon monoxide, ozone, fine particulate matter, benzine, formaldehyde, and volatile organic compounds, among many other substances. Research shows that these toxic chemicals are linked to “cancer, birth defects, neurological damage, damage to the body’s natural defense system, and diseases that lead to death.”18
The surface transportation system is also extremely dangerous—especially for cyclists and pedestrians.19 In 2017, roadway accidents claimed the lives of more than 37,000 people, including 5,977 pedestrians and 783 cyclists.20 On average, a cyclist or pedestrian is killed every 78 minutes in the United States.21 In too many communities, choosing to travel by walking or cycling means taking significant safety risks. The absence of sidewalks, crosswalks, and protected bike lanes and other dedicated infrastructure for nonmotorized users makes the surface system unacceptably dangerous.
Finally, the current surface transportation system acts as a drag on economic productivity. According to research by Texas A&M University, drivers lose 8.8 billion hours due to congestion each year.22 The lost time and added fuel consumption from this delay cost the economy more than $166 billion each year.23
Driving is literally killing us and the planet while also robbing travelers on a daily basis of an extremely precious commodity: time.
The rise of the smart growth movement
In response to the harms produced by highways and automobility, advocates for more sustainable and inclusive communities began a movement known as smart growth. The smart growth movement seeks to build places that offer transportation choice instead of an exclusive focus on driving.24 These policies also support increased urban density and a mixture of land use types as opposed to single-use zoning that often produces income and racial segregation.25 In short, smart growth represents an effort to fundamentally reshape transportation to build inclusive communities that occupy less land and consume fewer fossil fuels while improving safe, affordable access to employment, social services, and community amenities.
Transportation choice provides people with the ability to match trip purpose with the most appropriate mode. Mixed-use zoning is an important part of this process, bringing jobs, health care, and other daily needs closer to where people live. For example, a person is much more likely to walk to purchase a gallon of milk if there is a sidewalk in their neighborhood or if the grocery store is nearby. This may seem obvious to the point of banality, but it is worth emphasizing: One side effect of nearly 100 years of planning transportation for automobility and single-family land use is the loss of human-scale distance between everyday destinations.
The failure of an all-of-the-above strategy
Embedded in the smart growth approach to transportation and land use is the goal of reducing vehicle miles traveled (VMT). Addressing the environmental damage, loss of life, and economic inefficiency that stem from an overreliance on driving necessarily means driving less.
On a practical level, making marginal improvements to the current roadway and highway system—such as adding a turn lane or widening a bridge—is easy for planners to envision and justify. After all, adding more roads to a system of roads is not a conceptual stretch. But for many planners, the idea of building a system intended to reduce driving is untenable.
On a political level, proposing to add more roads to the current system of roads avoids running counter to the deeply entrenched political economy that surrounds driving and low-density development. Highway contractors, real estate developers, and financial institutions—to name only a few of the many stakeholders that have built a business model around automobility—have decades of experience pressuring planners and elected officials to keep the machine churning out new pavement to accommodate more cars.
By comparison, proposing to build new transit lines or robust biking and walking facilities rather than more roads, in combination with substantial land use reforms, requires a much larger conceptual leap. Planners are not tacking something onto the status quo but rather seeking a new form of built environment that is not structured to nurture automobility. This shift requires planners to change their mental equation to solve for a new variable: moving people sustainably instead of moving cars.
Due to both practical and political pressures, many metropolitan regions and state departments of transportation have grudgingly adopted what is known as an all-of-the-above strategy. An all-of-the-above strategy often uses smart growth rhetoric without the concomitant project investments that would usher in real change. This approach nominally accommodates all modes of transportation in a manner that does not disrupt the status quo, thereby avoiding having to confront the reality that the country’s current mode of development is fundamentally unsustainable.
Case study: Austin, Texas
The Austin, Texas, metropolitan area is an example of the muddle that results from an all-of-the-above approach. From 2000 to 2018, the Austin metropolitan area grew from 1.2 million people to 2.1 million people, a compound annual growth rate of more than 3 percent.26 Over this same time, the annual hours of vehicle delay per capita increased by 57 percent from 42 hours to 66 hours.27 In the past decade, the region has also had 303 pedestrian fatalities.28
The most recent regional transportation plan produced by the Capital Area Metropolitan Planning Organization, the organization responsible for transportation planning in the Austin area, is filled with smart growth and sustainability goals. For example, the regional plan seeks to “minimize air pollution and energy consumption related to the transportation system” and “increase the safety and security of the transportation system.”29 Additionally, the plan aims to “minimize negative impacts to environmental resources” and “ensure that the benefits and impacts of the transportation system are equitably distributed regardless of income, age, race, or ethnicity.”
The regional plan also notes that transit and nonmotorized infrastructure “optimizes peoples’ ability to take fewer and shorter vehicle trips, reducing vehicle miles traveled” and that “reducing VMT is one of the cornerstones of efficient transportation system use and can alleviate some demand for infrastructure investment.”
These are laudable goals. But in order to achieve them, the Transportation Policy Board (TPB), which is comprised of many of the elected officials for the Austin region, proposed an all-of-the-above strategy:
The TPB is dedicated to considering all modes of transportation and travel demand management techniques to address the current and expected congestion on our transportation system. This includes bicycle and pedestrian projects, roadway and transit network expansions, travel reduction programs, and operational improvements to the roadway and transit elements.30
And yet, certain investments are incompatible with others. For example, expanding the Austin area roadway network is antithetical to minimizing air pollution and energy consumption related to the transportation system and reducing VMT.
The Stassney Lane overpass
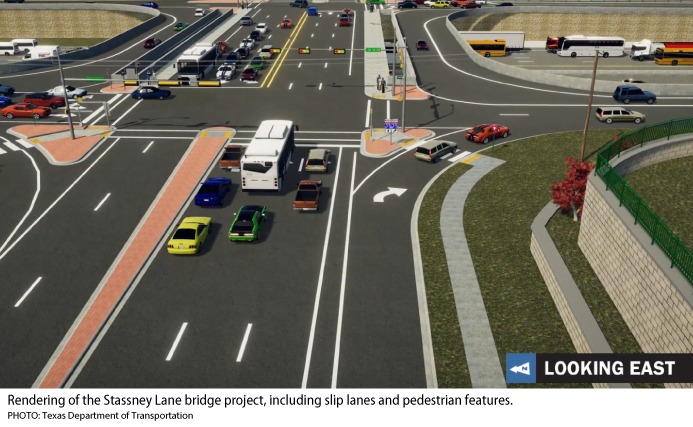
In practice, attempting to implement an all-of-the-above strategy leads to jarring modal juxtapositions and a perpetuation of the status quo. For example, the Texas Department of Transportation (TxDOT) is undertaking numerous improvements to Interstate 35 (I-35), which serves as the main north-south arterial highway through Austin. As part of these improvements, TxDOT is expanding the overpass over I-35 at Stassney Lane in southeast Austin.31 The project design for the expanded Stassney Lane overpass includes both sidewalks for pedestrians and a painted bike lane for cyclists. By historical standards, the inclusion of these elements amounts to a multimodal win. Yet, a closer inspection reveals that the true purpose of the project is moving more cars and that cyclists and pedestrians are highly unlikely to use these elements with any meaningful frequency.
According to TxDOT, “The concept at Stassney Lane consists of a modified conventional intersection to address current issues with delays at the intersection”—in other words, trying to move more cars through the intersection per hour.32 The unit of analysis is vehicle delay and TxDOT engineers have designed a project that will allow more cars to move through the intersection each hour. Other project design elements are clearly subordinate to this purpose. In particular, the following four characteristics of the design illustrate the project’s priorities.
Slip lanes
The most notable example of the new design’s goal to move cars through the intersection more quickly is the presence of slip lanes—right turn lanes that are set apart from the rest of the intersection. A slip lane allows a vehicle to make a right turn without having to enter the intersection. According to TxDOT, slip lanes “reduce overall traffic delay and allow higher-speed right turns.”33 This again shows that increasing average vehicle speed is the goal. Remarkably, in the same highway design guidance, TxDOT states that “slip lanes can also encourage higher-than-intended speeds and create conflicts among cars, pedestrians, and bicyclists.”34 This is putting it mildly; slip lanes pose a grave danger to pedestrians.
As part of its “Be Safe. Drive Smart.” campaign, TxDOT encourages drivers to “reduce your speed when approaching crosswalks and stop for pedestrians.”35 This is sound advice, but design speaks louder than words—and TxDOT’s design at Stassney Lane is intended to slingshot cars making right turns at high speeds, creating a severe safety risk for any pedestrian trying to walk through the corridor.
A recent safety review by the City of Austin found that 64 percent of pedestrian fatalities occur on roads with a speed limit of 45 miles per hour or higher.36 TxDOT is purposefully designing roadway elements that will produce the very vehicle speeds found to be most deadly to pedestrians. If TxDOT were serious about encouraging nonmotorized users, it would implement changes designed to increase safety—such as eliminating the slip lanes, reducing crossing distances by extending the sidewalk closer to the travel lane, and slightly elevating the pavement within the marked crosswalk—rather than introduce slip lanes.
A large gap between the main Stassney Lane bridge and the turnaround bridges on either side
The turnaround bridges enable cars traveling on the I-35 frontage roads to cross over the interstate and change direction without having to go through the intersection. The gap that exists between the bridges allows high-decibel noise from the interstate below to come up to where pedestrians are walking. At first, highway noise may not seem like an important issue since it does not affect pedestrian safety, and for someone traveling in a sound-insulated car, this gap hardly registers. But noise matters: It makes the pedestrian space more hostile and unpleasant for a person walking over the bridge, reducing the likelihood that someone will choose to walk.
A narrow bike lane
Anyone attempting to cycle over the Stassney Lane bridge will have to contend with vehicles traveling at high speeds and in close proximity. TxDOT’s stated purpose for the project is to reduce vehicle delay by increasing vehicle throughput each hour. More vehicles traveling at higher speeds do not create a safe or pleasant environment for cycling, regardless of the presence of a painted line indicating a bike lane.
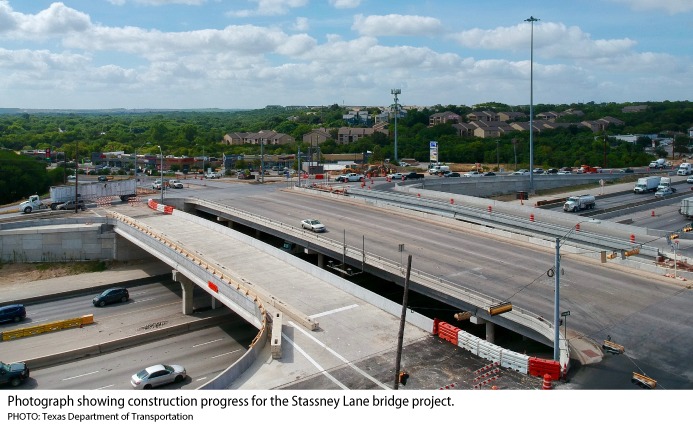
Space and human-scaled design
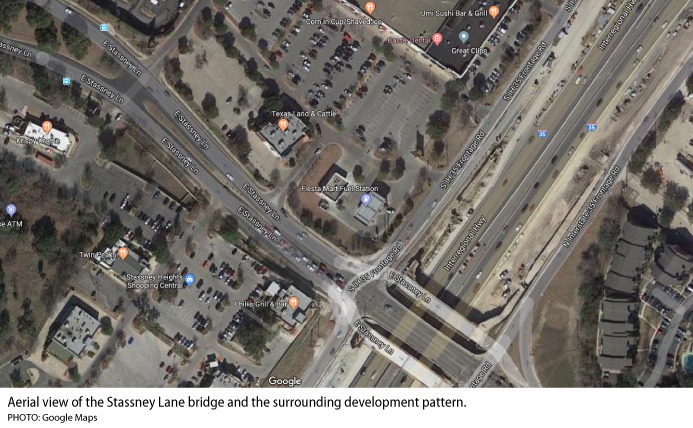
The photo above shows the Stassney Lane bridge project nearing completion and makes clear that this space is intended for cars—not pedestrians or cyclists. The more inviting digital rendering gives way to the reality of a lot of concrete intended to move cars. Additionally, the photo shows that the surrounding land use is low density and similarly designed to move and store cars. On the far side of the bridge is a traditional strip commercial development with businesses set back from the street to allow for ample surface parking. Any pedestrian that tries to reach one of these businesses will first have to negotiate vehicles entering and exiting the parking lots and the parking lots themselves.
The Austin long-range plan states that “[e]very year our region suffers injury and loss of life due to crashes involving motor vehicles, pedestrians, and bicyclists. The TPB affirms that even a single loss is one too many, and makes safety its guiding principle.”37 This is a praiseworthy goal. Unfortunately, the reality of the built environment does not match the region’s stated intentions.
According to TxDOT, the Stassney Lane complex of upgrades costs a total of $78.8 million.38 These dollars could have purchased a great deal of meaningful pedestrian improvements. A recent audit by the city of Austin found that there are 2,580 miles of roadways that lack a sidewalk and that “the Sidewalks Division does not have enough funding to build all missing sidewalks or even all of the highest priority ones.”39 The average cost of installing 1 mile of sidewalk in Austin is approximately $750,000,40 meaning that the money for the Stassney Lane complex of projects could construct more than 100 miles of new sidewalks.41
In addition to improving overall safety, prioritizing sidewalks and other nonmotorized facilities would have profound social equity implications. In a recent safety report, the city of Austin found that “[m]inority communities, non-English speaking communities, and lower-income communities have higher rates of serious crashes than other groups.”42 Walking and cycling are often thought of as a casual recreational activity or something predominately for children. However, Austin’s review also found that high crash rates involving pedestrians and cyclists were concentrated in census tracts “associated with lower rates of car ownership, higher transit ridership, and more people walking or biking to work.” For these residents of Austin, walking, biking, and taking transit is an essential part of daily life necessary to access jobs, health care, and other critical services.
Regrettably, TxDOT has chosen to shave a few seconds of wait time off the average driver’s commute as they travel through the Stassney Lane intersection. This time savings represents a vanishingly small improvement for drivers but a much larger lost opportunity for residents who face daily danger as they bike, walk, and take public transit. Until vehicle capacity and speed no longer serve as the measures by which transportation projects are judged, they will continue to dominate future project selection decisions.
Conclusion
Loud and unsafe spaces that are built for cars will not attract pedestrians, cyclists, and public transit riders, as evidenced by the Stassney Lane project. Achieving meaningful mobility choice and building sustainable, inclusive communities require substantially deeper changes to the transportation and land use systems. To that end, planners should prioritize improvements that make it cheaper, safer, and more pleasant to walk, bike, and take transit, and state and local governments must adopt plans that will reduce both overall and per capita driving.
Kevin DeGood is the director of Infrastructure Policy at the Center for American Progress.