Introduction and summary
Government spending through the tax code has flourished in the years since the Tax Reform Act of 1986, which significantly reduced the cost of a large number of tax breaks. In 2019, the federal government will spend roughly $1.6 trillion through special provisions of the tax code, called tax expenditures,1 up from an inflation-adjusted $600 billion in 1988—more than a trillion-dollar difference.2 Yet, as detailed later in this report, tax expenditures receive little direct oversight in the budget process, and many are poorly targeted to the goals they claim to achieve. As a result, the tax code contains many tax expenditures that do not achieve their stated claims, are unfairly skewed in favor of higher-income taxpayers, or both.
This report will review the status of individual tax expenditure policy in the aftermath of the December 2017 tax law, known as the Tax Cuts and Jobs Act (TCJA). After providing a brief review of the theory around tax expenditures, it will use specific examples to explain how the structure of individual income tax expenditures, as amended by the TCJA, affects their cost and who benefits, as well as how some tax expenditures are ineffective, with their underlying goals best not pursued through the tax code at all.
The Congressional Budget Office estimates that the TCJA will reduce revenues by $1.9 trillion in the first 10 years following its enactment.3 After including this cost, it estimates that the nation’s debt will reach 144 percent of GDP by 2049—and much more if the many temporary provisions of TCJA are made permanent.4 Much of the tax cut from the TCJA—which was achieved in part through new tax expenditures—will benefit the wealthy: The Tax Policy Center estimates that in 2025, taxpayers with incomes of $1 million or more will see a nearly 3 percent increase in their after-tax income as a result of the new law, while those making $50,000 or less will have an increase of 1 percent or less.5 Tax expenditures play a significant role in this outlook. Thus, now is a good time to shine a light on this hidden form of spending, especially where it provides costly and unnecessary benefits to high-income taxpayers.
Tax breaks are government spending and should be treated as such
Tax expenditures are special provisions of the tax code that allow taxpayers to exclude a specified amount from gross income, deduct that amount from income, or credit that amount against the final taxes owed. Alternatively, they may offer the taxpayer preferential tax rates on certain types of income or the ability to defer tax payments until a later date. Regardless of the form they take, tax expenditures apply only to taxpayers with certain characteristics or who engage in certain activities.6
Importantly, tax expenditures are functionally the same as direct government spending. For example, from a budget perspective, it makes no difference whether taxpayers are allowed to lower their taxes by deducting the amount of interest they paid on a home mortgage or whether the government simply provides a check to homeowners for a percentage of mortgage interest paid in a given year. Both approaches effectively increase government spending and thus must be offset by increases in other taxes, reductions in other government spending, or increases in government debt. For this reason, it is just as important to be transparent and responsible with tax expenditures as with direct government spending.
Unfortunately, such transparency and responsibility are not the norm. Tax expenditures receive much less scrutiny in the budget process than do most government spending programs. They are easier to enact, since they are often characterized as tax cuts rather than increases in government spending. Once enacted, they are rarely reviewed to see if they are achieving intended goals and are difficult to repeal, because those who benefit from them often become a potent political obstacle.
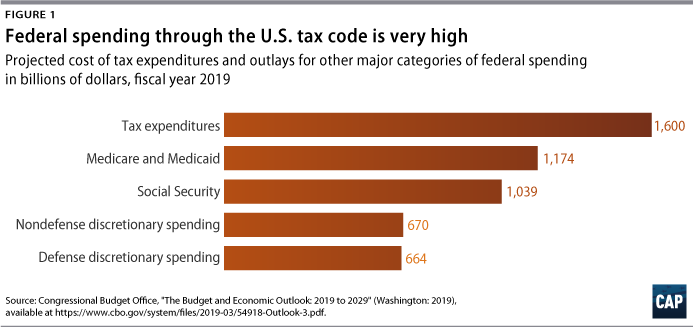
As of this year, there are approximately 200 tax expenditures in the federal budget.7 For each tax expenditure, the U.S. Congress Joint Committee on Taxation and the U.S. Department of the Treasury’s Office of Tax Analysis estimate the change in taxes owed if the tax break were eliminated. While a number of factors can affect the tax expenditure estimates, summing up the estimates provides an idea of the magnitude of this form of government spending and allows them to be compared with federal outlays for other spending programs.8 (see Figure 1) According to the Tax Policy Center, nonbusiness tax expenditures alone will reduce tax liabilities by $1.2 trillion in 2019.9
Absent political considerations, many tax expenditures would not stand up to scrutiny and would be repealed as ineffective giveaways to special groups of individuals or corporations. If proposed as direct spending, they would not pass. The public would be unlikely to favor providing billions of dollars a year in direct federal grants to hugely profitable oil and gas companies, for example. Yet, every year, the federal government provides billions of dollars in tax breaks, some of which have been in the tax code for decades, to the petroleum industry. It is no surprise that many of these firms contribute heavily to political campaigns.10
At the same time, some tax expenditures promote widely supported public policy goals, such as retirement security, college affordability, and charitable giving. It turns out, however, that even well-intentioned tax expenditures may be unfair or fail to reach intended beneficiaries if structured poorly.
The TCJA failed to eliminate many widely criticized tax expenditures for the wealthy and businesses, such as the infamous carried interest loophole that allows Wall Street fund managers to pay special low tax rates and the so-called stepped-up basis rule that allows the wealthy to pass appreciated assets to their heirs without having to pay income tax on the gain in value that accrued during their lifetime. The TCJA also added several costly tax breaks that largely benefit wealthy taxpayers, such as the Opportunity Zone tax incentives and the new pass-through business deduction. In addition, the new tax law failed to make many needed improvements to existing tax expenditures that have broad support, some of which are highlighted later in this report.
The TCJA reduced the overall cost and regressivity of some individual tax expenditures. However, this occurred in part because the law lowered the top marginal tax rate, which means that high-income individuals receive less in tax savings from tax deductions but also pay lower taxes overall.11 Moreover, any positive effects of the individual income tax expenditure changes in the law are overwhelmed by the TCJA’s enactment of new tax expenditures skewed to the wealthy, as well as by the high cost and regressive impacts of the structural changes in the law, such as the reduction in the top individual income tax rate; the slashing of the corporate income tax rate; the gutting of the estate tax; and the substantial increase in the exemption from the individual alternative minimum tax. Ironically, the very purpose of the alternative minimum tax is to place a limit on the extent to which the wealthy can reduce their taxes through the use of tax breaks. Altogether, in 2025 when the TCJA individual tax changes are fully phased in, the structural changes and new tax expenditures will provide the largest benefit to high-income taxpayers. Those making more than $1 million will get an average tax cut of nearly $70,000, but filers making less than $100,000 will have an average tax cut of only $453.12
The new tax cuts for the wealthy in the TCJA, however, came on top of tax code changes over the past few decades that already favored the wealthy. Income from ownership of capital assets already received preferential rates; taxes on gains in the value of assets could be deferred if the assets were not sold or potentially avoided through the use of loopholes and careful tax planning; and the estate tax already had been weakened substantially, to name a few examples. These earlier changes to the tax code contributed to the high level of income and wealth inequality in the United States today.13 As incomes at the top have soared, the wealthy have been able to keep a larger share of their gains than they could when marginal tax rates were much higher in the 1970s and earlier.14 Indeed, many of the tax code changes have been structural, such as the lowering of top marginal income tax rates and the weakening of the estate tax. But tax expenditures have also played a significant role in helping the wealthy grow their wealth; their role is arguably more insidious due to the lack of oversight and transparency around spending through the tax code.
The structure of tax expenditures affects cost, efficiency, and fairness
With income and wealth inequality approaching historically high levels, it is particularly important to consider whether tax expenditures are appropriately targeted. The structure of a tax expenditure largely determines who benefits from it and thus how efficiently the provision achieves its goal—whether its cost is successfully targeted at the intended beneficiaries or squandered on those who do not need special treatment.
When tax expenditures are structured as deductions or exclusions, rather than as tax credits, their benefit will tend to be skewed in favor of the wealthy since the value of the deduction or exclusion is dependent upon the tax rate bracket. In other words, taxpayers in higher tax brackets receive a larger benefit from the deduction since they are avoiding more tax per dollar of income.
Over the long term, tax expenditures that are poorly targeted represent missed opportunities to fulfill unmet needs, such as infrastructure improvements, education, and job training. The concern is even greater in the wake of the TCJA, which further skewed the tax code toward the wealthy and corporations. Tax expenditure dollars should be targeted toward the most important public priorities for broadly shared prosperity and economic security.
The following discussion focuses on several popular tax expenditures that have been in the tax code for decades but fail to reach some of the intended beneficiaries due to structural flaws. Some of these expenditures are also wasting tax dollars on higher-income taxpayers who do not need the extra tax benefit. Although the TCJA made a few improvements, the new tax law largely failed to include reforms needed to better target these tax provisions so that the intended beneficiaries can access them while ensuring that higher-income taxpayers cannot. In some cases, the new tax law further skewed the provisions in favor of those with higher incomes.
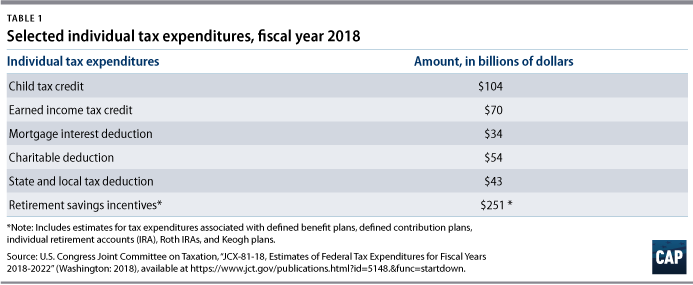
The first five sets of tax expenditures discussed in this section include the two companion tax credits for working taxpayers and families, the earned income tax credit (EITC) and the child tax credit (CTC); the mortgage interest deduction (MID); the deduction for charitable donations; the deduction for state and local taxes (SALT); and the tax incentives for retirement and saving. Table 1 shows the cost of each of these tax expenditures in fiscal year 2018. Given their cost, it is important that each is appropriately targeted to achieve its intended goal.
Child tax credit and earned income tax credit
The CTC and the EITC are key elements of U.S. policy to reduce poverty among working families and their children. In 2017, as a result of these two provisions, 29.1 million people were either lifted out of poverty or made less poor, including 12.5 million children.15 In general, these tax credits are better targeted toward their intended recipients than are tax expenditures structured as exclusions and deductions. They include the following features:
- As tax credits, they reduce tax liability equally for all who qualify.
- When a taxpayer’s tax bill is too small to get the full benefit of the credit, the IRS will pay them all or part of the difference through a refund.
- These provisions are phased out by income level so that high-income taxpayers who do not need them cannot access them.
The TCJA’s changes to these important tax expenditures were a mixed bag. Unfortunately, the CTC was expanded in the tax law to reach many families at higher incomes, while missing the opportunity to meaningfully help many lower-income families who do not get the full benefit from the credit. In addition, although the TCJA increased the CTC from $1,000 to $2,000 for each child, that increase overstates how much the new law benefits families, because it also eliminated personal and dependent exemptions.16
The TCJA increased the income level at which the CTC begins to phase out from the pre-TCJA level of $110,000 to $400,000 of adjusted gross income for couples in 2018, the first year TCJA was effective. Newly eligible families making $400,000 with two children received a $4,000 credit in 2018.17 But for low-income working families with insufficient tax liability against which to take the credit, the law limited the amount of the CTC they can receive through a refund to $1,400, and it only slightly lowered the income level at which the CTC begins to phase in. Thus, the law left 10 million children under age 17 in low-income working families with either no CTC increase or a token increase of $75 or less.18 The law also eliminated the CTC for the families of millions of children who lack Social Security numbers—mainly Dreamers.19 Rather than expanding the CTC to higher-income families, the law could have used the revenue to better target CTC improvements to lower-income families.
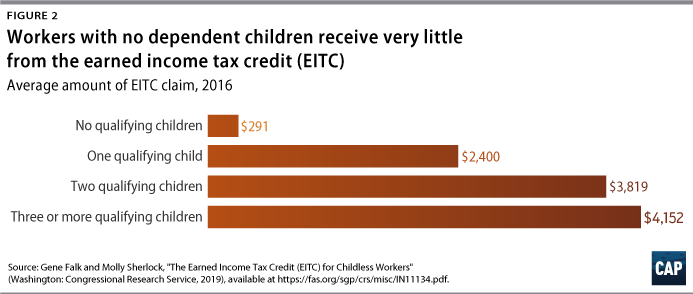
The TCJA also missed an opportunity to improve the EITC as it applies to working single adults with no dependent children—a group that includes noncustodial parents. In fact, the law’s changes to the tax code’s inflation adjustment will slowly reduce the value of the EITC over time. Aside from the change to inflation adjustments, the TCJA made no change to the EITC for workers without dependent children, whose maximum credit in 2019 is only $529, compared with $3,526 for a taxpayer with one child.20 Research has shown that the EITC increases recipients’ participation in the labor force and reduces poverty.21 Increasing the EITC for workers who are not raising children is an idea that has received support from lawmakers of both parties in the U.S. House of Representatives and U.S. Senate but was regrettably left out of the TCJA.22
Mortgage interest deduction
The MID, along with the charitable deduction, the SALT deduction, and a handful of others, are known as itemized deductions. Taxpayers can either take the standard deduction or itemize. They generally take these itemized deductions if the total amount of itemized deductions exceeds the standard deduction. The TCJA temporarily increased the standard deduction from $6,500 to $12,000 for singles and from $13,000 to $24,000 for couples for 2018, still indexed annually for inflation, then reverting to pre-TCJA amounts after 2025.23
Because it takes a much larger amount of itemized deductions to exceed this new temporary standard deduction, far fewer people will itemize, preferring instead to take the larger standard deduction. Those who do itemize are likely to be higher-income people who would tend to pay more in state and local taxes; have more expensive homes and thus larger mortgages; and have the capacity to make larger charitable contributions.
The MID has always been skewed to higher-income taxpayers because it is structured as a deduction, which gives a larger tax benefit per dollar of deduction to higher-bracket taxpayers—taxpayers who also tend to purchase more expensive homes. At a cost of $163.2 billion over five years,24 the MID is the largest U.S. housing subsidy. This is true even after the TCJA lowered the cap on the size of the mortgage on which interest payments may be deducted, decreasing it for new loans from $1 million to $750,000 of mortgage debt.25 Yet, the Joint Committee on Taxation projects that, in 2024, households with less than $100,000 of income will receive only about 11 percent of the total tax benefit, compared with 14 percent before the TCJA change.26 Thus, the TCJA reduced the total cost of the MID but succeeded in skewing it further toward higher incomes.
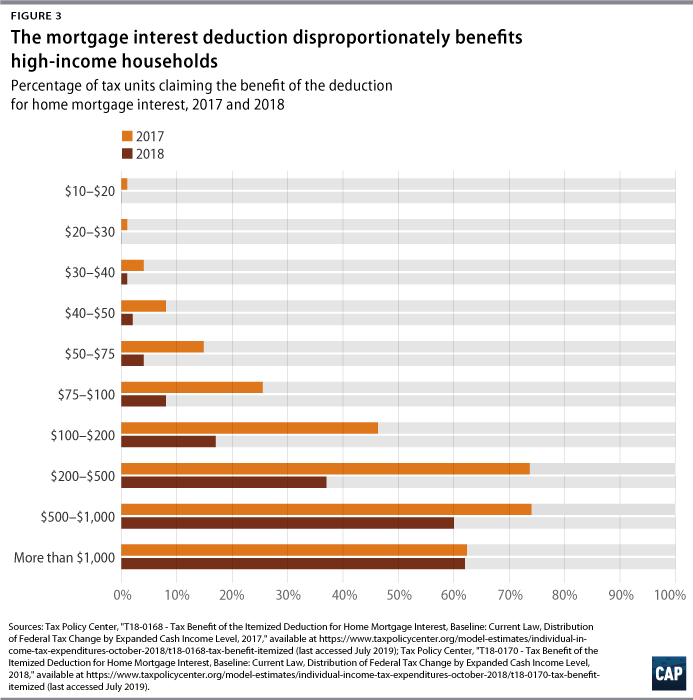
Ironically, while the MID is intended to improve wealth accumulation by encouraging homeownership, it does not provide much help to those who need it most. It now benefits only about one-tenth of all households, the vast majority of whom are relatively high income.27 (see Figure 3)
Policymakers could repeal the deduction and channel the subsidy toward direct housing assistance to low- and middle-income families. Alternatively, they could turn the subsidy into a tax credit targeted toward families who need it most by, for example, limiting the amount of the credit and the size of mortgage loan eligible for the credit. The net effect of transforming the deduction to a credit in this manner would be to trim the amount of benefit that goes to higher incomes—resulting in lower tax spending—and to enable lower-income homeowners to access the subsidy even if they take the standard deduction, thereby expanding the number of lower-income people who could access this tax expenditure.
Charitable deduction
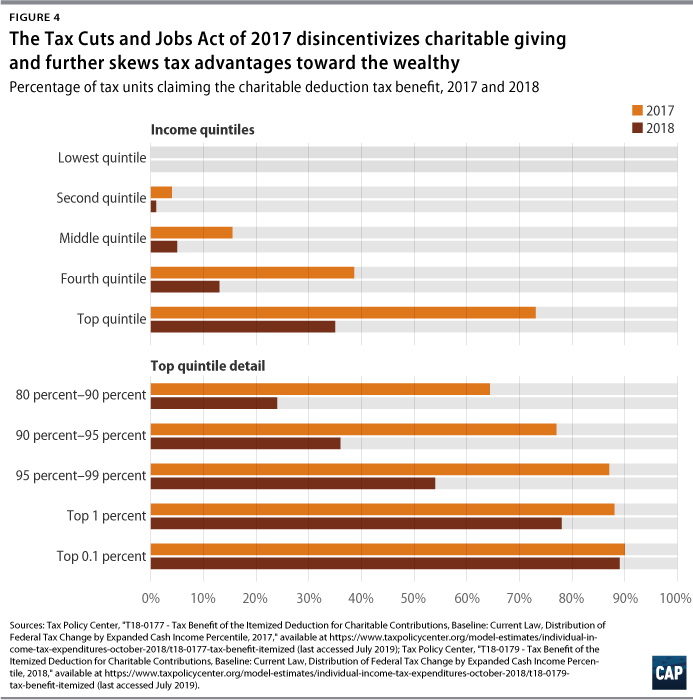
The TCJA reduced the value of the deduction for charitable contributions in two ways. First, the reduction in top marginal tax rates means that the tax savings for high-income taxpayers is lower. In addition, as mentioned above, the combined effect of the increase in the standard deduction and the reduction in selected itemized deductions means that fewer taxpayers will itemize. The Tax Policy Center has estimated that the law will cause the number of households who claim the charitable deduction to drop from 36 million to 15 million.28 The projected decrease in itemized charitable deductions is greatest among middle-income taxpayers, since many more of them will now take the standard deduction. In other words, the share of households participating in this charitable giving incentive will drop from 21 percent to 9 percent—and most of those still claiming the deduction will be high-income households.29
The charitable deduction was designed to promote broad-based philanthropic activity but is now much more top-heavy than before the 2017 tax law, and early evidence is showing that it is likely to reduce charitable giving.30 This raises significant concern that future philanthropy will more strongly reflect the preferences of the wealthy.31
The TCJA exacerbated a long-standing problem with the charitable giving deduction: It provides a larger reward for charitable giving to those who are wealthier. Because it is structured as a deduction, donors who fall in higher tax brackets receive more relief from tax than do those in lower tax brackets, assuming the latter continue to make itemized donations. Roger Colinvaux, professor of law at Catholic University’s Columbus School of Law, explains that for a $1,000 gift, a taxpayer’s tax break could be $370, $320, $220, $120 or $0, depending upon their tax bracket and, again, whether they itemize at all.32 He also points out that the amount of the credit would vary over the years as changes in the tax rates are enacted.
Assuming there is broad support for maintaining a charitable giving incentive, policymakers could make it more widely available by transforming it into a tax credit, available regardless of whether or not the taxpayer itemizes, so that all taxpayers are treated equally.33 To avoid administrative complexity for very small donations and to reduce the revenue loss, the credit could apply to donations that exceed a specified percentage of the taxpayer’s adjusted gross income.34
State and local tax deduction
The SALT deduction is a long-standing provision of the federal tax code. It allows a deduction for taxes an individual pays to the state and locality where they live. In effect, the federal government subsidizes states and localities that provide more services to their residents, which tends to reduce the amount of federal direct spending needed in those areas. Studies show that citizens in states with higher taxes generally draw fewer resources from federal programs, such as those for low-income food assistance and Pell Grants.35 Some tax scholars argue that the SALT deduction is necessary for measuring income correctly, since people have no choice whether to pay taxes.36
Whatever the policy rationale for the SALT deduction, by definition, the deduction is skewed to high incomes; those with higher incomes avoid more tax per dollar of deduction, are more likely to exceed the threshold for itemizing, and will have higher income and property taxes to deduct.
The TCJA limited the overall cost of the SALT deduction. It capped the deduction at $10,000 and, by nearly doubling the standard deduction, will reduce the number of itemizers and hence the number of taxpayers who will take the SALT deduction. The TCJA reduced the value of the SALT deduction significantly for higher-income taxpayers, although, overall, those taxpayers saw the largest average tax cuts from the tax law.
Reinstating the SALT deduction would be extremely costly and regressive. Yet, if policymakers wish to continue the federal tax subsidy for state and local taxes for whatever policy reason, they could reform it to make it more equitable. Again, changing it into a tax credit available to itemizers and nonitemizers alike would make it fairer. Then, capping the amount of the credit—such as allowing only a percentage of state and local taxes to be credited against federal taxes—would limit the cost of the provision.
Retirement savings incentives
At a cost of $251 billion in 2018 (see Table 1), the federal tax incentives for retirement saving are a classic example of costly spending through the tax code that largely fails to achieve its goal—in this case, enabling working people to set aside adequate funds for retirement.
Since the 1980s, retirement saving vehicles for working Americans have shifted from traditional pension plans that provide defined benefits upon retirement to an array of tax-subsidized retirement vehicles that require contributions.37 Workers especially are expected to contribute, but there also may be contributions from the employer. Under these plans, the amount of benefits is uncertain and depends upon factors beyond the individual’s control. These defined contribution plans include employer-sponsored deferred compensation accounts—known as 401(k) accounts for the tax code section that permits deferral of tax on account balances—as well as individual retirement accounts (IRAs) that individuals set up on their own. These contribution-based accounts are higher risk, because they do not guarantee specific benefits and depend on investment outcomes. Thus, savings must be increased to reflect these risks and ensure that there will be adequate funds at retirement. And management fees can substantially diminish savings over time.
Tax-qualified accounts can also function as tax shelters for the wealthy. A 2014 Government Accountability Office analysis found that 314 taxpayers had accumulated balances of more than $25 million in their IRA accounts in 2011, the most recent year for which data were available at that time.38 Another 791 individuals had accumulated between $10 million and $25 million in their IRA accounts.39 Meanwhile, many groups of people—disproportionately lower-income, Black,40 Hispanic, noncollege-educated, and unmarried Americans—have very low or no savings at all in retirement accounts.41 Retirement plan participation has actually declined since 2001.42 The percentage of private sector workers with access to any kind of employer-sponsored retirement plan is now less than 50 percent.43 And among those who do save in a work-based plan, most are not meeting targeted retirement savings goals even under the most optimistic assumptions.44
Yet, America’s approach to retirement incentives—largely based on tax subsidies—is very expensive. The tax expenditures that are intended to encourage retirement saving will reduce federal tax receipts by roughly $1.4 trillion over the next five years.45
The TCJA made several changes to the tax treatment of retirement benefits but failed to make structural reforms to better target retirement savings incentives to those who need them. While broader reforms to retirement policy are needed, there are simple steps policymakers could take to improve the existing tax incentives to make them fairer and to increase retirement savings across a broader range of American workers. For example, the saver’s credit available to lower-income taxpayers could be made fully refundable.46 The cost of this measure could be offset by limiting retirement savings tax incentives among higher-income taxpayers, especially those who already have more than enough savings. Those individuals are free to continue saving more, but the federal government should not subsidize their further wealth accumulation.
In general, trickle-down tax incentives are inefficient and invite tax avoidance
The EITC and the CTC discussed above are examples of tax expenditures that largely achieve their goals. Although they could be improved, each reaches the targeted populations in a direct and relatively efficient manner.
From time to time, however, lawmakers seek to provide tax incentives for businesses or investors as a way of encouraging them to indirectly provide benefits to employees or other targeted persons or purposes. Unfortunately, this indirect or trickle-down approach frequently leads to tax avoidance behaviors by investors or businesses who may only be interested in the tax break. In addition, these types of tax incentives are often an inefficient means of accomplishing the policy goal.
The TCJA added two such trickle-down tax expenditures to the code. One is a temporary business tax credit for employers who offer qualifying paid family and medical leave to their employees.47 This unfunded tax credit is a relatively inefficient and ineffective way to meet the widespread and critical need for all workers to take leave when necessary to care for family members or for a significant medical procedure. While temporary—it is only available for the 2018 and 2019 tax years—it will cost $4.2 billion.48 Because the business does not benefit from the credit until the following year when they file their tax return, and because the credit amount is at most 25 percent of wages paid for workers on leave,49 this tax credit may be too poorly timed and insufficient to encourage many new businesses to provide new coverage. And employees may still face serious financial hardship if they only receive half of their wages or salary and if they only get two weeks of paid leave—the minimum required under the new tax credit. Finally, the tax benefit is likely to provide a windfall tax break to the employers who already provide paid leave to their employees—costing revenue without increasing paid leave coverage.50 This phenomenon, where a tax cut benefits taxpayers regardless of whether or not they increase the desired behavior, is sometimes referred to as “buying out the base.”51 The United States is the only advanced economy that does not guarantee workers access to paid leave, leaving it to each employer to decide whether and how much to offer.52 Because every worker will face circumstances at some time or another that will require them to take leave, a better approach would be a comprehensive program to provide guaranteed paid leave to any worker who needs it, funded through a public insurance program.53
Another new trickle-down tax incentive enacted in the TCJA is the Opportunity Zone program, which provides generous tax benefits to private investors who invest in so-called Opportunity Zone Funds, which in turn must invest most of their capital in specified areas across the country. The stated goal of the program is to spur economic development in low-income neighborhoods by encouraging private capital to flow to those areas.54 It is part of a long tradition of using tax breaks to spur economic development in low-income communities, even though there is little evidence that these programs have resulted in a net increase in aggregate economic development.55
The tax benefits to wealthy investors under the Opportunity Zone program are substantial and unlimited. Investors can receive a tax deferral and tax reductions if they roll unlimited amounts of capital gains they have from other investments into an Opportunity Zone Fund—and the subsequent gains on investments in the fund are tax free if held long enough.56 However, there are no requirements at all that investors measure or demonstrate the professed social outcomes or ensure that people already living in the affected communities will have greater job opportunities or have a say in the changes to their communities. Furthermore, independent experts have shown that several zones selected for the program already were in the process of gentrification,57 meaning that no tax incentives were needed to attract investors—again, “buying out the base.”58 Worse, the lax rules surrounding the program could mean that the tax breaks can even reward investments that result in many low-income families and small businesses being displaced from their communities rather than sharing in any economic benefits.59
At the time of the enactment of the TCJA, the congressional Joint Committee on Taxation estimated that this tax incentive program would cost $1.6 billion over a 10-year period. It remains to be seen whether that estimate will hold or grow much larger.60 But even at the current estimated cost, the dollars likely could have been more efficiently and effectively invested directly in distressed communities through public investments or through existing investment structures, such as community development financial institutions, which have a long track record of working directly with communities on effective development projects.
Conclusion
Federal government spending through the tax code to achieve a variety of policy goals is not, per se, wrong or right. Rather, it should be subject to regular review to assess cost, efficiency compared with other approaches toward achieving the same goal, and fairness. As the many examples above demonstrate, the TCJA made a few improvements but largely failed to meaningfully alter the skewing of tax expenditures toward the wealthy. Existing tax spending on individuals could have been made much fairer and more efficient while potentially decreasing the overall cost of this form of spending. At the same time, the Opportunity Zone program enacted in the TCJA is a reminder that it seldom makes sense to provide tax incentives to the wealthy in hopes that they will accomplish indirectly what public investment could have achieved more efficiently in a more direct manner. In light of growing income and wealth inequality, it is more important than ever for policymakers to assess these tax expenditures and make improvements that will better achieve the desired goals and reduce wasteful spending on those who do not need it. In the long run, policymakers should consider process reforms that would explicitly require pre- and post-enactment review of the cost and impact of tax expenditures.
About the authors
Alexandra Thornton is the senior director of Tax Policy for Economic Policy at the Center for American Progress.
Sara Estep is a research assistant for Economic Policy at the Center.
Acknowledgments
The authors would like to acknowledge the contributions of Seth Hanlon and Galen Hendricks.