On everything from bumper stickers to t-shirts, Texans often proudly boast that, “Everything is bigger in Texas.” Unfortunately, this claim also frequently applies to highway congestion. In 2012, a company called Texas Central Partners LLC (TCP) formed with the goal of privately financing and constructing an approximately 240-mile high-speed rail line between Houston and Dallas.1 TCP’s plan calls for trains to reach speeds in excess of 200 miles per hour. This would result in a run time of roughly 90 minutes, providing a potentially attractive alternative to both highway and air travel.2
The scale of the proposed high-speed line along with the location of terminal stations will affect regional travel and economic development patterns in Houston and Dallas for decades to come. Importantly, TCP must construct and operate a rail line that generates enough revenue to repay its debt obligations and provide a return to equity investors. This means that TCP must carefully design the line and terminal station locations to maximize ridership without incurring excessive cost. However, TCP’s need to control costs may result in terminal station locations that are suboptimal from a broader public policy perspective. This raises an interesting question: Should the public sector invest in an otherwise privately financed facility to purchase better station locations that support more compact and sustainable land use—something that would not make financial sense for TCP?
Houston and Dallas regions
According to Texas Central Partners, the total cost of construction and acquisition of train sets would be roughly $16 billion.3 TCP intends to privately finance the project through a combination of debt and equity.4 Once TCP has cleared all regulatory, environmental review, and permitting hurdles, the firm will close on project financing. Debt financing may include a loan from the federal government either through the Transportation Infrastructure Finance and Innovation Act or the Railroad Rehabilitation and Improvement Financing program.5 TCP intends to repay project financing principally with revenues generated by ticket sales.6
To understand the basis for TCP’s business model, it helps to look at the two metropolitan areas that would be connected by the line. From 1970 to 2017, the population of the Houston metropolitan area grew from 2.1 million residents to 6.8 million residents, for an average annual growth rate of 2.5 percent.7 Similarly, the Dallas-Fort Worth area grew from 2.4 million residents to 7.4 million residents, or 2.4 percent per year, over the same time period.8 By comparison, the average annual growth rate of the United States during these same years was just 1.3 percent.9 This difference may not seem like a lot, but in demographic terms, Houston and Dallas have experienced dramatic growth over a long period of time. These trends are expected to continue.
Additionally, the median household incomes for Houston and Dallas-Fort Worth are $61,000 and $61,300, respectively.10 The median household income for the United States is $55,300, or approximately 12 percent lower than each of these two regions.11 Perhaps unsurprisingly, the combination of above average wealth and rapid population growth has produced intense highway congestion in both regions. According to INRIX, a transportation data firm, Dallas and Houston ranked 14th and 24th, respectively, on a global index of traffic congestion in large cities for 2016.12 TCP’s own research shows that driving between Houston and Dallas on Interstate 45 can range from 3.5 hours to 5.5 hours, depending on traffic.13 When accounting for check-in, baggage, and security, total travel times for flying between Houston and Dallas have similar durations.14 Continued population growth will likely lead to additional roadway and aviation congestion in the future. TCP hopes to capitalize on these economic, demographic, and travel trends by offering a rapid, safe, and cost-competitive alternative to driving and flying.
Houston station
The choice of station location can affect both ridership and total project cost. All else being equal, consumers tend to choose products that are accessible and convenient over those that are isolated and inconvenient. Yet the station location that maximizes accessibility and convenience—and therefore, expected ridership—may prove cost-prohibitive for a private company. Assembling linear right-of-way and staging construction in dense urban areas is difficult and expensive. As a result, urban rail projects often require tunneling, which comes with a very high price tag. While not a direct comparison, recent commuter rail and subway tunneling projects in the New York region have costs ranging from $1.5 billion to $3.5 billion per mile.15 With per-mile costs potentially in the billions of dollars, it’s easy to understand why a company would look for station locations with lower land prices that do not require tunneling.
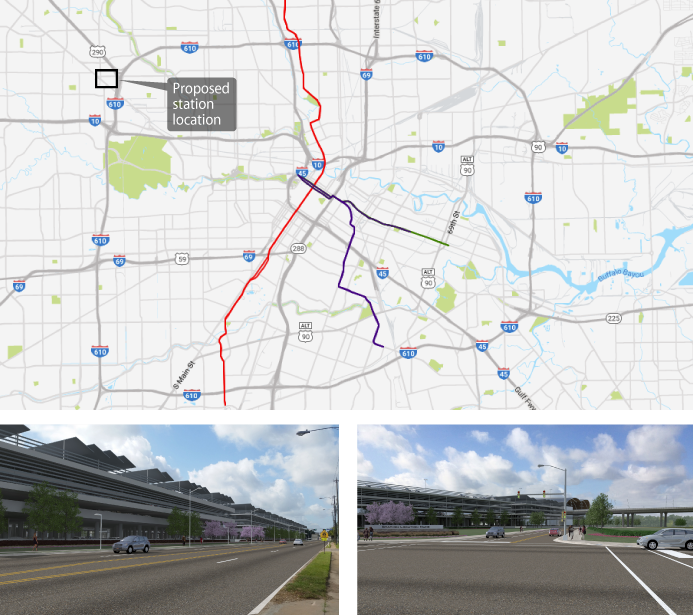
Top: Houston region and proposed station location far from rail transit
Left: Initial renderings of Houston station area
Map courtesy of Metropolitan Transit Authority of Harris County; renderings courtesy of Texas Central Partners
TCP recently released its preferred terminal station locations. In Houston, the firm has chosen a location on the west side of town at the intersection of U.S. 290 and Interstate 610.16 According to Google Maps, this location is approximately 8 miles from the central business district and the heart of the regional light rail system operated by the Metropolitan Transit Authority of Harris County (METRO).17 Currently, METRO offers local bus service to the area around the preferred terminal location, including three lines designated as high-frequency that arrive at 15-minute intervals.18 While important, this bus access is modest compared with the vehicle access provided by U.S. 290, I-610, and the nearby Interstate 10.
TCP’s initial renderings show a station designed for vehicle access with multiple, large parking structures. To a certain extent, this makes sense, as the proposed high-speed line will function as a regional facility, pulling passengers from the greater Houston area much like an airport. In fact, some passengers will likely come from neighborhoods beyond METRO’s service area. Yet one of the most valuable features of high-speed rail is its ability to fit within a dense urban environment in ways that an airport simply cannot. Unlike an airport, which needs lots of land and clear flight lines and generates huge amounts of noise, rail lines can fit within and underneath a downtown area. Locating the station far from downtown means that TCP’s design fails to leverage one of the most attractive and important characteristics of high-speed rail.
Importantly, these observations are not intended as a criticism of TCP’s station location decision or the city of Houston’s support for the project. No doubt TCP has run the numbers and determined that this location meets the twin mandate of maximizing ridership to the extent possible while also meeting cost constraints. However, it’s unlikely that TCP’s analysis factored in the positive social, environmental, or economic externalities that a more land-use-efficient location would produce but which the firm would be unable to monetize. In short, moving the station downtown would add to the project’s total cost while producing benefits that TCP could not capture. By comparison, the city of Houston—and the public sector more broadly—is not constrained by profitability and measures the success of investments across a host of unmonetized variables, including land use efficiency, connectivity of new development to the transit system, and the emissions performance of different growth patterns, among many others.19
Under the National Ambient Air Quality Standards, for instance, the Houston region is classified as being in nonattainment for ozone, meaning it exceeds federal air pollution limits. Ozone is a harmful pollutant that forms through a reaction involving sunlight, nitrogen oxides, and volatile organic compounds.20 The most recent measurements show that the region’s ozone levels are approximately 16 percent over the U.S. Environmental Protection Agency’s threshold.21 The long-range transportation plan produced by the Houston-Galveston Area Council (H-GAC) has set a goal of reaching attainment status for ozone under the Clean Air Act in the coming years.22 Achieving this goal will not be easy, as the region is expected to continue its robust growth.23
H-GAC has also set a related goal of reducing the share of commuting trips that are taken by residents driving alone. In other words, regional planners would like to increase the number of people who take transit, walk, or bike to work each day.24 Additionally, in September 2015, the city of Houston formally adopted a comprehensive plan that, among other goals, calls for “reduced consumption of natural resources” and “compact, pedestrian-friendly development around transit,” as well as the adoption of “policies that coordinate transit with supporting land development.”25
These diverse goals share a common thread: land use. Broadly defined, “land use” refers to the regulations, taxes, and other policies that guide the location, scale, and design of public and private infrastructure. Research shows that land use significantly affects travel behavior and by extension emissions and natural resource consumption, among other outcomes.26 In other words, it’s possible to measure the transportation choices people make and the environmental performance of different land use patterns.
A comprehensive study of U.S. and other global cities found that, “In contrast to city wealth, urban form, in particular higher urban density, is consistently associated with lower levels of car ownership and car use, higher levels of transit use, and lower total costs of operating urban passenger transportation systems.”27 Another study of U.S. cities found that, “Gasoline consumption per capita in ten large United States cities varies by up to 40 percent, primarily because of land use and transportation planning factors, rather than price or income variations.”28
Other research shows that increased urban density combined with mixed residential and commercial development can reduce vehicle miles traveled (VMT) by 15 percent.29 Additionally, residents that live in areas with high-quality public transit own substantially fewer vehicles and drive 10 percent to 30 percent fewer miles.30 Thus, regional air quality is not merely a function of promoting the adoption of advanced technologies such as hybrid and battery electric vehicles. Efficient land use and greater transportation choice both strongly affect mobile source emissions and air quality, not to mention other variables such as household transportation costs and equitable access to jobs and essential services.
The connection between efficient land use, transportation choice, and mobile source emissions is not new. For many years, METRO and regional leaders have implemented major transit projects with the goal of reducing single-occupant vehicle trips and improving air quality.31 In 2003, for instance, voters within METRO’s service area approved a referendum for a host of transit and roadway projects known as METRO Solutions.32
This program of projects included extending the light rail system to the southeast, connecting downtown with the University of Houston, among other commercial and residential areas. In 2006, as part of the environmental review process, METRO planners determined that in the absence of the rail extension, by 2025, the total number of daily vehicle trips within the southeast corridor would increase by almost 500,000, or 41 percent.33 And total VMT within the corridor would increase by 3.6 million, or 53 percent.34
METRO clearly articulated its goals for the rail line investment: “Transportation improvements in the Southeast Corridor must not degrade air quality and should strive to reduce mobile source emissions in the future.”35 Additionally, “Providing alternatives to single occupancy vehicle travel is a key ingredient in reducing mobile source emissions. Transportation improvements that promote transit and ride sharing contribute favorably towards cleaner air.”36 Finally, the rail extension, along with the other transit projects, reinforced one of METRO’s long-term regional goals: “Containment of sprawl.”37
Achieving more compact growth and cleaner air will not be easy. According to H-GAC’s most recent air quality conformity analysis, total VMT in the Houston-Galveston region is expected to increase by 52 percent, or more than 88 million miles per year, by 2040.38 Population estimates produced by H-GAC show rapid growth in the northwest portion of Harris County and into Waller County over the next roughly 30 years. By comparison, H-GAC projects relatively little growth in central Houston.39 H-GAC’s regional population growth projection played an important role in Texas Central Partners’ decision to locate its station northwest of downtown near several major highways.
However, H-GAC and TCP treat the regional population and driving projections as inevitable rather than as the product of public policy and infrastructure investment decisions. This creates a bit of circular logic: TCP’s station should be located to the northwest because the population is moving to the northwest—but the population is moving to the northwest in part because of the construction of major transportation facilities, including, potentially, TCP’s rail station.
The truth is that Houston’s future is not predetermined. With a combination of local, state, and federal funds, the region could implement policies and make investments that promote more efficient land use and a development pattern that reduces total driving. Just as the region decided to move in the direction of bus and light rail investments, so too could it invest public dollars to locate TCP’s station downtown.40 The future is not fixed.
Improving air quality is not the only compelling public interest in facilitating more dense and efficient land use. Houston is a very flood-prone region. Concentrating development within the existing urban core would help reduce the total acres of land that the Harris County Flood Control District and the U.S. Army Corps of Engineers must defend.41 The issue is not trivial, as major storms and hurricanes force water authorities to make real trade-offs.
As the Houston region grew rapidly in the 1980s, developers started building more single-family homes around the Barker and Addicks reservoirs on the west side of the city instead of within Houston’s core. The topography of the Houston region is such that water generally flows from west to east.42 The Barker and Addicks reservoirs provide critical storage to prevent or lessen flood damage along the Buffalo Bayou, which runs through downtown Houston before flowing into Burnet Bay.43
When Hurricane Harvey hit the area in 2017, the Army Corps chose to limit outflows into the Buffalo Bayou to try to protect downtown Houston.44 The Army Corps recognized that the value of existing commercial and residential development in downtown Houston was far greater than the value of homes that would be flooded around the two reservoirs. The Army Corps made a very difficult and imperfect but logical trade-off.45 Given this reality, it makes sense to direct as much future growth as possible downtown and to implement land use and investment policies that reduce the total amount of land that water agencies must defend.
Investing public funds to connect TCP’s high-speed line with the light rail system would help further regional goals while also strengthening the connectivity and usefulness of the transit network. Provided that public funds purchase public benefits that the market would otherwise fail to provide, the investment may be prudent.46
Dallas station
In Dallas, Texas Central Partners has chosen a more land-use-efficient location with better transit access. The station would sit just south of downtown and Interstate 30, running between a freight rail line and the Trinity River in an area known as Cedars.47 The Dallas Area Rapid Transit (DART) Red and Blue light rail lines stop at the Cedars station located along Belleview Street approximately a half-mile away.48 As with the Houston station, the initial renderings for the Dallas station show a high degree of vehicle access and large parking structures. However, the proximity to the Red and Blue lines will allow for more meaningful integration with the regional transit system.
While a strong location, the land use efficiency and connectivity of TCP’s Dallas station could still be improved. The hub for transit in Dallas is Dallas Union Station, which connects residents with bus, light rail, streetcar, Amtrak intercity passenger rail, and the Trinity Railway Express commuter rail service.49 TCP’s proposed station would sit approximately 1.3 miles from Dallas Union Station to the south.50 Connecting the high-speed line to Dallas Union Station would represent the complete integration of all regional transit modes in one location.51 Moreover, making this connection would not conflict with Mayor Mike Rawlings’ (D) “Grow South” initiative, which aims in part to extend downtown development south of I-30, including the Cedars area.52
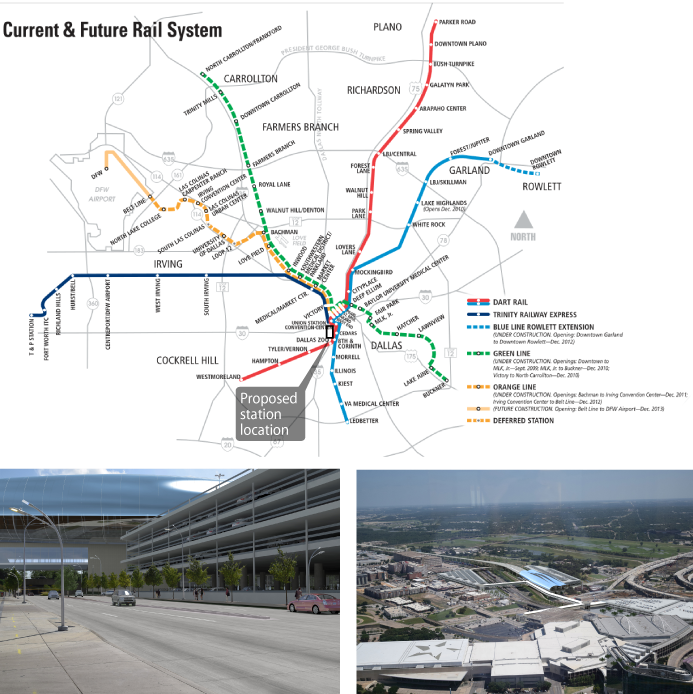
Top: Dallas region and proposed station location
Left: Initial renderings of Dallas station area
Map courtesy of Dallas Area Rapid Transit; renderings courtesy of Texas Central Partners
In 2006, the city of Dallas adopted its first comprehensive plan, called “forwardDallas!”53 The plan lays out a vision for regional growth that would, among other metrics, reduce per-capita vehicle miles traveled and increase transit ridership.54 For instance, the plan calls for increasing transit ridership during the morning and evening rushes by more than 40,000 trips per day.55 Additionally, the plan calls for reducing per-capita VMT by 21 percent, or 8 miles per day, compared with the trend forecast. In order to achieve this vision, the city of Dallas needs to capture a larger share of regional population growth. The result would be more residents living in higher-density neighborhoods with more transportation options. A key part of the vision is the need to “[p]romote Downtown Dallas as the regional urban center” and “[m]aximize development opportunities around DART stations.”56
Like Houston, the Dallas-Fort Worth metropolitan area is in nonattainment for ozone.57 The North Central Texas Council of Governments’ long-range transportation plan discusses at length the ways in which transportation investments affect development, air quality, and other environmental resources such as watersheds: “How and where the transportation system is built can negatively impact the environment.”58 The transportation plan also notes that growth in driving leads to reduced air quality: “As population grows, vehicle miles traveled (VMT) also increase, resulting in more vehicle emissions.”59 Finally, the transportation plan sets a bold goal: “All trips less than two miles in length in the urbanized area should have options available to be accomplished by non-motorized or transit modes of travel.”60 Integrating the high-speed line with Dallas Union Station would further the city’s long-range transportation, land use, and development plans and strengthen the overall transit system.
Politics and policy
In Texas, a state often hostile to the idea of using public money to build transit and passenger rail facilities, the fact that Texas Central Partners’ proposed line will be privately financed carries real political significance. Houston Mayor Sylvester Turner (D) stated recently that, “Another huge win for taxpayers is that the Texas Bullet Train is a private venture that receives no public funds.”61
For residents of Texas, the prospect of getting a free high-speed train line may provide the popular support needed to get TCP through the contentious process of assembling 240 miles of right-of-way through a grant of eminent domain provided to all railroads in the state.62 Injecting public funds into the project to improve station locations could upset the implicit political-economy bargain that TCP offers. Yet this concern should not derail a substantive conversation about the potential long-term benefits of more efficient station locations. In this instance, adhering to a bright-line distinction between public and private may produce a less effective facility.63
Houston and Dallas should not be expected to carry the financial burden alone. Both the state of Texas and the nation have compelling interests in advancing more sustainable metropolitan regions that offer robust options other than driving alone. For instance, research by Texas A&M University indicates that roadway congestion in Houston causes 203 million hours of delay each year, at a cost of $4.9 billion annually.64 In Dallas-Fort Worth, roadway congestion causes 186 million hours of delay at a cost of $4.2 billion annually.65
At the national level, the federal government acts as an explicit guarantor of private assets through the National Flood Insurance Program.66 Moreover, the federal government acts as an implicit guarantor of many public assets, appropriating billions of dollars to rebuild damaged infrastructure after natural disasters.67 According to reinsurance giant Munich Re, the direct economic losses from Hurricane Harvey totaled more than $85 billion.68 This issue brief is not suggesting that moving a train station would eliminate future economic losses from mega storms in the Houston region. But a downtown terminal would represent a major step toward a new growth model focused on building within the urban core and lessening the amount of future land that water authorities must try to defend.
Conclusion
Both Houston and Dallas have formally adopted plans that call for more efficient land use, cleaner air, and less intense use of natural resources, among other outcomes. These are not goals being imposed from outside but rather are the result of bottom-up planning processes driven by community participation in the face of sustained population growth, resource consumption, and worsening congestion. The question now becomes: What are the most cost-effective investments that the public sector at all levels can make to achieve these goals?
Texas Central Partners’ proposed high-speed line is a mega transportation facility that if completed would affect growth and travel demand in both regions for decades to come. If investing public dollars to secure more land-use-efficient station locations and bolster local transit systems would advance regional goals, then creating a public-private partnership may make sense.
If structured properly, a public-private partnership would allow investors to earn an appropriate risk-adjusted rate of return.69 Each sector would be able to achieve its own ends. The public sector would improve the environmental, social, and economic value of the high-speed line without crowding out private investment. At the same time, TCP would end up with a more integrated facility without being forced to shoulder the cost of positive externalities and public policy goals beyond the scope of a market transaction.
As with any public-private partnership, the public sector would need to determine that the investment was cost-beneficial. Moreover, public dollars should not be used to reduce investor risk or boost returns. Provided that public dollars are securing public benefits, a partnership could result in a better project than either sector could deliver alone.
Kevin DeGood is the director of Infrastructure Policy at the Center for American Progress.