Many Americans are dissatisfied with an economy that has been growing for more than six years now. Their disappointment reflects the fact that many economic gains—more jobs, higher wages, better benefits, rising living standards, and less poverty—are emerging very slowly or are nonexistent. The data show that there is a real possibility that economic growth will remain modest, rather than accelerate, for some time because productivity growth—the main driver of economic growth—is low by historical standards.
The slow-growing economy has left many middle-class Americans feeling economically insecure as they worry about massive future costs—such as paying off large amounts of student loan debt, buying a house, and saving for retirement—that are harder to cover when economic gains are slow. This economic insecurity is real and affects a large swath of low- and middle-income American families, but it is especially pronounced among communities of color, younger workers, and people with less education.
Not everyone is insecure in this economy, however. Rich Americans, especially those who receive substantial shares of their current income from the stock market, have done very well because corporate profits—and thus the stock market—have increased for most of the past six years.
The following data highlight three distinct policy goals for building a more inclusive economy. First, Congress and state lawmakers need to boost long-term economic growth. Second, policymakers at every level of government need to make sure that economic growth translates into commensurate economic gains. And third, policymakers need to emphasize targeted economic policies to help those who are most vulnerable in a slow-growth economy.
A range of progressive policies can accomplish these three goals. More investments in education and transportation can boost economic growth over the longer term, as can policies that push corporations away from their short-term profit orientation and toward long-term value creation. Some of these policies—such as giving shareholders more of a say in how companies are run—coupled with paid time off and more ways for workers to join unions can ensure that workers better benefit from economic growth. Additionally, higher minimum wages, improved access to affordable higher education, and stronger public safety nets can make sure that the most economically vulnerable populations are not left behind.
1. Economic growth, while positive, has been uneven and lackluster for years. Gross domestic product, or GDP, increased in the third quarter of 2015 at an inflation-adjusted annual rate of 1.5 percent, after an increase of 3.9 percent in the previous quarter. The economy has expanded at an average annual rate of 2.2 percent since the recession ended in June 2009. This is far below the historical average growth rate of 3.4 percent from December 1948—when the first recession after World War II started—to December 2007, when the last recession started. Personal consumption increased at an annual rate of 3.2 percent, and spending on housing rose 6.1 percent—a rather modest rate, considering that the housing market still has a lot of catching up to do. Business investment, on the other hand, increased 2.1 percent, highlighting one of the economy’s persistent weak spots. Exports increased by 1.9 percent in the third quarter of 2015, and imports grew at a rate of 1.8 percent. Government spending—which is crucial for infrastructure spending on roads, bridges, and schools, as well as for public services, such as education, public safety, and transportation—continues to be another weak spot in the economy. Federal government spending slightly increased, by 0.2 percent, in the third quarter, and state and local government spending increased a modest 2.6 percent. The economy needs to maintain and even accelerate its momentum in order to create real economic security for America’s families, especially in light of increasing headwinds, most notably economic weaknesses overseas, that could result in weaker exports in the future.
2. U.S. competitiveness is increasing very slowly. Productivity growth, measured as the increase in inflation-adjusted output per hour, is key to strong economic growth over the longer term and to increasing living standards for American families because it means that workers are getting better at doing more in the same amount of time. Slower productivity growth thus means that new economic resources available to improve living standards and to pay for a wide range of services, such as the retirement of Baby Boomers, are growing more slowly than would be the case with faster productivity growth. U.S. productivity rose a total of 5.9 percent from June 2009, the end of the Great Recession, to June 2015. This is an average annualized quarterly growth rate of 1.0 percent in annual terms, far below the quarterly average of 2.2 percent from December 1948—when the first recession after World War II started—to December 2007, when the last recession started. This slow productivity growth—together with high income inequality—contributes to the widespread sense of economic insecurity and slowing economic mobility because the economic resources for families to get ahead are increasing slowly and are very unequally distributed.
3. The housing market still operates at a low level. New-home sales amounted to an annual rate of 468,000 in September 2015—a 2 percent increase from the 459,000 homes sold in September 2014 but well below the historical average of 698,000 homes sold before the Great Recession. The median new-home price in September 2015 was $296,900, up from one year earlier. Existing-home sales increased 8.8 percent in September 2015 from one year earlier, and the median price for existing homes was up 6.1 percent during the same period. Home sales have a lot further to go, given that homeownership in the United States stood at 63.7 percent in the third quarter of 2015, down from 68.2 percent before the start of the recession at the end of 2007. The current homeownership rates are similar to those recorded in 1996, well before the most recent housing bubble started. A strong housing market recovery can boost economic growth, and there is still plenty of room for the housing market to provide more stimulation to the economy more broadly.
4. The outlook for federal budgets improves, which creates breathing room for policymakers. The nonpartisan Congressional Budget Office, or CBO, estimated in August 2015 that the federal government will have a deficit—the difference between taxes and spending—of 2.4 percent of GDP for fiscal year 2015, which runs from October 1, 2014, to September 30, 2015. This deficit projection is an improvement over the actual deficit of 2.8 percent of GDP for FY 2014. The estimated deficit for FY 2015 is much smaller than deficits in previous years due to a number of measures that policymakers have already taken in order to slow spending growth and raise more revenue than was expected just last year. The improving fiscal outlook generates breathing room for policymakers to focus their attention on targeted, efficient policies that promote long-term growth and job creation, especially for those groups disproportionately impacted by high unemployment.
5. Moderate labor market gains follow in part from weak public-sector growth. There were 11.4 million more jobs in September 2015 than in June 2009. The private sector added 12 million jobs during this period. The loss of some 467,000 state and local government jobs explains the difference between the net gain of all jobs and the private-sector gain in this period. Budget cuts reduced the number of teachers, bus drivers, firefighters, and police officers, among others. The average monthly annualized employment growth rate from June 2009 to September 2015 was just 1.3 percent, well below the long-run average of 1.9 percent from December 1948—when the first recession after World War II started—to December 2007, when the last recession started. Faster economic growth and an end to ill-advised austerity at the federal and state levels are necessary to generate more labor market momentum and more well-paying jobs for American families.
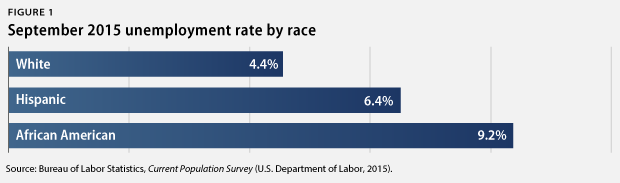
6. Some communities continue to struggle disproportionately from unemployment. The national unemployment rate was 5.1 percent in September 2015. The African American unemployment rate decreased to 9.2 percent, the Hispanic unemployment rate decreased to 6.4 percent, and the white unemployment rate remained at 4.4 percent. Meanwhile, youth unemployment decreased to 16.3 percent. The unemployment rate for people without a high school diploma increased to 7.9 percent, compared with 5.2 percent for those with a high school degree, 4.3 percent for those with some college education, and 2.5 percent for those with a college degree. Amid the weak labor market, population groups with higher unemployment rates have struggled disproportionately more than white workers, older workers, and workers with more education.
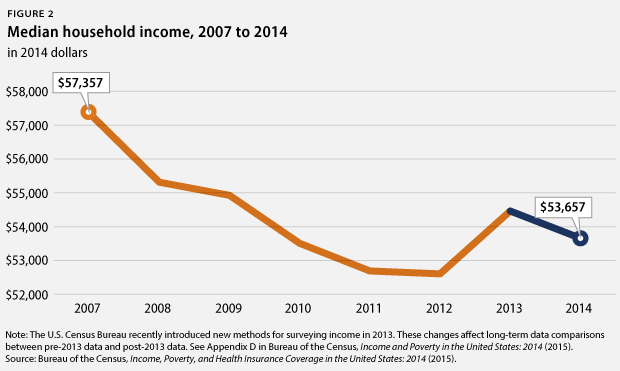
7. The rich continue to pull away from most Americans. Incomes of households at the 95th percentile—those with incomes of $206,568 in 2014, the most recent year for which data are available—were more than nine times the incomes of households in the 20th percentile, whose incomes were $21,432. Analysis by the U.S. Bureau of the Census shows that income inequality remains at or near a record level: In 2014, the top 5 percent of earners captured 21.8 percent of total income, whereas the bottom 40 percent of earners captured 12.3 percent of total income.
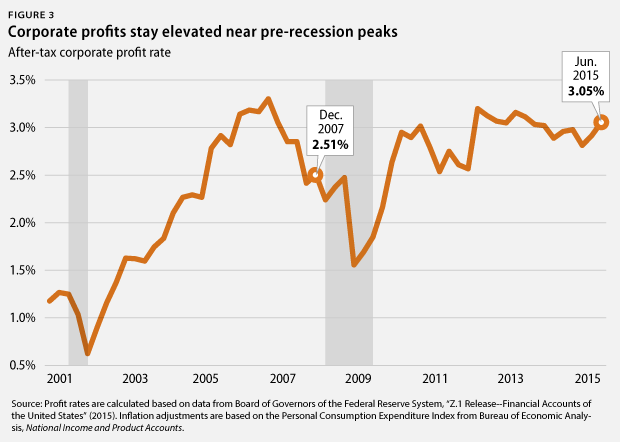
8. Corporate profits stay elevated near pre-crisis peaks. Inflation-adjusted corporate profits were 105.8 percent larger in June 2015 than in June 2009. The after-tax corporate profit rate—profits to total assets—stood at 3.05 percent in June 2015. Corporate profits recovered quickly toward the end of the Great Recession and have stayed high since then. These gains have translated into disproportionate income gains from financial investments for wealthy households, contributing to the massive income inequality that has characterized the economy for the past few decades. Tax reform is a crucial policy priority to address income inequality that arises from the rich receiving outsized benefits from their wealth, especially in the form of capital income from their financial investments.
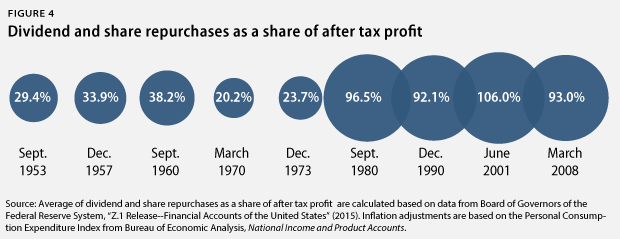
9. Corporations spend much of their money to keep shareholders happy. From December 2007—when the Great Recession started—to June 2015, nonfinancial corporations spent, on average, 93 percent of their after-tax profits on dividend payouts and share repurchases. In short, almost all of nonfinancial corporate after-tax profits have gone to keeping shareholders happy during the current business cycle. Nonfinancial corporations also held, on average, 5.3 percent of all of their assets in cash—a very high rate by historical standards. Nonfinancial corporations spent, on average, 168.3 percent of their after-tax profits on capital expenditures or investments—by selling other assets and by borrowing. This was the lowest ratio since the business cycle that ended in 1957. U.S. corporations have prioritized keeping shareholders happy in the short term and building up cash over investments in structures and equipment that create long-term value. This highlights the need for regulatory reform that incentivizes corporations to invest in research and development, manufacturing plants and equipment, and workforce development.
10. Poverty is still widespread. The official poverty rate was 14.8 percent in 2014. This change, however, was statistically insignificant from 2013. Some population groups suffer from much higher poverty rates than others. The African American poverty rate, for instance, was 25.2 percent, and the Hispanic poverty rate was 24.7 percent, while the non-Hispanic white poverty rate was 10 percent. The poverty rate for children under age 18 was 21.5 percent. More than one-third of African American children—37.1 percent—lived in poverty in 2014, compared with 31.9 percent of Hispanic children and 12.3 percent of white children. Notably, the poverty line is very low compared with the amount of money people actually need to live, and the high shares of people living in poverty are a disgrace for a wealthy country.
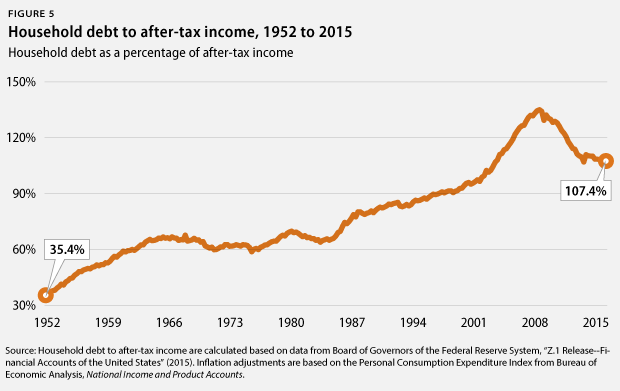
11. Household debt is still high. Household debt equaled 107.4 percent of after-tax income in March 2015, down from a peak of 129.7 percent in December 2007. But nonrevolving consumer credit—mainly student loans—has outpaced after-tax income growth. It has grown from 14.6 percent of after-tax income in June 2009 to 18.7 percent in June 2015. This is the highest share of such debt to after-tax income on record, dating back to 1968. A return to debt growth outpacing income growth—which was the case for total debt prior to the start of the Great Recession—from already-high debt levels could eventually slow economic growth again, as people would have to focus on repaying loans and financial instability would take its toll. This would be especially true if the U.S. Federal Reserve started to raise interest rates. Consumers would have to pay more for their debt, and they would have less money available for consumption and saving, slowing economic growth and job creation.
Christian E. Weller is a Senior Fellow at the Center for American Progress and a professor in the Department of Public Policy and Public Affairs at the McCormack Graduate School of Policy and Global Studies at the University of Massachusetts, Boston. Shiv Rawal and Danielle Corley are Special Assistants for the Economic Policy team at the Center.