The economic recovery that started in June 2009 remains weak by historical standards, but the most recent data shows some good news for both the economy and American families. Gross domestic product, or GDP, grew at a reasonable rate of 2.6 percent between September and December 2014; the labor market added 257,000 in January 2015 alone; and the unemployment rate fell to a low of 5.7 percent, even as discouraged workers—who had been on the sidelines waiting for better times to arrive—reentered the labor market. And, productivity gains—a key measure of innovation and potential future growing in wages and living standards—have consistently picked up steam over the past three quarters, from April to December 2014.
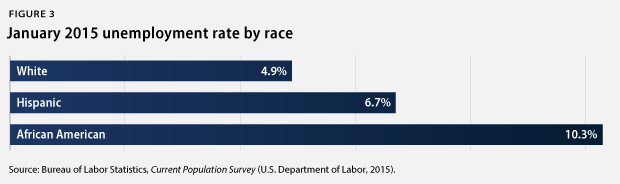
The economy is the healthiest it has been since the end of the Great Recession. However, not everyone is getting their fair share of the recent economic gains. Vulnerable communities, such as African Americans, Latinos, and youths, still struggle disproportionately in this economy. While white unemployment continues to fall under the national average at 4.9 percent, the African American unemployment rate remains relatively high at 10.3 percent, and the Hispanic unemployment rate is 6.7 percent. Meanwhile, youth unemployment stands at a whopping 18.8 percent. Additionally, these communities struggle with lower wages and higher poverty rates compared to their counterparts and lack access to financial tools that are vehicles for saving, such as retirement plans.
The policy challenges are clear. Policymakers need to safeguard and strengthen the recent gains in economic growth and labor market expansions in order to build an economy that works for America’s middle class for years to come. And, policymakers need to focus additional efforts on helping the most vulnerable groups, who still disproportionately struggle as the economy gains steam.
Progressives have a track record that shows they can meet the dual challenge of strengthening growth and helping economically vulnerable populations. Most recently, the policies that progressives have supported in the past—such as the American Recovery and Reinvestment Act, the Affordable Care Act, and the Middle Class Tax Relief and Job Creation Act—have helped both the economy avoid another Great Depression and gain some steam and targeting vulnerable communities in the wake of the Great Recession.
Policymakers now need to build on the successes of past progressive policies by building a healthy economy that promotes inclusive prosperity and bolsters a strong middle class. On the demand side, policymakers can do this by implementing progressive policies that boost wages such as raising the minimum wage, expanding collective bargaining rights, and creating tax incentives that encourage employers to share profits with their employees. On the supply side, targeted public investments in infrastructure and research and development can create long-term job growth.
1. Economic growth, while positive, has been lackluster for years: GDP increased in the fourth quarter of 2014 at an inflation-adjusted annual rate of 2.6 percent, after an increase of 5 percent in the previous quarter. Domestic consumption increased by an annual rate of 4.3 percent, and housing spending rose by 4.1 percent, while business investment grew at a slower rate of 1.9 percent. Exports only increased by 2.8 percent in the fourth quarter, while imports increased by a much faster rate of 8.9 percent, resulting in a widening trade deficit. Government spending continues to be a weak spot in the economy as federal government spending fell by 7.5 percent, and state and local government spending rose only by 1.3 percent. Economic growth improved in 2014 compared to earlier years of this economic recovery, which began in June 2009. But, the economy needs to maintain and even accelerate its momentum in order to create real economic security for America’s families. After all, the economy expanded 13.6 percent from June 2009 to December 2014, far below the average of 25.9 percent during recoveries of at least equal length.
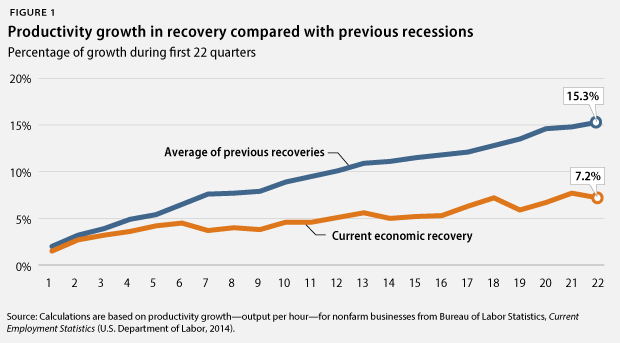
2. Improvements to U.S. competitiveness fall behind previous business cycles. Productivity growth, measured as the increase in inflation-adjusted output per hour, is key to strong economic growth over the longer term and to increasing living standards, as it means that workers are getting better at doing more in the same amount of time. Slower productivity growth thus means that new economic resources available to improve living standards are growing more slowly than would be the case with faster productivity growth. U.S. productivity rose 7.2 percent from June 2009 to December 2014, the first 22 quarters of the economic recovery since the end of the Great Recession. This compares to an average of 15.3 percent during all previous recoveries of at least equal length. No previous recovery had lower productivity growth than the current one. This slow productivity growth—together with high income inequality—contributes to the widespread sense of economic insecurity and slowing economic mobility.
3. The housing market is still only a shadow of its former self. New-home sales amounted to an annual rate of 481,000 in January 2015—an 5.3 percent increase from the 457,000 homes sold in January 2014 but well below the historical average of 698,000 homes sold before the Great Recession. The median new-home price in January 2015 was $294,300, up from one year earlier. Existing-home sales rose by 3.2 percent in January 2015 from one year earlier, and the median price for existing homes was up by 6.2 percent during the same period. Home sales have a lot further to go, given that homeownership in the United States stood at 64 percent in the fourth quarter of 2014, down from 68.2 percent before the start of the recession at the end of 2007. The current homeownership rates are similar to those recorded in 1996, well before the most recent housing bubble started. A strong housing-market recovery can boost economic growth, and there is still plenty of room for the housing market to provide more stimulation to the economy more broadly than it did before the recent slowdown.
4. The outlook for federal budgets improves. The nonpartisan Congressional Budget Office, or CBO, estimated in January 2015 that the federal government will have a deficit—the difference between taxes and spending—of 2.6 percent of GDP for fiscal year 2015, which runs from October 1, 2014, to September 30, 2015. This deficit projection is slightly down from the deficit of 2.8 percent of GDP for FY 2014. The estimated deficit for FY 2015 is much smaller than deficits in previous years due to a number of measures that policymakers have already taken in order to slow spending growth and raise more revenue than was expected just last year. The improving fiscal outlook should generate breathing room for policymakers to focus their attention on targeted, efficient policies that promote long-term growth and job creation, especially for those groups disproportionately impacted by high unemployment.
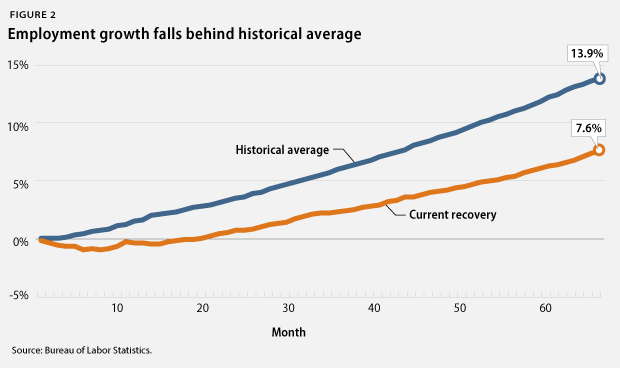
5. Moderate labor-market gains follow in part from modest economic growth. There were 9.9 million more jobs in January 2014 than in June 2009. The private sector added 10.6 million jobs during this period. The loss of some 596,000 state and local government jobs explains the difference between the net gain of all jobs and the private-sector gain in this period. Budget cuts reduced the number of teachers, bus drivers, firefighters, and police officers, among others. The total number of jobs has now grown by 7.6 percent during this recovery, compared to an average of 13.9 percent during all prior recoveries of at least equal length. Faster economic growth is necessary to generate more labor-market momentum.
6. Employers cut back on health and pension benefits. The share of people with employer-sponsored health insurance dropped from 59.8 percent in 2007 to 53.9 percent in 2013, the most recent year for which data are available. The share of private-sector workers who participated in a retirement plan at work fell to 40.8 percent in 2013, down from 41.5 percent in 2007. Families now have less economic security than they did in the past due to fewer employment-based benefits, not just because of modest job and wage gains.
7. Some communities continue to struggle disproportionately from unemployment. The unemployment rate was 5.7 percent in January 2014. The African American unemployment rate fell to 10.3 percent, the Hispanic unemployment rate increased to 6.7 percent, and the white unemployment rate also increased to 4.9 percent. Meanwhile, youth unemployment increased to 18.8 percent. The unemployment rate for people without a high school diploma was 8.5 percent, compared with 5.4 percent for those with a high school degree, 5.2 percent for those with some college education, and 2.8 percent for those with a college degree. Population groups with higher unemployment rates have struggled disproportionately more amid the weak labor market than white workers, older workers, and workers with more education.
8. The rich continue to pull away from most Americans. Incomes of households at the 95th percentile—those with incomes of $196,000 in 2013, the most recent year for which data are available—were more than nine times the incomes of households in the 20th percentile, whose incomes were $20,900. This is the largest gap between the top 5 percent and the bottom 20 percent of households since the U.S. Census Bureau started keeping records in 1967. Median inflation-adjusted household income stood at $51,939 in 2013, its lowest level in inflation-adjusted dollars since 1995.
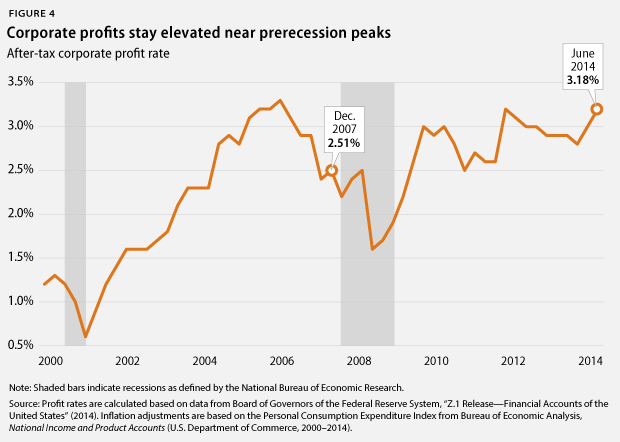
9. Corporate profits stay elevated near pre-crisis peaks. Inflation-adjusted corporate profits were 94 percent larger in September 2014 than in June 2009. The after-tax corporate profit rate—profits to total assets—stood at 3.2 percent in September 2014. Corporate profits recovered quickly toward the end of the Great Recession and have stayed high since then. Addressing income inequality that arises from the rich receiving outsized benefits from their wealth through tax reform is a crucial policy priority.
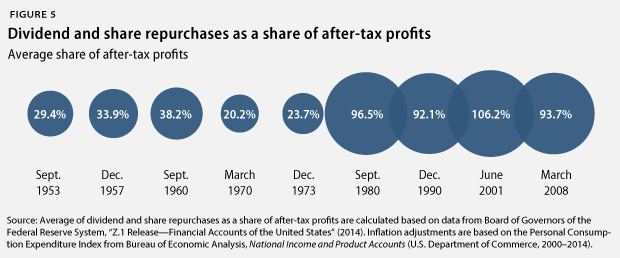
10. Corporations spend much of their money to keep shareholders happy. From December 2007—when the Great Recession started—to September 2014, nonfinancial corporations spent, on average, 98.5 percent of their after-tax profits on dividend payouts and share repurchases. In short, almost all of nonfinancial corporate after-tax profits have gone to keeping shareholders happy during the current business cycle. Nonfinancial corporations also held, on average, 5.3 percent of all of their assets in cash—the highest average share since the business cycle that ended in December 1969. Nonfinancial corporations spent, on average, 169.9 percent of their after-tax profits on capital expenditures or investments—by selling other assets and by borrowing. This was the lowest ratio since the business cycle that ended in 1960. U.S. corporations have prioritized keeping shareholders happy and building up cash over investments in structures and equipment, highlighting the need for regulatory reform that incentivizes corporations to invest in research and development, manufacturing plants and equipment, and workforce development.
11. Poverty is still widespread. The poverty rate was 14.5 percent in 2013, down from 15 percent in 2012. This change, however, was statistically insignificant. Moreover, the poverty rate for this recovery increased at a rate of 0.2 percentage points, compared to an average decrease of 0.7 percentage points in previous recoveries of at least equal length. Some population groups suffer from much higher poverty rate than others. The African American poverty rate, for instance, was 27.2 percent, and the Hispanic poverty rate was 23.5 percent, while the white poverty rate was 9.6 percent. The poverty rate for children under age 18 fell to 19.9 percent. More than one-third of African American children—37.7 percent—lived in poverty in 2013, compared with 30.4 percent of Hispanic children and 10.7 percent of white children.
12. Household debt is still high. Household debt equaled 102.5 percent of after-tax income in September 2014, down from a peak of 129.7 percent in December 2007. But, nonrevolving consumer credit—typically installment credit such as student and car loans—has outpaced after-tax income growth. It has grown from 14.6 percent of after-tax income in June 2009 to 18.1 percent in September 2014. A return to debt growth outpacing income growth—which was the case for total debt prior to the start of the Great Recession—from already-high debt levels could eventually slow economic growth again. This would be especially true if interest rates also rise from historically low levels due to a change in the Federal Reserve’s policies. Consumers would have to pay more for their debt, and they would have less money available for consumption and saving.
Christian E. Weller is a Senior Fellow at the Center for American Progress and a professor in the Department of Public Policy and Public Affairs at the McCormack Graduate School of Policy and Global Studies at the University of Massachusetts, Boston. Jackie Odum is a Research Assistant for the Economic Policy team at the Center.